

XiXinXing/iStock Editorial via Getty Images
JD.com, Inc. (NASDAQ:JD) brings with it a business philosophy that has lasted for 19 years. The philosophy is independent of the type of business and the growth achieved. The three pillars in order of importance are user experience, cost and efficiency.
The management worked hard and achieved important results regarding the first pillar. JD has experienced an astonishing 30% revenue growth over the past 5 years. This figure underlines a great ability to serve customers with impeccable service. Concerning the second and third pillars, the company is still looking for an optimal path. The first results were also seen in 2022 (1.3% EBIT Margin) but we are, in my opinion, still far from data that can attest to healthy and stable profitability (also about the use of capital) in the long term. However, the company is transforming profits in a virtuous way into Free cash Flow and at the same time is using the funds to invest heavily, above all in technology.
In terms of share price valuation, JD.com seems expensive as it contains a large component of future earnings growth. Just waiting to see more sustainable EPS growth, right now, my rating is Hold.
General Overview
JD.com, Inc is a Cayman Islands holding company and operates in China (PRC) through its subsidiaries. JD has no operations of its own and could be defined as a service provider and a supply-chain-based technology enterprise. The mission is to serve customers through superior experiences level. The Company operates mainly through the JD.com website also available on apps and all mobile devices.
Online e-commerce is active since 2010, but the Company was born 19 years ago. JD is a full supply chain service provider and takes care of procurement, manufacturing, warehousing, and delivery up to the final customer.
One of the company’s competitive advantages could be found in the investment in technology on the cloud, big data, and Artificial Intelligence.
Financial and Highlights
Great Revenue Growth with a last Q3 slowdown
JD Financial and Operational Highlights 2022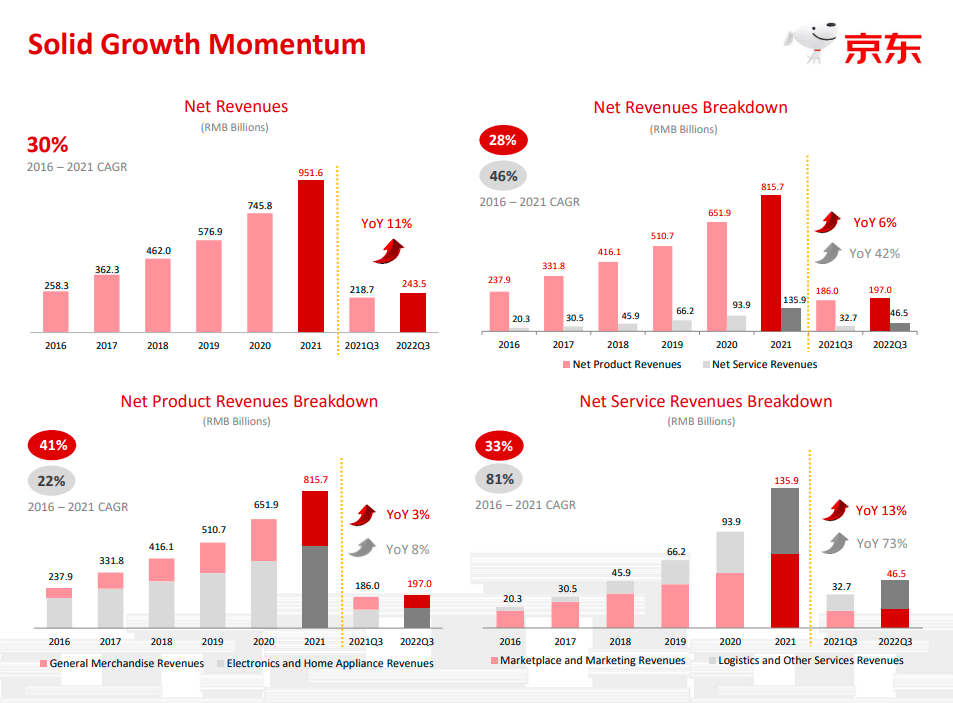
30% is the compound growth rate of total revenue from 2016 to 2021 and this represents an outstanding rate. Moving on to the analysis of Q3, we note how the growth rate “dropped” to 11%.
Going into the merits of the two main segments (products and services) we can see how 30% is the result of the mix between 28% (products) and 46% (services) and above all that the heaviest deceleration in Q3 was on the products sector with growth reduced to single digits (6%). Services, on the other hand, accelerated, recording an excellent +42% (Q3).
Going further into detail, we note how Electronics and Home Appliances are performing better (+8%) than General Merchandise (+3%) and that this trend has reversed compared to past years.
As far as services are concerned, Logistics is exploding with +73% in Q3 and an annual CAGR of +81%.
Related to the logistic segment we can underline from the last Q3 earnings call:
Notably, both the number of JDL’s external customers and external revenue delivered double-digit year-on-year growth with the latter contributing nearly 70% of its total revenue in Q3. Moreover, JDL continued to expand its logistics infrastructure around the world. As of the end of Q3, JDL operated over 1,500 warehouses with an aggregate gross floor area of over 30 million square meters. It is also worth highlighting that JD Logistics Airlines, an affiliate of JD Logistics, commenced operation in Q3.
And related to the service:
I’m proud to share with you, according to China’s Post Bureau service recently, in terms of the service experiences, JD Logistics stands number one among this industry
The growth of the sector is therefore mainly due to external customers to JD and this strategy is bringing excellent results in both economics and brand reputation. Also noteworthy are the new investments starting in Q3 concerning the Air sector.
Profitability improves but still has a long way to go
The following slide shows how the “emerging” sectors in Q3 2022 have stopped draining resources from corporate EBIT and are finally producing profits.
JD Financial and Operational Highlights 2022
In particular, I underline how JD Logistic went from -RBM0.7 billion (2021Q3) to +RBM0.3 billion (2022Q3) and also how the new Dada project/acquisition started with a slight loss -RBM0.3 billion that is fully compensated by New business operating income of +RBM0.3 billion.
EBIT, ROCE, and Capital Turnover
JD 20-F Form + Author Graph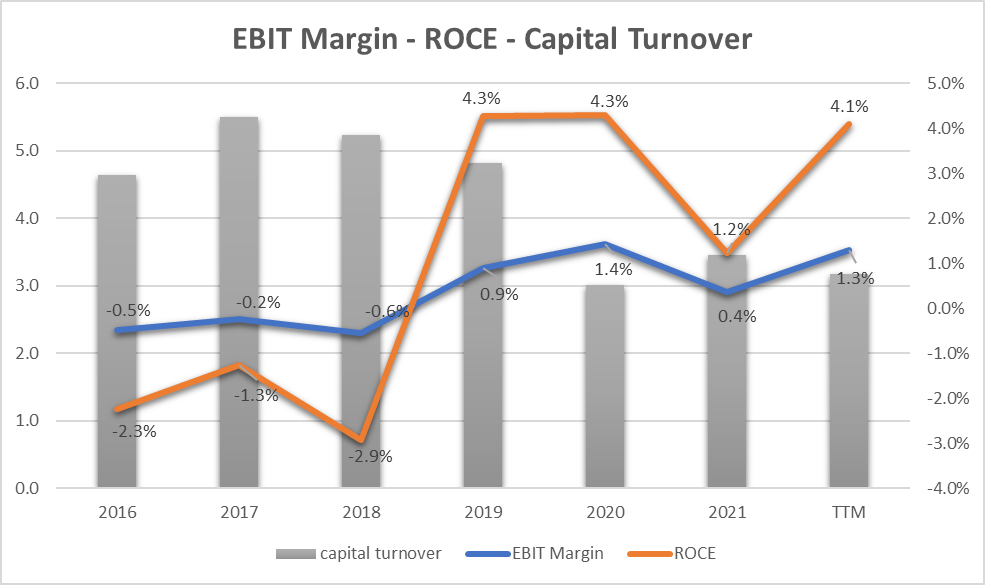
The graph shows the trend of the EBIT Margin (blue line) from 2016 (-0.5%) to today (1.3%). The growing trend certainly represents a positive fact but the absolute values are, to date, still too modest for a top retailer player.
The Company Management underlines also this concept in the last earnings call:
“Although we achieved a very important milestone for net income this quarter at the group level, on an annual basis, our margin is still below the industry level for almost all business segments. So we always — so there’s still room for us to continue to improve our bottom line performance.”
The gray bars show the trend of Capital Turnover ($1 employee in the company produces $3.2 – TTM – in sales today). The latest data ($3.2) in absolute value is not bad but the downward trend since 2016 is not a good indicator of capital utilization.
ROCE (Return on Capital Employed) is the product of EBIT and Capital Turnover. As already anticipated, the figure of 4.1% (TTM) for EBIT is positive but requires a long way to go to achieve satisfactory results.
EPS, Free Cash Flow, and CapEx
JD 20-F Form + Author Graph
2019 was the breakthrough year for JD or the year in which the company began to produce profits. The graph shows the EPS trend (grey bars) and we can see a trend that has a certain stability from 2019 onwards. The blue bars instead indicate the FCF/Share and these also show how the company has been able to transform profits into cash flow in a fairly stable manner in recent years. This represents a positive element from a long-term perspective.
As we can hear in the latest earnings call, the increase in EPS in 2022 compared to 2021 is mainly due to economies of scale:
JD Retail’s fulfilled gross margin was up 80 basis points compared to the same quarter last year, mainly driven by our optimization efforts and the improving economies of scale. Also, as we continued to expand gross margin for most categories and remained disciplined in OpEx
The yellow line shows the trend of the CapEx to depreciation ratio. The value is very high and even if the company asserts that it tries to be very disciplined on CapEx, we can assert that the investments are huge as they are 2.6 times higher than the depreciations and that the trend since 2019 is an increasing type and this could indicate overspending by the company.
Valuation
EPS Growth Model
Since the company is showing growth in terms of Revenue and EPS, I decided to use the EPS growth parameter over the last 4 years as an estimate of future growth. 19.2% is the growth rate (CAGR) of EPS from 2019 ($0.46) to 2022 ($0.78).
The Formula is (by popular investor Benjamin Graham):
Intrinsic value per share = EPS x (8.5 + 2 g)
Where
EPS = earnings per share
g = EPS growth rate = 19.2%
Author Calculation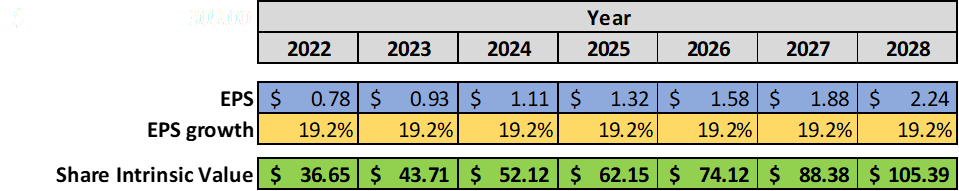
Example of calculation for 2023:
Intrinsic value per share = EPS x (8.5 + 2 g) = 0.93x(8.5+2×19.2) = $43.71
The last intrinsic value of $105.39 for 2028 underlines an annualized return of 10.5% as the current share price is $58.
10.5% is the annualized expected return for the investment in JD. It’s not a bad figure in absolute value but it requires great confidence that the EPS growth rate can remain at 19.2% for the next 7 years and this represents an element of risk especially if we look at the operating margin growth trend.
FCF/Share Model
To define a maximum buying price, I use a formula based on FCF/Share and interest rate.
The formula is:
Maximum buying price = Cash profit per Share/interest rate – 20% (safety discount)
Using the last FCF/share of $1.86
Interest Rate=inflation Rate = 7.75%
Maximum price before Safety discount = 1.86/7.75%= $24.8
The maximum price at 20% discount = $20.7
Under the FCF/Share analysis, it seems that the actual price of $58 is highly overrated or, in other words, it contains a lot of future growth value inside.
Peers
To compare JD with similar companies in terms of market capitalization in the Consumer Discretionary sector in the Internet and Direct Marketing Retail Industry I have defined the following peers:
- Pinduoduo Inc. (PDD)
- MercadoLibre, Inc. (MELI)
- Coupang, Inc. (CPNG)
- Alibaba Group Holding Limited (BABA)
Using Seeking Alpha’s Quant Ratings, we have a ‘Strong Buy’ verdict related to the ‘Hold’ rating or also ‘Strong Buy’ of the other companies.
Seeking Alpha
Analyzing the factor grades, we can see how JD is preferable in terms of Profitability and EPS revisions. As also defined in the previous paragraph in terms of Valuation, the company is not the best performer with a C- rating.
Seeking Alpha Seeking Alpha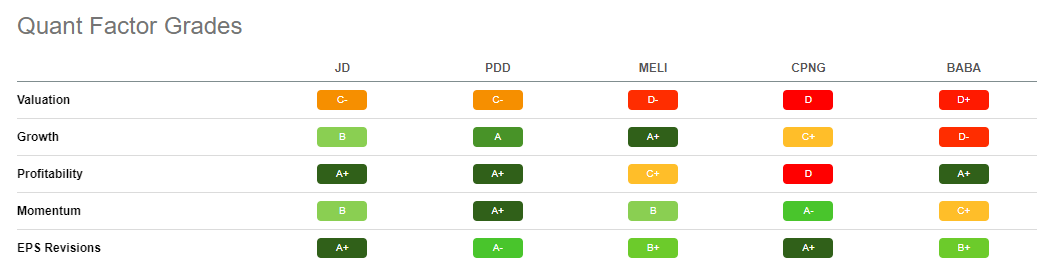
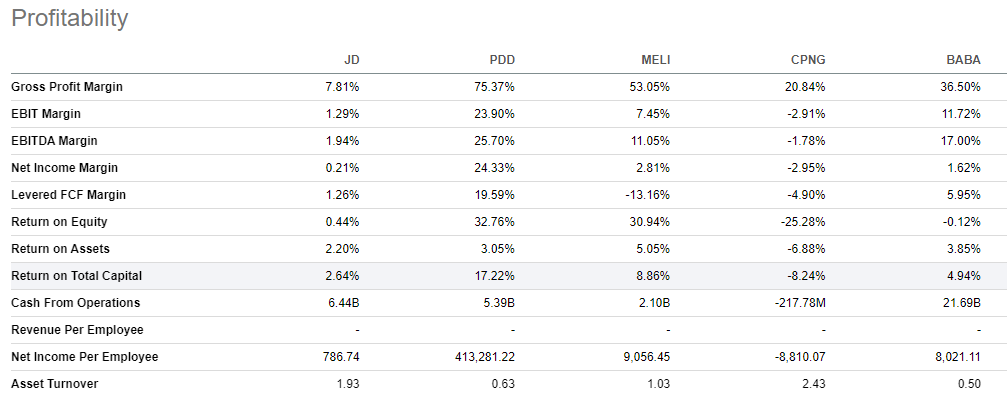
Returning to the topic of profitability, we can see how JD’s Gross Margin (7.81%) is by far the lowest of all the competitors. Excluding CPNG which has a negative figure, the EBIT Margin (1.29%) is also much lower than all peers.
Risks
Slow EBIT growth
From the last Earnings call we can hear:
“For JD’s growth throughout the years, there are two main drivers. One is for the product structure changes. With a higher percentage of certain products, their gross margins will improve steadily, and also the increase in revenue from the services we provide. So throughout the years, you can hear that all the companies are talking about lower the cost and improve efficiency. And for JD.com, this year, we focus more on lower the cost and to improve stability for the internal management. And I believe in next year and the year — in the next 2 years, we will focus more on the improvement of the efficiency. I can see there’s many areas we can continue to improve efficiency.”
And we can understand how the issue of the company’s margins is important and that management also has the stabilization of the figure in the period as a target. In the next two years, the target is also efficiency, which can also be achieved by changing the product mix. Management sees many areas for improvement and in my opinion, this strategy of stabilization and expectation could represent a risk if the EBIT margin and ROCE do not reach values comparable to competitors in the short to medium term.
Uncertainties and changes in PRC regulation
From the 2021 FORM 20-F:
“If the PRC government deems that our contractual arrangements with our variable interest entities do not comply with PRC regulatory restrictions on foreign investment in the relevant industries, or if these regulations or the interpretation of existing regulations change or are interpreted differently in the future, we could be subject to severe penalties or be forced to relinquish our interests in those operations.”
This is an exogenous and high-risk factor in a country where the government could change the rules of the game overnight, shareholders cannot sleep peacefully and put it in the drawer that this type of investment will always have a slight degree of intrinsic risk linked to the laws in PRC.
Bottom Line
In double-digit growth, for many years JD has seen positive earnings starting from 2019. EBIT Margin and ROCE are growing very slowly and the absolute figures (1.3% and 4.1% respectively) are still low, especially when compared with companies in the Consumer discretionary sector. The share price evaluation underlines that the current price contains a large component of future growth and using a growth parameter of 19.2% of the EPS for the next 7 years, we obtain an expected return of 10.5% per annum. The general context is not risk-bearing (even independent of company management) and therefore, under current conditions, my rating is Hold.
Be the first to comment