

Japanese Yen, USD/JPY, Bond Yields, Technical Analysis – Asia-Pacific Briefing:
- Japanese Yen sees strong 2-day gain versus the US Dollar
- USD/JPY’s drop coincided with softer US Treasury yields
- The exchange rate broke under a key exponential trendline
Recommended by Daniel Dubrovsky
Get Your Free JPY Forecast
The Japanese Yen outperformed its major counterparts, especially versus the US Dollar. Over the past two days, USD/JPY sank about 1.9 percent during the worst performance since May. Beyond that, the move was quite a rare event. Looking back to data since the beginning of 2000, the 1.9% drop amounted to -2.2 standard deviations from the average.
A closer look at the Yen’s price action over the past 24 hours reveals that the currency’s strength coincided with a weakening in longer-term United States bond yields. The 10-year Treasury yield dropped almost -1.8% in the worst performance since June 20th. This was despite a slew of Fedspeak where policymakers reiterated that the likely scenario ahead is for higher interest rates and perhaps for longer too.
Perhaps traders were positioning themselves for this week’s US inflation report. On Wednesday, headline inflation is seen slowing further from 4.0% y/y in May to 3.1% y/y in June. However, this is largely thanks to disinflation in food and energy prices. The far less volatile core reading is seen ticking lower to 5.0% y/y from 5.3% prior.
This is not good news for the Federal Reserve as it would suggest that underlying inflation is becoming entrenched and stickier to deal with. Perhaps investors are looking to a softer print and perhaps a less hawkish Fed. This would benefit the Japanese Yen because its fundamentals are tied to external factors due to a stagnant Bank of Japan. As such, USD/JPY is quite sensitive to Treasury yields.
Japanese Yen Technical Analysis
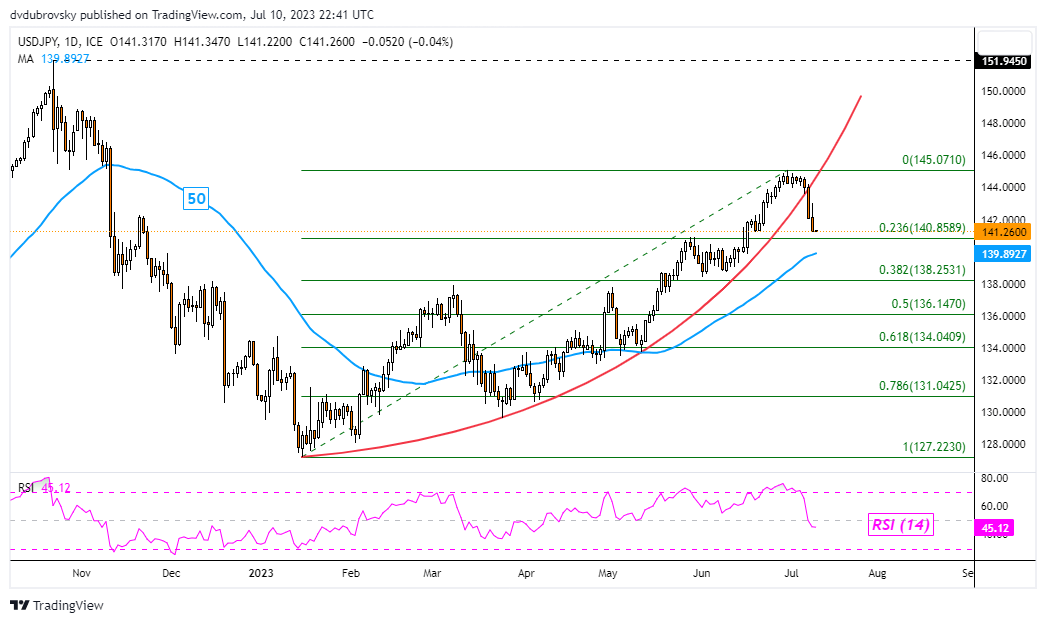
The drop in USD/JPY over the past 2 days saw the exchange rate confirm a bearish breakout from what was an increasingly faster uptrend since the beginning of this year – see chart below. That has exposed immediate support, which is the 23.6% Fibonacci retracement level at 140.85. Beyond that sits the 50-day Simple Moving Average. The latter could hold, maintaining the broader upside focus.
Trade Smarter – Sign up for the DailyFX Newsletter
Receive timely and compelling market commentary from the DailyFX team
Subscribe to Newsletter
USD/JPY Daily Chart
— Written by Daniel Dubrovsky, Senior Strategist for DailyFX.com
Be the first to comment