

William_Potter
Introduction
Janus Henderson Group (NYSE:JHG) published its 4Q22 result on 02 February 2023. The market was clearly happy with the update – the stock bounced +13.4% on the day of the release. In this note, I highlight interesting aspects of the 4Q22 result and provide comments on topics that I consider particularly relevant for the stock’s investment case. I also review my fundamental valuation of JHG and refresh my rating on the company (noting that I downgraded JHG to hold in November 2022).
Net Flows – Another Tough Quarter
Net flows for 4Q22 were a disappointing -$11.0bn. Management were quick to explain that this outcome included -$7.0m of mandate losses that had been flagged in advance with the 3Q22 result. Excluding these pre-warned mandate losses, we are still left with a large net outflow of -$4.0bn.
Historically, JHG’s presentation materials have shown net flow data in dollar terms and also expressed as annualised percentages of AUM (refer Chart 1 for the 3Q22 data). The annualised flow rates are obviously more meaningful than the absolute dollar flow data. I was somewhat surprised to see JHG remove the annualised flow rates from the net flow data presentation. The sceptic in me can’t help but think that management were not keen to highlight that 4Q22 redemptions were running at an annualised rate of -37.6% of the opening AUM for the period. Annualised net outflows for 4Q22 were -16% of the quarter’s opening AUM – the worst result observed since I began covering the stock in 2018.
Chart 2 shows JHG’s new presentation of net flows (which excludes the annualised flow rates). Chart 3 plots my calculation of quarterly net flow rates (not annualised) and clearly illustrates that 4Q22 was a particularly poor outcome for the company.
Chart 1 (data excludes Intech, the sale of which completed 31 March 2022):
Source: JHG 3Q22 Presentation, slide 4.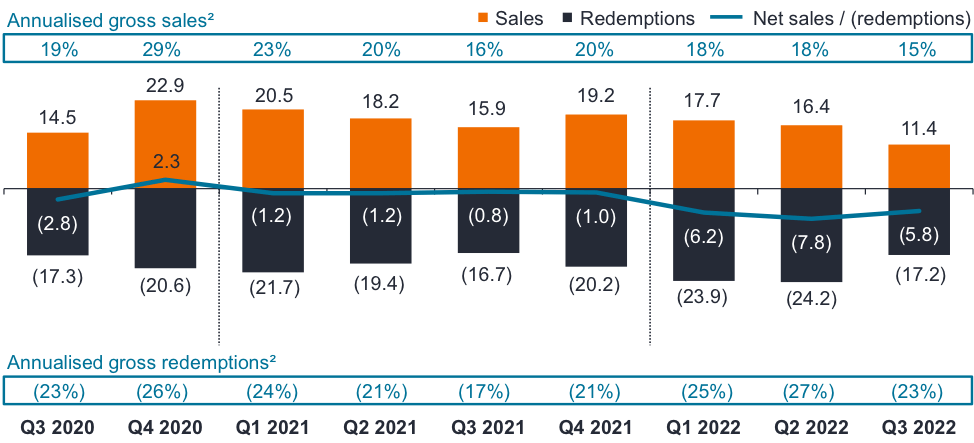
Chart 2: (data excludes Intech, the sale of which completed 31 March 2022):
Source: JHG 4Q22 Presentation, slide 5.
Chart 3:
Source: Created by author using data from JHG financial reports.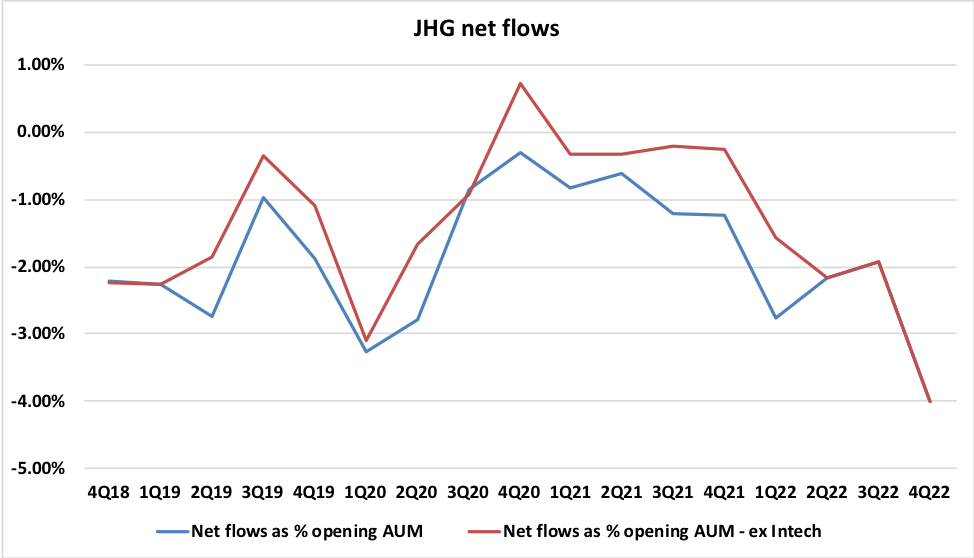
It’s not all bad news on flows. In the 4Q22 management speech, CFO Roger Thomson noted that in contrast to recent quarters, the company heads into 1Q23 without needing to pre-warn the market of large known future client redemptions. Also, the 4Q22 sales performance was actually quite strong, coming in at +5.4% of quarter opening AUM (as compared to an average of +4.8% per quarter over the period 3Q18 to 3Q22), with management pointing to good outcomes from the Institutional sales channel.
Investment Management Fee Margin Analysis
In the 4Q22 management speech, CFO Thomson pointed to JHG having a better outcome than competitors on the investment management fee margin front. Whilst the headline data on JHG’s investment management fee margin supports the CFO’s statement, we should dive deeper to get a clearer picture of what has happened. Has JHG executed better than peers (in which case a bit of corporate bragging is fair enough), or are there other external factors at play?
Net management fee margin for the fourth quarter was 50.7 basis points, which is higher compared to both the prior quarter and the same period a year ago and makes Janus Henderson stand out from its competitors.
Source: JHG 4Q22 Transcript, page 7, Seeking Alpha.
At each 4Q result, JHG provides a snapshot of average investment management fee margins by asset class. I summarize this data below (Table 1) for each of the last five years. It should be noted however that within an asset class there is likely to be a material difference in margin levels between Intermediary (retail) and Institutional products/mandates, with Intermediary AUM typically carrying a higher margin.
Table 1:
Source: created by author using data from JHG financial reports.
At the headline level, JHG’s investment management fee margin has expanded from 45.6bp in FY20 to reach 49.6bp in FY22. The majority of this expansion has been driven by the sale of Intech (quantitative equities). On an ex-Intech basis, the margin expansion has been much more modest at +0.5bp over the two years. In Chart 4 below, I track JHG’s investment management fee margin on a quarterly basis from 3Q18 to 4Q22.
Chart 4:
Source: author’s calculations using data from JHG financial reports.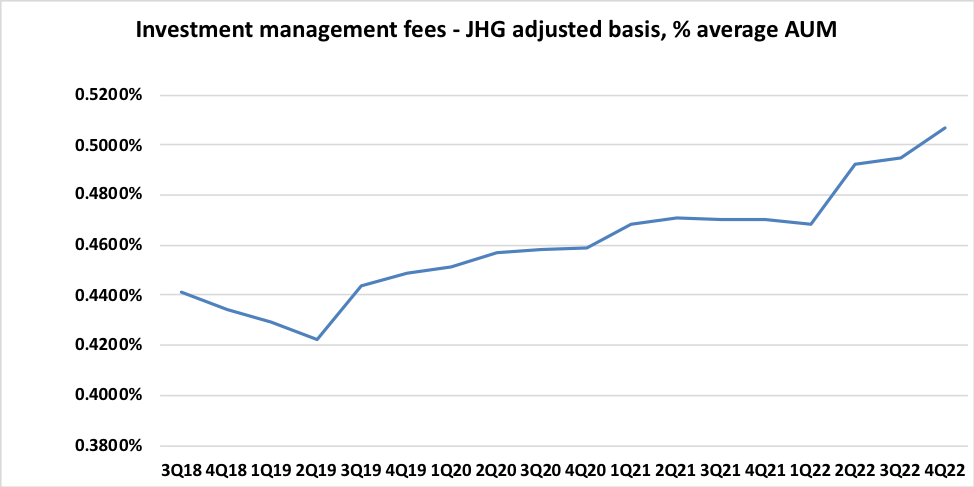
Although Chart 4 paints a nice margin expansion picture for JHG, it fails to capture the influence of business mix changes on the investment management fee margin. Chart 5 (AUM by capability) and Chart 6 (AUM by client type) help us to get a feel of how business mix has changed over time.
Chart 5:
Source: author’s calculations using data from JHG financial reports.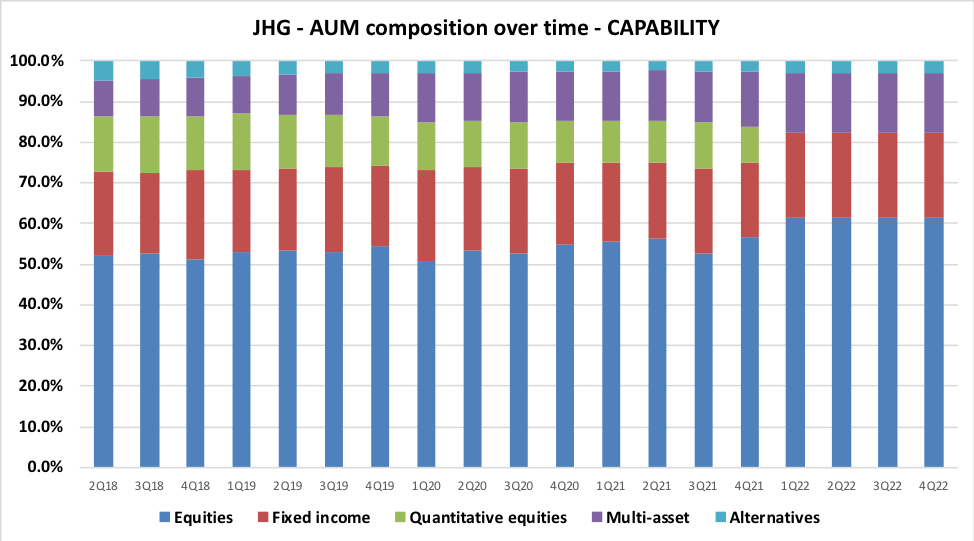
Chart 6:
Source: author’s calculations using data from JHG financial reports.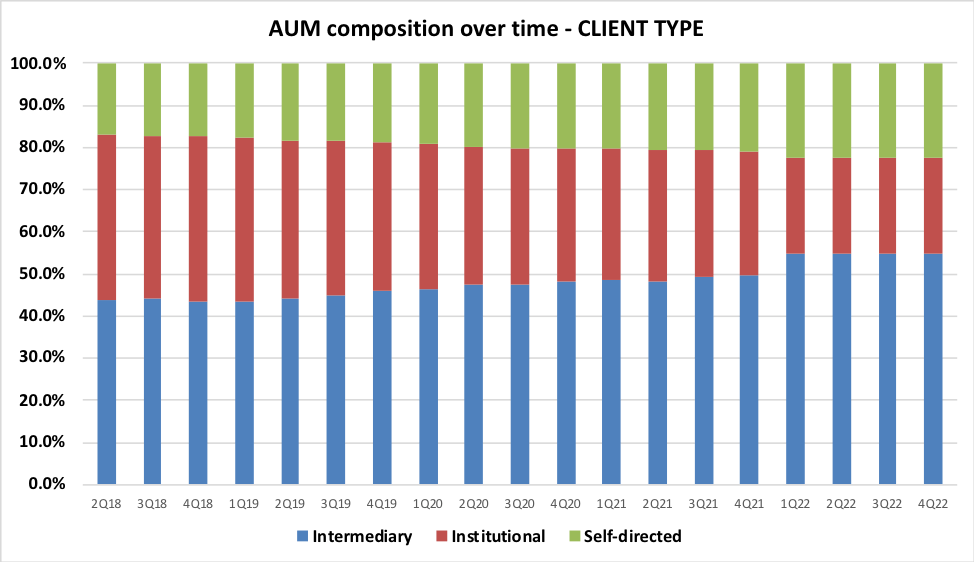
There are several factors that I believe have had positive impacts on the group average investment management fee margin (note that some of these are linked):
- The gradual shrinking of Intech (quantitative equities) and eventual sale of the business. Intech was a low margin product.
- The gradual expansion of Multi-Asset’s share of AUM ought to benefit the margin given that products in this segment are mainly sold through the Intermediary channel.
- There has been a consistent decrease in the share of AUM attributable to Institutional clients which I would expect (on average) to have had a significantly lower margin than the rest of JHG’s AUM mix.
Where does the investment management fee margin go from here? The answer to that question depends largely upon your view regarding how JHG’s business mix will move in the future. Given the high number of variables at play, I would argue that detailed modelling of changes in future business mix cannot be done with a high degree of confidence. The group’s new strategy (under ‘Protect and Grow’) places a lot of emphasis on the Intermediary channel, and success in that area would probably push up the average investment margin. However, JHG has commented that Institutional sales have been strong in recent quarters, and the ‘Amplify’ strategy plan will attempt to grow Institutional further, putting downward pressure on the average investment margin. Note that my general approach is to take the most recent quarterly investment management fee margin as a key input for valuation purposes, modified in line with changes in asset class mix driven by mark-to-market movements.
New CEO Driving Change
JHG’s CEO, Ali Dibadj, has been in the top job for less than a year but has already made significant changes. I refer readers to my August 2022 JHG note for discussion regarding early executive team turnover. In the 4Q22 materials, CEO Dibadj referenced the recent hiring of Michael Schweitzer who has been tasked with leading the push to grow JHG’s North America retail (or Intermediary in JHG speak) business. The slide below highlights that the group’s US Intermediary sales team is going through a significant transformation – a new leader, structural reorganization and a revised bonus scheme. This seems like a material re-set for the US Intermediary sales function, and the moves are bound to be somewhat disruptive in the near term. Time will tell whether or not the revised strategy pays off. I note that staff turnover has extended beyond the distribution function, with changes also occurring within the group’s portfolio management teams.
Source: JHG 4Q22 Presentation, slide 15.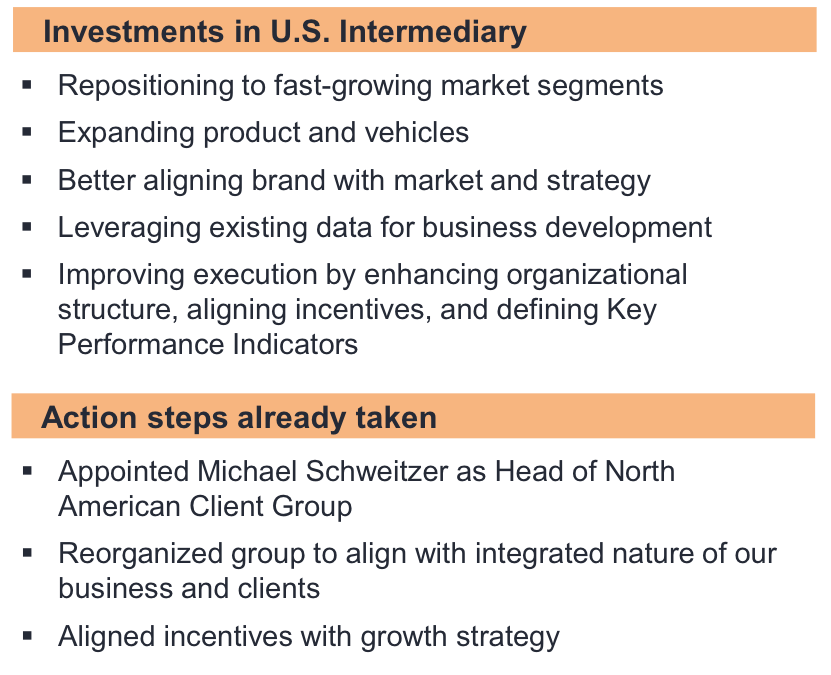
Buyback Activity Paused – M&A Ahead?
JHG’s Board approved a $200m on-market buyback program in May 2022, with a scheduled end date of 31 March 2023. Despite several periods of share price weakness since 30 June 2022, the company has not bought back any further stock. The justification regarding the lack of buyback action in 4Q22 provided by the CFO during the 4Q22 management speech is set out below:
Given current market volatility and to maintain that balance sheet flexibility, we’ve been conservative and purposeful in our approach to capital management and elected not to buy back stock in the fourth quarter.
Source: JHG 4Q22 Transcript, page 8, Seeking Alpha.
I am not convinced that the CFO’s explanation regarding the failure to repurchase stock in recent months tells the whole story. CEO Dibadj has made comments in previous presentations regarding potential acquisitions and team lift-outs to expand and/or diversify product offerings. The 4Q22 presentation includes references to development of new products, solutions and capabilities. Discussion in the 4Q22 Q&A session made it clear that the strategic direction set by CEO Dibadj is highly likely to involve M&A activity. At present, management comments point to ‘bolt-on’ or ‘complimentary’ deals being done, rather than a big-bang acquisition with deal economics driven by cost-synergy savings.
It is not possible to predict in advance whether acquisitions completed by JHG will be more value accretive to shareholders than continued share buybacks. Personally, I do not like to see companies sitting on excess capital for long periods. I’m also concerned that CEO Dibadj’s comments regarding the group’s strategic direction have now set a market expectation that deals will follow, such that management and the Board may feel pressured to transact; this isn’t exactly a ‘forced buyer’ scenario, but the landscape is moving in that direction.
Source: JHG 4Q22 Presentation, slide 36.
Conclusion – HOLD rating maintained
My fair-value benchmark for a fund manager is a P/E of around 12x. At $27.81 per share (market close 10 February 2023), using JHG’s 4Q22 reported AUM, my normalized valuation framework generates a base case P/E of 12.2x.
Markets have been strong so far in 2023, and this will almost certainly have pushed JHG’s AUM materially above the reported 4Q22 levels. As an illustration of this point, the recent announcement from Franklin Resources (BEN) disclosed that BEN’s 31 January 2023 AUM was 4.6% above 31 December 2022 levels, despite the group suffering net outflows over the month.
At $27.81 per share (market close 10 February 2023), using my estimated mark-to-market of JHG’s AUM, my normalized valuation framework generates a base case P/E of 11.2x. On this mark-to-market basis, JHG therefore looks to be slightly cheap.
I am not in the business of making macro-economic forecasts or bold predictions regarding near-term movements in equity markets. That said, given a number of obvious and material risks for investment markets, the recent bounce in equity indices leaves me feeling rather nervous about valuing JHG based on a mark-to-market of AUM. Market bulls often (and unfairly in my opinion) dismiss the writings of GMO’s Jeremy Grantham as being the views of a ‘perma-bear’ – but I found Grantham’s recent note rather persuasive. Grantham highlights downside risks, but notes that the timing of a market correction is difficult to predict.
Now things get more complicated. While the most extreme froth has been wiped off the market, valuations are still nowhere near their long-term averages. Further, in the past, they have usually overcorrected to below trend as fundamentals deteriorated. Such an outcome still remains highly likely, but given the complexities of an ever-changing world, investors should have far less certainty about the timing and extent of the next leg down from here. In fact, a variety of factors – especially the underrecognized and powerful Presidential Cycle, but also including subsiding inflation, the ongoing strength of the labor market, and the reopening of the Chinese economy – speak for the possibility of a pause or delay in the bear market. How significantly corporate fundamentals deteriorate will mean everything during the next twelve to eighteen months.
Source: AFTER A TIMEOUT, BACK TO THE MEAT GRINDER! By Jeremy Grantham.
For investors feeling bullish about equity markets, I think that JHG has just about enough fundamental valuation appeal to warrant a BUY rating. However, for investors who are neutral or slightly bearish regarding the outlook for equity markets (such as myself), JHG looks to be trading at around fair value. In terms of operational trends, in order to feel confident about a BUY call on JHG, I would like to see evidence of an improvement in net flows. I therefore conclude this review of JHG with a HOLD rating.
Be the first to comment