

Viorika
In this analysis of Jack Henry & Associates, Inc. (NASDAQ:JKHY), we analyzed the company following its latest earnings briefing where management reaffirmed its guidance for revenue growth to be between 8.2% to 8.6% for FY2023. The company has a strong track record of positive stable growth, with a 5-year average of 6.98% and a 10-year average of 5.76%. Thus, we analyzed the company’s revenue growth and then determined whether it could maintain its stable growth outlook based on its market positioning in the core banking segment and issuer payment processing and the market growth outlook of the core banking and payment processing markets.
Stable Growth And Profitability
|
Earnings & Margins |
2013 |
2014 |
2015 |
2016 |
2017 |
2018 |
2019 |
2020 |
2021 |
2022 |
|
Revenue Growth |
-0.67% |
5.93% |
7.07% |
7.83% |
2.49% |
5.94% |
5.57% |
9.30% |
3.60% |
10.51% |
|
Gross Margin (%) |
41.66% |
42.09% |
42.66% |
42.89% |
41.95% |
42.00% |
40.56% |
40.58% |
39.52% |
41.91% |
|
EBIT Margin |
22.65% |
24.57% |
24.76% |
25.26% |
24.38% |
24.18% |
22.37% |
22.43% |
22.68% |
24.43% |
|
Net Margin (%) |
15.13% |
15.91% |
16.81% |
18.37% |
16.54% |
24.82% |
17.51% |
17.48% |
17.72% |
18.68% |
|
Free Cash Flow Margin |
19.03% |
17.88% |
18.83% |
16.99% |
15.53% |
8.16% |
15.49% |
18.42% |
17.04% |
15.84% |
Source: Jack Henry, Khaveen Investments.
Based on the table above, the company has stable revenue growth with a 10-year average of 5.76% and a 5-year average of 6.98%. According to the company’s annual report, it generates revenue from various streams including “data processing, transaction processing, software licensing and related services, professional services, and hardware sales.”
In contrast, other fintech companies such as PayPal generate revenue primarily from transaction revenues. Thus, we believe that Jack Henry’s revenue streams such as from software licensing provide relatively more stability with fixed fees in comparison to transaction processing which depends on their customers’ business activity and transaction volumes.
Additionally, the company enters into long-term agreements with customers. According to Jack Henry,
customers electing to outsource their core processing typically sign contracts for seven or more years that include per account fees and minimum guaranteed payments during the contract period.
Furthermore, the company also has stable profitability as seen by its gross, EBIT, net and FCF margins. Based on the table, the company’s average 10-year gross, EBIT, net and FCF margins were 41.58%, 23.77%, 17.9% and 16.32% respectively.
|
Company |
Revenue CAGR (5-yr) |
Net Margins (5-year Average) |
|
Fiserv (FISV) |
9.9% |
12.0% |
|
Jack Henry |
10.6% |
18.5% |
|
FIS Global (FIS) |
7.1% |
6.5% |
|
CSI |
8.6% |
18.3% |
|
Finastra |
-1.0% |
N/A |
|
Average |
7.0% |
13.8% |
Source: Company Data, Khaveen Investments.
Furthermore, in comparison with competitors, the company has the highest revenue growth and net margins on a 5-year average. However, its competitors’ revenue growth and net margins are fairly close to the average revenue growth and net margins except for Finastra.
Stable Market Share In Core Banking And Issuer Payment Processing Markets
FedFIS, Khaveen Investments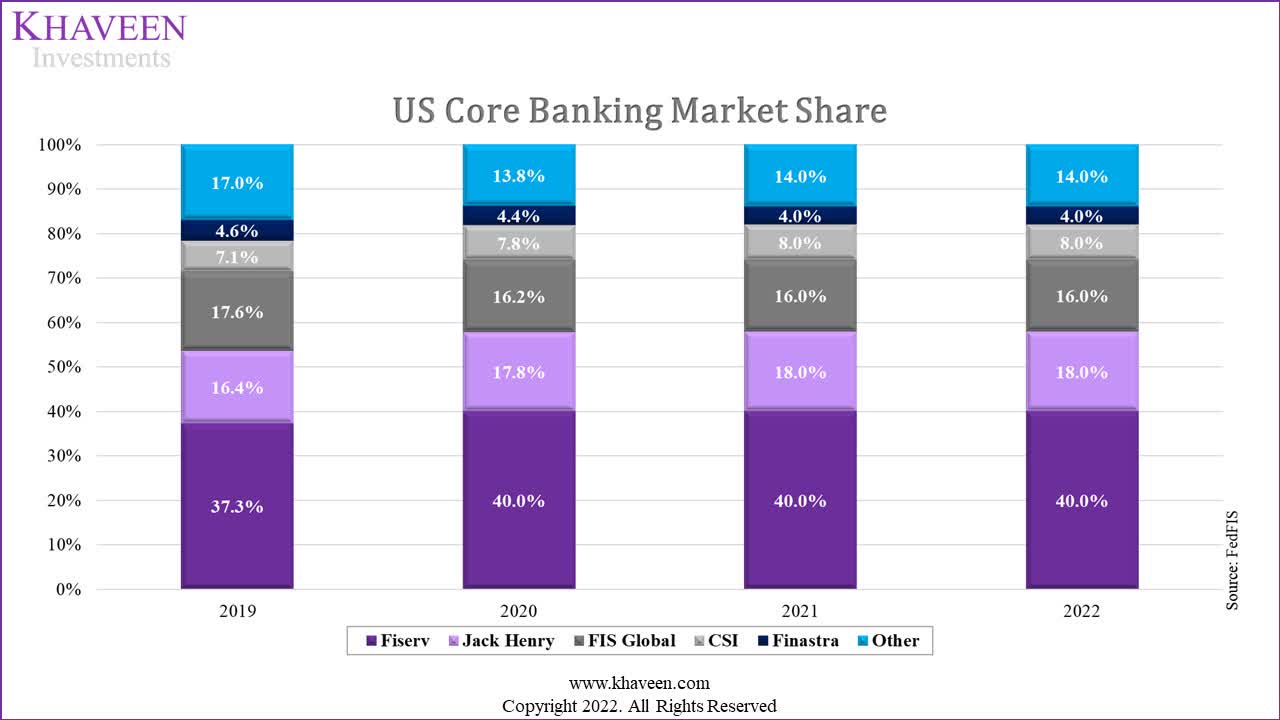
Based on FedFIS, Jack Henry is the second largest core banking software company in the U.S. in 2022. The company maintained its positioning behind Fiserv since 2020 when it overtook FIS Global and had a stable market share through 2022. The companies which outperformed the market were Fiserv, Jack Henry and CSI. On the other hand, FIS Global and Finastra underperformed their competitors as their shares declined. We believe one of the factors for its stable market share is the high switching costs for its clients for bank core solutions. According to McKinsey,
for a medium-size bank, the cost of this integration could exceed $50 million depending upon its complexity; for larger banks, $300 million to $400 million is not unheard of (based on estimates for traditional implementations).
Company Data, Khaveen Investments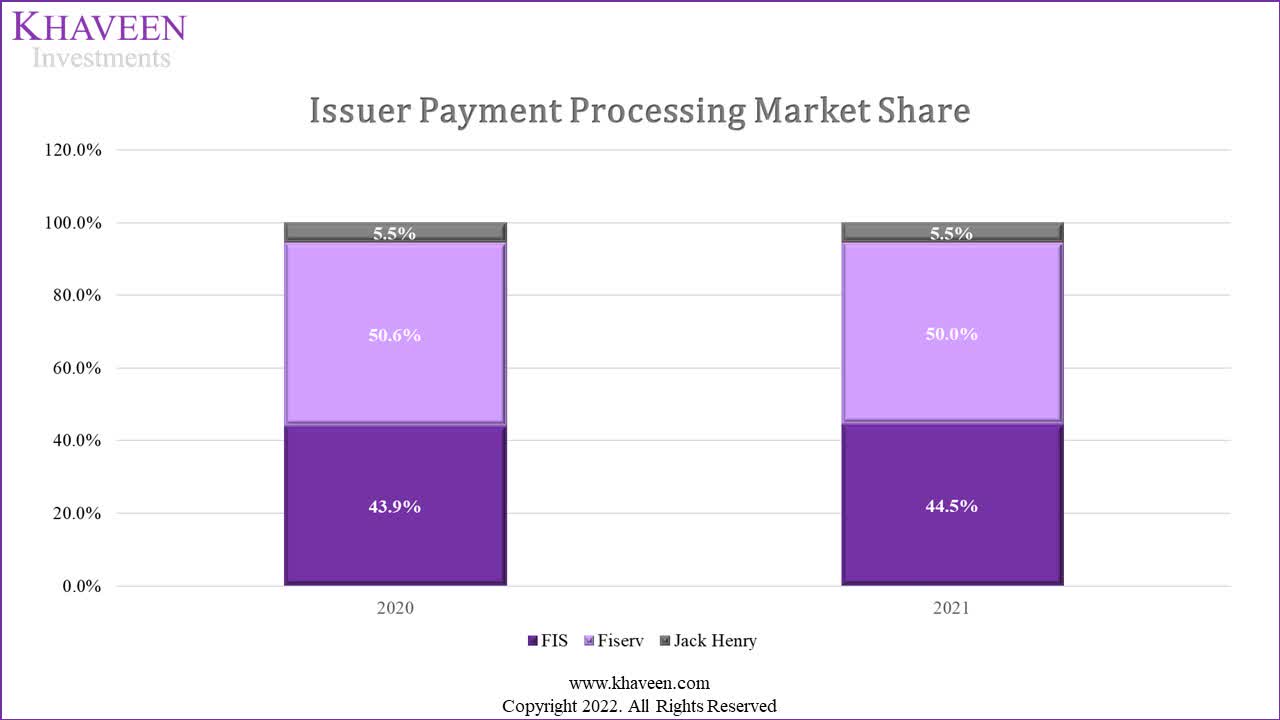
Moreover, the company also competes against FIS and Fiserv in the issuer payment processing market. We derived their market shares among the 3 companies based on the company’s segment revenues in 2020 and 2021. As seen from the chart, Jack Henry has maintained its market share of 5.5% in 2021 whereas Fiserv remained the market leader with a 50% market share followed by FIS at 44.5%. One of the factors we believe for the stable market share is similar to core banking as they have similar customer groups which are financial institutions such as banks according to their annual report and with high switching costs similar to its core banking segment.
Growth Support By Ancillary Non-Core Banking Segments
Furthermore, we analyzed the company’s revenue breakdown by segments and its average growth rate. Based on the company’s annual report, it has 3 reportable segments excluding Others which are core banking, payments and complementary segments.
|
Revenue Breakdown by Segment ($ mln) |
2016 |
2017 |
2018 |
2019 |
2020 |
2021 |
2022 |
Average |
|
Core |
449.7 |
503.0 |
555.3 |
536.0 |
582.2 |
564.1 |
622.4 |
|
|
Growth % |
11.86% |
10.40% |
-3.47% |
8.61% |
-3.10% |
10.34% |
5.77% |
|
|
Payments |
459.8 |
481.6 |
517.3 |
549.3 |
597.7 |
642.3 |
707.0 |
|
|
Growth % |
4.75% |
7.42% |
6.18% |
8.80% |
7.46% |
10.07% |
7.45% |
|
|
Complementary |
349.6 |
385.7 |
412.0 |
415.6 |
463.3 |
505.9 |
561.2 |
|
|
Growth % |
10.33% |
6.81% |
0.87% |
11.49% |
9.19% |
10.93% |
8.27% |
|
|
Corporate and others |
95.6 |
60.7 |
52.0 |
51.7 |
53.9 |
45.9 |
52.2 |
|
|
Growth % |
-36.45% |
-14.48% |
-0.43% |
4.12% |
-14.79% |
13.77% |
-8.04% |
|
|
Total |
1,355 |
1,431 |
1,537 |
1,553 |
1,697 |
1,758 |
1,943 |
|
|
Growth % |
5.65% |
7.37% |
1.05% |
9.30% |
3.60% |
10.50% |
6.24% |
Source: Company Data, Khaveen Investments.
Based on the table, the company’s largest segment is Payments, which accounted for 37% of revenue and overtook its Core banking segment with a higher average growth rate of 7.45% compared to 5.77%. This is followed by its complementary segment, which has the highest growth rate of 8.27% but is its smallest segment.
|
Revenue Forecast ($ mln) |
2022 |
2023F |
2024F |
2025F |
2026F |
2027F |
|
Core |
622.4 |
656.05 |
691.48 |
728.82 |
768.18 |
809.66 |
|
Growth % |
10.34% |
5.40% |
5.40% |
5.40% |
5.40% |
5.40% |
|
Payments |
707.0 |
748.73 |
792.91 |
839.69 |
889.23 |
941.70 |
|
Growth % |
10.07% |
5.90% |
5.90% |
5.90% |
5.90% |
5.90% |
|
Complementary |
561.2 |
607.62 |
657.87 |
712.28 |
771.18 |
834.96 |
|
Growth % |
10.93% |
8.27% |
8.27% |
8.27% |
8.27% |
8.27% |
|
Corporate and others |
52.2 |
52.2 |
52.2 |
52.2 |
52.2 |
52.2 |
|
Growth % |
13.77% |
0.00% |
0.00% |
0.00% |
0.00% |
0.00% |
|
Total |
1,943 |
2,065 |
2,194 |
2,333 |
2,481 |
2,639 |
|
Growth % |
10.50% |
6.27% |
6.29% |
6.31% |
6.34% |
6.36% |
Source: Company Data, Khaveen Investments.
We forecasted the company’s growth based on its segment breakdown. For its Core banking segment, we based its growth on the core banking market forecast CAGR of 5.4%. Moreover, we based its Payment segment on the payment processing market CAGR of 5.9%. For its Complementary segment, we based it on the historical 5-year average growth of 8.27%. In total, we see its growth at a forward average of 6.3%.
Risk: Larger Competitors
We believe one of the risks of the company is its competition with larger companies including Fiserv and FIS Global. These companies both have a larger customer base than Jack Henry as seen in the table below.
|
Company |
Customers |
|
Fiserv |
16,000 |
|
Jack Henry |
8,500 |
|
FIS Global |
20,000 |
Source: Company Data, Khaveen Investments.
Verdict
Based on the table above, Jack Henry & Associates has stable revenue growth with a 10-year average of 5.76% and a 5-year average of 6.98%. Furthermore, the company also has stable profitability as seen by its gross, EBIT, net and FCF margins. Based on the table, the company’s average 10-year gross, EBIT, net and FCF margins were 41.58%, 23.77%, 17.9% and 16.32% respectively. We forecasted its growth at a stable forward average of 6.3%. However, based on the analyst consensus price target of $186.27 for Jack Henry & Associates, Inc., this does not leave much potential for returns.
Be the first to comment