

JHVEPhoto
J. M. Smucker Company (NYSE:SJM) owns iconic, timeless brands. But the company is overvalued. The dividend yield has dropped due to the expansion in the valuation multiple. Investors who own the stock can continue holding and consider selling covered calls to generate extra income. Investors looking to add to existing holdings should wait for the price to drop below $130. The stock’s dividend yield will exceed 3% at those price levels.
Price increases bolster revenue
Companies across various industries, including consumer staples, have implemented price increases to counter the effects of inflation. In some cases, the management has implemented double-digit increases. But, many were pleasantly surprised by the inelastic demand for their products (Exhibit 1). For example, Mark Smucker [CEO] said the following about price elasticity during the Q2 FY 2023 Earnings call:
Elasticities remained modest across our portfolio, most notably for pet food and snacks, Uncrustables sandwiches, and fruit spreads.
Exhibit 1:
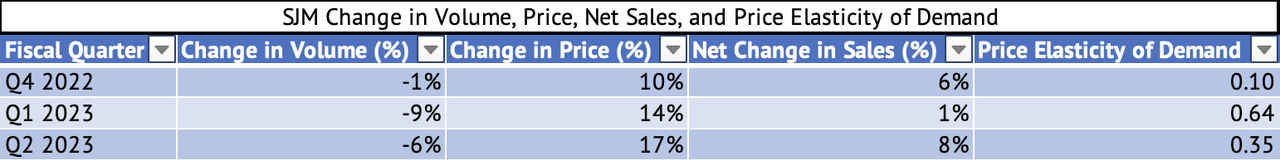
J. M. Smucker Quarter Y/Y Change in Volume, Price, Net Sales, and Price Elasticity of Demand (J. M. Smucker Investor Reports, Author Calculations)
Many consumer staples companies have seen inelastic demand similar to J. M. Smucker’s in the past year as they increased prices. With inflation declining in the U.S., these double-digit price increases may not be necessary. But, if companies continue to increase prices, volume declines could accelerate with consumers switching to private label brands or reducing consumption to compensate for the increased portion of their household budget going towards food.
One reason for the lower price elasticities is that inflationary pressures affect everybody equally. The competition had to increase prices, which has narrowed the price gap between J. M. Smucker’s and others.
A decline in profit margins
The price increases haven’t helped the company recover most of its margins. The average gross margin between 2013 and 2021 was 37.31% (Exhibit 2). The company’s gross margin for 2022 was 34.02%, lower by 329 basis points. The standard deviation in the margins between 2013 and 2021 was 173 basis points. The 329-basis point hit to the gross margins is much greater (higher than one standard deviation) than its typical volatility in margins of around 173 basis points.
Exhibit 2:
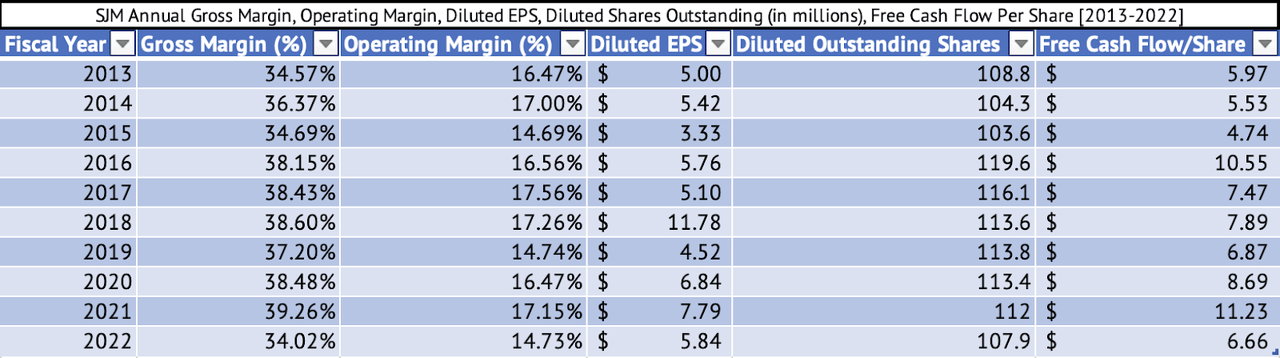
J. M. Smucker Annual Gross, Operating Margins, Diluted EPS, Outstanding Shares, and Free Cash Flow per Share (Seeking Alpha, Author Compilation)
The company’s quarterly gross margins for the quarter-ending July and October came in at 29.5% and 31.9%, respectively, much lower than its annual average. As a result, the company’s operating margins have dropped to their lowest levels in years (Exhibit 3).
Inflation has moderated in the U.S., and the Producer Price Index [PPI] increased by 4.9% y/y in November 2022 compared to an increase of 5.4% in October 2022. This PPI level is still high, and companies may have to raise prices further. At some point, more consumers will be shocked by their grocery bills’ sticker prices and make double-digit consumption cuts. In short, J. M. Smucker could still see a shock to its revenue growth and further deterioration of margins.
Exhibit 3:
![J.M. Smucker Quarterly Gross and Operating Margins [April 2020 - October 2022]](https://static.seekingalpha.com/uploads/2022/12/17/saupload_GBbb_Dvec4yl12ZJ6cxnEFLVbTuNG8yrxr4ec2KUDmVeILfT5dH-3aa-fCTQ7CWd06E6FuCo1zCgkrkzy68PYKxH8o2b0vfOiWA19c8msDVL46K19WYkBDi5HkzJHfm2so1y5pcDGhk6oRuZZTr5mRQl1fFxaG6QhAJXcNpY5krNDrKWnq8BcZeUGGfnoA.png)
J. M. Smucker Quarterly Gross and Operating Margins [April 2020 – October 2022] (Seeking Alpha, Author Compilation)
Increase in inventory and receivables
The company has seen a substantial increase in inventory and the number of days of sales in inventory. The company’s days sales in inventory for the trailing twelve months [TTM] have jumped to 89 (Exhibit 4), the highest since 2016. The company’s days sales in receivables (Exhibit 5) have also jumped to 27 days, the highest in a decade.
Exhibit 4:
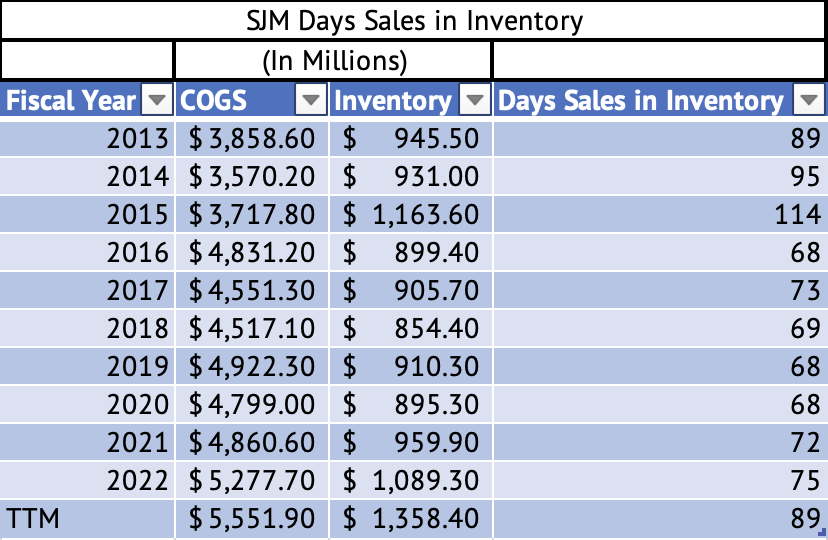
J. M. Smucker Days Sales in Inventory (Seeking Alpha, Author Calculations)
Exhibit 5:
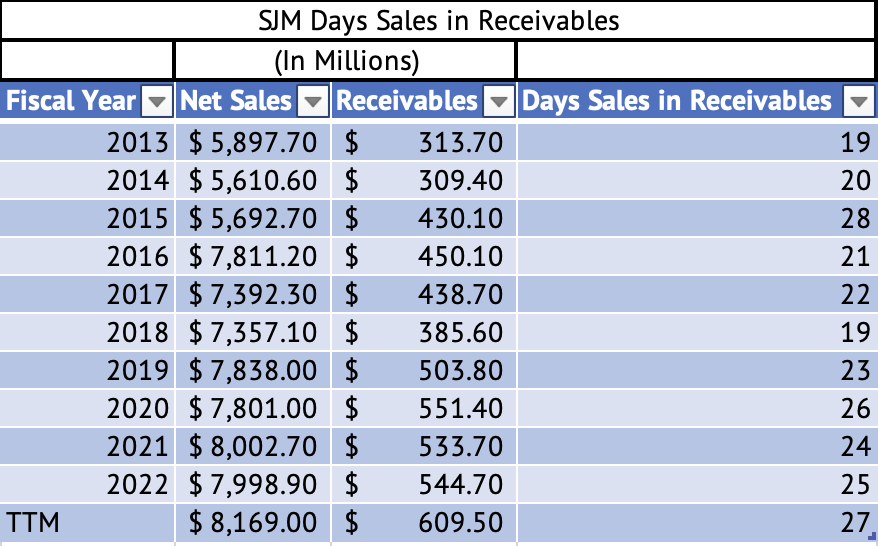
J. M. Smucker Days Sales in Receivables (Seeking Alpha, Author Calculations)
J. M. Smucker monthly price return analysis
Investors look for stocks uncorrelated with the market to bolster their portfolio during market turmoil. Consumer staples stocks tend to do well during times of high risk and volatility, such as in 2022. J. M. Smucker is one such consumer staples stock that has benefitted from this bear market. Between Jun 2019 and Nov 2022, the stock had a low correlation of 0.19 with the Vanguard S&P 500 Index ETF (VOO). This relationship explains why J. M. Smucker has returned 14% while the Vanguard S&P 500 Index ETF has returned a negative 13.8%.
The correlation between an index and a stock can vary depending on various reasons. For example, between July 2020 and June 2021, the correlation between J. M. Smucker and the Vanguard S&P 500 Index ETF was a positive 0.60 (Exhibit 6). This was the Fed-induced rally period to counter the pandemic’s effect. All sectors of the U.S. economy rallied in unison, so the correlation in monthly returns was high. During this positive correlation period, the stock returned 21.9%.
Exhibit 6:
![Highest Positive Correlation of Monthly Returns Between VOO & SJM [Jul 2020 - Jun 2021]](https://static.seekingalpha.com/uploads/2022/12/17/28462683-16712920331802773_origin.png)
Highest Positive Correlation of Monthly Returns Between VOO & SJM [Jul 2020 – Jun 2021] (Data Provided by IEX Cloud, Author Calculations Using Microsoft Excel, RStudio)
Between June 2019 and May 2020, the correlation was a negative 0.29 (Exhibit 7). This was when the technology sector [VGT] was garnering more investment dollars and rallied by 39% until Feb 2020, when the news of the spread of COVID-19 in the U.S. plunged the markets into the shortest bear market in U.S. history. The top-5 companies made up 18% of the index in 2020 when Apple, Microsoft, Google, Amazon, and Facebook, added trillions in market cap and made the Vanguard S&P 500 Index ETF tilt in favor of these companies while shunning greater dividend-paying sectors such as consumer staples. During this period, J. M. Smucker returned a negative 5.5%.
Exhibit 7:
![Highest Negative Correlation of Monthly Returns Between VOO & SJM [Jun 2019 - May 2020]](https://static.seekingalpha.com/uploads/2022/12/17/28462683-16712921763732677_origin.png)
Highest Negative Correlation of Monthly Returns Between VOO & SJM [Jun 2019 – May 2020] (Data Provided by IEX Cloud, Author Calculations Using Microsoft Excel, RStudio)
The best period to invest in the consumer staples sector is when investors are looking to take risks and pour money into high-beta stocks, mainly in the technology sector. That money has flowed into the consumer staples sector, which typically has a low beta. Today, investors are risk-averse and have fled technology stocks.
High debt and a low dividend yield
The company’s debt-to-EBITDA ratio is high at 3.3x (Exhibit 8). The company’s quick ratio is low, and its current ratio barely exceeds 1x. As of October 2022, the company had short-term debt of $302 million and long-term debt of $4.3 billion. The company’s operating cash flow was $999.4 million in the trailing twelve months.
Exhibit 8:
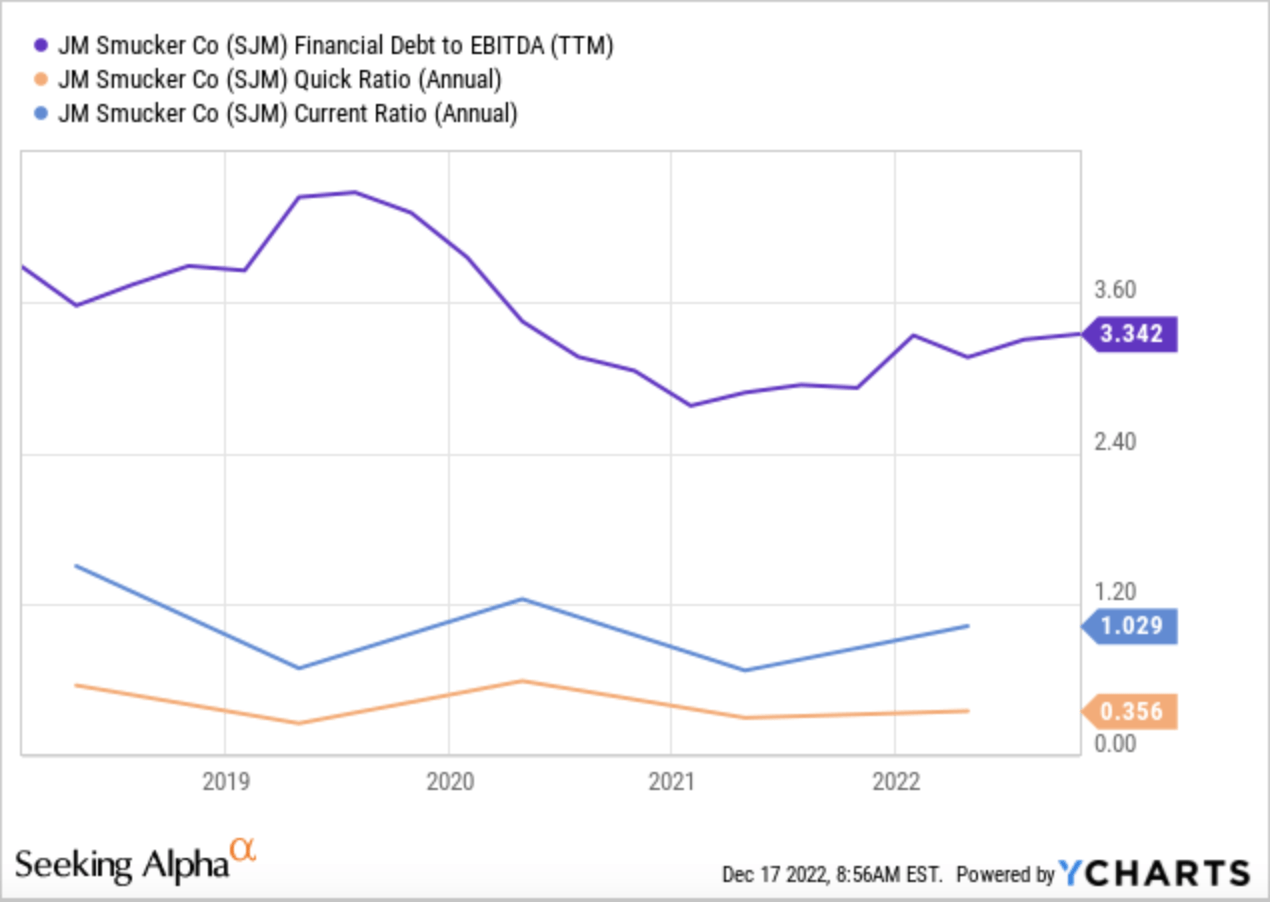
J. M. Smucker Debt to EBITDA, Quick, and Current Ratio (Seeking Alpha, YCharts)
The company pays about $418 million in dividends yearly (Exhibit 9) with a sustainable payout ratio of 46%. The company has enough operating cash to cover its dividends. The dividend yield is low at 2.6%, given that the U.S. 2-Year Treasury yields 4.18%. The company has an excellent 5-year average dividend growth rate of 5.6% and grew by 6.3% in the past year.
However, J. M. Smucker has a disappointing track record of share buybacks. It has spent $2.7 billion on buybacks since 2013, but the diluted share count has barely budged.
Exhibit 9:
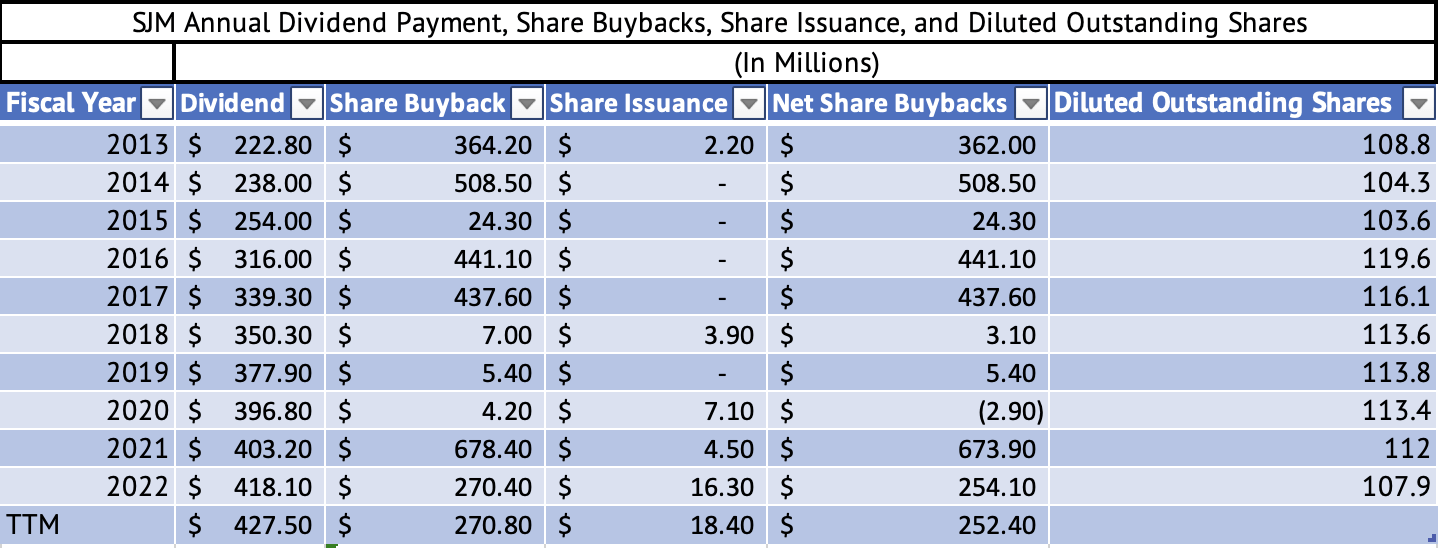
SJM Annual Dividend Payment, Share Buybacks, Share Issuance, and Diluted Outstanding Shares (Seeking Alpha, Author Compilation)
Covered calls yield a good income
The company is overvalued at current prices, trading at a trailing GAAP PE of 29x compared to its five-year average of 18x. It is trading at a forward GAAP PE of 22x compared to its five-year average of 16x. On almost every measure, the company looks overvalued. Fundamentally, the company is doing slightly worse today than it did pre-pandemic. Investors looking for low-beta stocks to ride through the current market volatility have found refuge in the consumer staples sector. Once these investors are willing to take risks in high-beta stocks in the technology and other sectors, J. M. Smucker’s valuation will revert to its average.
Selling a Jan 20, 2023, $155 covered call could yield a good income on J. M. Smucker. The call last traded at about $4 (Exhibit 10), paying a reasonable 2.5% for the next month. Investors can keep their call premium and shares if the stock drops below $155 before Jan 20. This strategy may be bet on inflation continuing to trend lower, thus brightening the mood for investors. Lower inflation may push investors to move cash from consumer staples to other risky sectors, thus causing a drop in the price of J. M. Smucker.
The shares will be assigned if the stock stays above $155. An investor with good capital gains can use the covered call to take profits while generating extra income. If the stock rises well above $155, the investor will forgo any upside gains beyond that point. At a $4 premium, the investor is getting paid $159 per share even if it is assigned.
Exhibit 10:
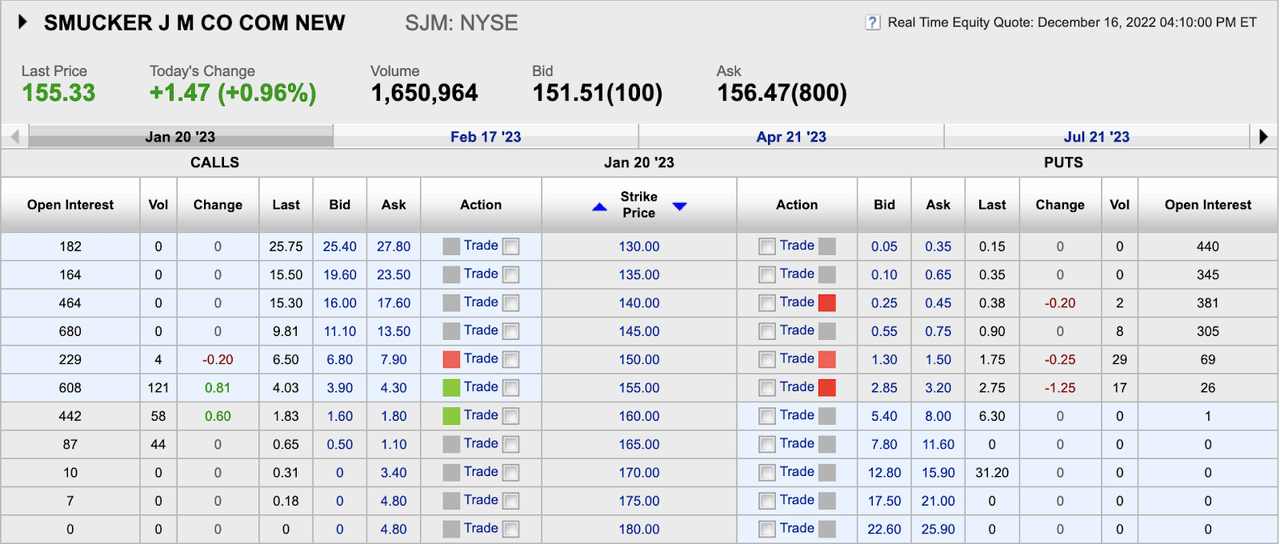
J. M. Smucker Call and Put Option Prices for Jan 20, 2023 Expiry (E*Trade)
Investors should show restraint
The company’s revenue growth has been driven solely by price increases. Inflation has to drop further before sales volumes can stabilize. J. M. Smucker has a safe dividend, but the yield has fallen due to the company’s stock price increase. The company has high debt and lower short-term liquidity. It is highly valued at this time. Investors who own the stock can consider selling covered calls to generate income. Investors can consider buying the stock at $130 or below. It is just a matter of time before J. M. Smucker Company gives investors a buying opportunity.
Be the first to comment