


DavidLeshem
The iShares Russell Mid-Cap Value ETF (NYSEARCA:IWS) is supposed to provide exposure to comparatively cheap mid-size U.S. equities with soft growth characteristics. In the current iteration, IWS is overweight financials (18.7%), industrials (15.6%), and real estate (10.5%). At first glance, this is a minimalist value strategy almost ideal for periods when growth premia are being trimmed across the equity universe.
Incepted in July 2001, it has amassed ~$12.7 billion in net assets; its expense ratio is a modest 23 bps.
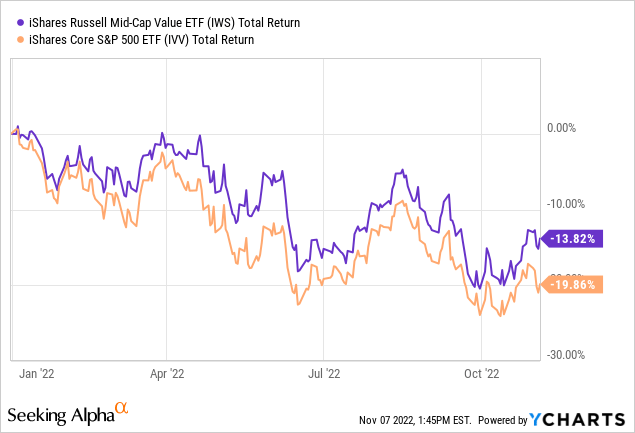
Inflation near a few decade highs and higher interest rates designed to suppress it fast piled pressure on growth names, with the tech-heavy and rich in growth bellwethers funds like the iShares Core S&P 500 ETF (IVV) suffering close to 20% decline YTD, let alone frothier corners of the market that were previously shining thanks to what I would call the pandemic cash (ultra-loose monetary policy plus the pandemic-induced temporary shifts in consumption patterns and supply chain imbalances). And though 2022 has also been rather slack for value stocks also, their inherently lower growth prospects and subsequently modest multiples allowed them to chug along amid this storm. IWS has been no exception as it declined by ~13.8% while IVV is down ~19.9%.
However, even though IWS might look like a solid bet for a period of prolonged hawkishness with a recession risk in the mix, I am skeptical about investing in this vehicle for mid-size and value factors exposure. More on the rationale behind this skepticism is below in the note.
The investment strategy and its nuances
The concept of value investing (or the value factor) is susceptible to various interpretations. The approach used in the case of the Russell Midcap Value Index which lies at the crux of IWS’ investment strategy is a fairly straightforward one, which I at times call minimalist. With the Russell Midcap Index as a selection universe, FTSE Russell uses the P/B ratio, an I/B/E/S forecast medium-term growth rate (a 2-year timeframe), and Sales per Share historical growth rate (a 5-year period) to find those names that have comparatively cheap valuations and softer growth. At first glance, this is a solid approach ensuring adequate selection of seemingly underpriced stocks while securing low turnover. However, nuances are aplenty.
First and foremost, under the hood, IWS is not a mid-cap ETF. In its portfolio, there are 697 equity holdings, yet just 27% (395 stocks) can qualify for the mid-cap status (a sub-$10 billion market cap). We saw something similar in the case of the Vanguard Mid-Cap Growth ETF (VOT) which I discussed in January 2022. And even though the median market cap is ~$8.6 billion, which is consistent with the preference for mid-caps, still, owing to weighting intricacies and overall design of the selection process, the weighted-average figure is ~$19.5 billion as per my calculations. The chart below mixing a stock’s weight with its market cap illustrates this issue perfectly.
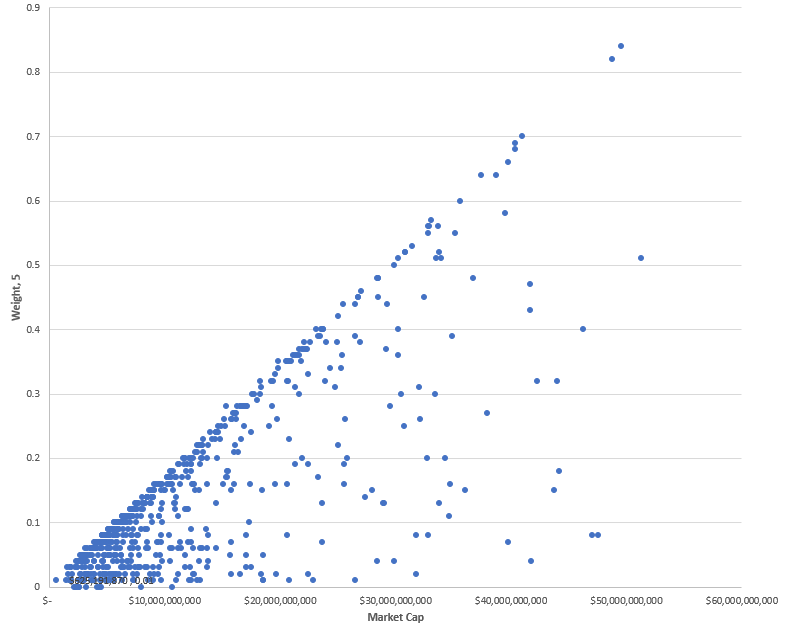
Created by the author using data from Seeking Alpha and the fund
More specifically, the fund’s key holding with an 0.84% weight is Phillips 66 (PSX), an energy manufacturing and logistics company sporting a market capitalization of ~$49.6 billion, almost 5x above the conventional mid-cap threshold.
Nevertheless, this is certainly not an issue with all value ETFs that seemingly target the mid-cap league. The example I would like to provide here is the Invesco S&P MidCap 400 Pure Value ETF (RFV), a financials-heavy fund with just 101 holdings and a weighted average market cap of just ~$5.6 billion. A full spectrum of market values presented can be seen in the chart below. As can be seen, most names are concentrated in the sub-$10 billion areas.
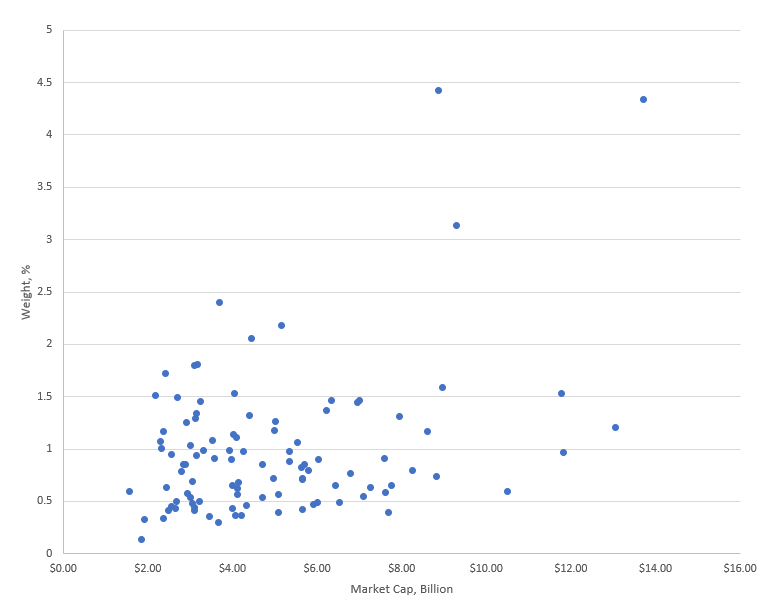
Created by the author using data from Seeking Alpha and the fund
The next question is whether the size factor has resulted in somewhat skewed value characteristics of IWS atypical for smaller companies. And the issue is that it partly did. Delving deeper, I found out that over 51% of the IWS portfolio is overvalued; at least, they have a D+ Quant Valuation grade or worse, which means their composites of a few relevant multiples are far higher compared to the respective sector medians and their historical averages even amid the bear market. Since ~42% out of this ~51% sport market values higher than $10 billion, I believe the hypothesis that premium valuation has something to do with the size factor has merit. The Quant data for the key 20 holdings of IWS is summarized below; the only stock which is comparatively underappreciated in this list is Nucor Corporation (NUE), a $34.3 billion steel company.

Created by the author using data from Seeking Alpha and the fund
Next, the quality characteristics are also in line with the expectations typical for large caps. For example, the fund has over 77% of its net assets invested in stocks with superior quality (at least B- Quant Profitability grade). At the same time, the figure is marginally below 55% for RFV. Yet this fund has an edge when it comes to the value factor, with over 52% allocated to stocks rated B- or better. The top 20 names in its basket are provided below:

Created by the author using data from Seeking Alpha and the fund
What returns was IWS capable of delivering in the past?
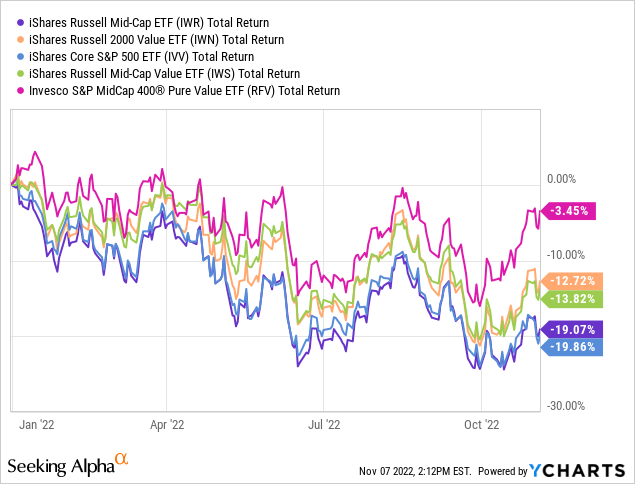
The value drought of the 2010s is something that most of my dear readers have likely not forgotten. Long before the pandemic tech rally, low-multiples stocks were struggling, with a few active value funds closing doors amid plummeting investor interest due to painful underperformance. So in the last ten years, IWS has underperformed both IVV and the iShares Russell Mid-Cap ETF (IWR), also finishing behind RFV, yet still with a marginally better CAGR than the iShares Russell 2000 Value ETF (IWN) achieved. It is also not to be overlooked that though RFV provides a better version of a cheaper mid-caps portfolio as discussed above, its more concentrated portfolio invites higher volatility, which is illustrated by a standard deviation being the highest in the group.

Created by the author using data from Portfolio Visualizer
It would also be pertinent to remark that RFV’s CAGR is likely better since its cheaper valuation secured just a ~3.5% decline YTD, while other ETFs in the cohort are down in double-digits, IWS included.
Final thoughts
I like the idea of a mid-cap value fund, which should rely on a mix of comparatively adequate quality (at least, not as fickle and vulnerable as in the case of small-caps) and cheapness inherent to the medium-size companies, yet the methodology of IWS tilts it towards larger players, with value characteristics not always attractive enough. So for investors seeking maximalist concentrated portfolios overweight small-size companies, taking a closer look at RFV certainly makes sense.
Another vulnerability of IWS is that it relies on the concept of book value (the P/B ratio), which is deemed outdated, thus potentially leading to inadequate stock selection decisions. That said, I still like the simplicity of the strategy which secured a modest turnover, something that investors who are into more homogenous portfolios would appreciate. An attractive cost structure is also a positive.
In sum, I would call IWS an ex-mega-cap large-size equity portfolio with some exposure to lower echelons of the market. And this is likely not what value investors seeking passive exposure to smaller companies would like to see. That being said, I am of the opinion IWS is a pass for this bear market.
Be the first to comment