

Onfokus
Intro
We wrote about iShares Russell 2000 ETF (NYSEARCA:IWM) back in March of this year when we recommended that investors and traders alike do not try to pick a direction in this fund. We stated this because the ETF was trading in a defined trading range which still as we see below is very much intact. In fact, shares of IWM have only moved approximately 9% or $17 a share over the past six months since we penned that piece. Suffice it to say, given the limited movement in IWM over the past six months, the strangle (which we recommended in that March commentary) would have definitely worked out for whoever would have adopted it.
IWM Trading Range (Stockcharts.com)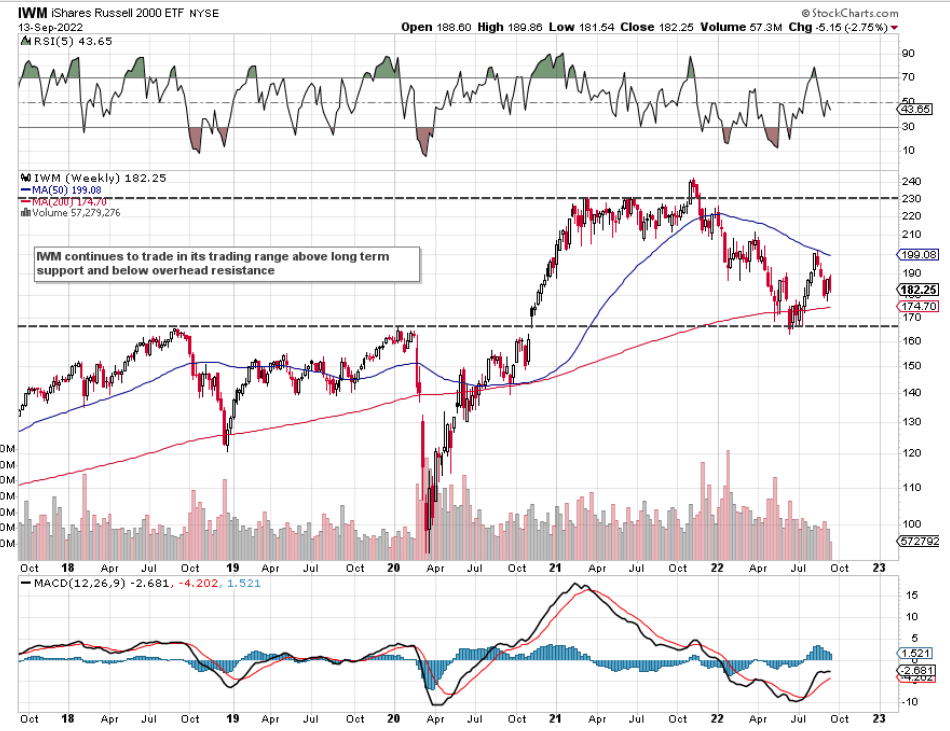
IWM Volatility
Now, if we look at a chart of IWM’s implied volatility below, we can see that the fund’s IV is trading well above its average IV over the past 12 months. Furthermore, IWM’s implied volatility is also trading above the fund’s historical volatility which is also desirable. When implied volatility is trading above its average, it means the fund’s associated options are more expensive than normal. This means we want to be sellers in this scenario to ensure we collect as much option premium as possible.
Whereas implied volatility (28.3%) is forward-looking, historical volatility (21.2%) on the other hand is a percentage that has been calculated from how much IWM has moved over the past 12 months. Suffice it to say, when selling options, we look for setups where the implied volatility is higher than normal and also well above historical volatility. This stacks the odds in our favor that the contraction in volatility over time will indeed make us money.
IWM Implied Volatility V Historical Volatility (Interactive Brokers)
Keeping Risk In Check
Although the strangle discussed in the March article (sale of simultaneous out-of-the-money put and out-of-the-money call options) is an undefined risk strategy, the strangle remains a very high probability of profit setup (Many times 70%+ POP). However, the strangle is rarely part of the trader’s arsenal where the prime objective is to keep risk in check.
Therefore, taking the risk-averse trader into account, what strategy can be utilized to achieve the following criteria?
- Risk is firmly kept in check
- A high potential gain can be realized in the position
- The strategy has a very high probability of profit
Enter the broken wing butterfly. This strategy fulfills all of the above three requirements and since it is a defined risk trade, it uses far fewer amounts of buying power compared to its undefined counterparts. Therefore, given that there is plenty of put skew in IWM, we are going to sell a broken wing butterfly where we want our breakeven near that pivotal $165 support level. The reason being is that if indeed price was to drop sharply down to that level by expiration (October), we would be looking for underside support to at the very least slow down the descent. This helps us as short-term option sellers from at least a theta perspective even if implied volatility was to expand.
Support Should Hold At The $165 Level
Apart from the technicals illustrated above, asset flows (2% growth) in IWM actually have turned positive over the past 30 days which is encouraging. Asset flows are tied very closely with share price movement as we see in the following numbers. Over the past 12 months, IWM is down roughly $40 a share or 18% and AUM is down 20%+ in the same timeframe. However, if we span out the timeframe to three years, we see that AUM is up roughly 19% and shares have correspondingly rallied by over 18%. Suffice it to say, if AUM can maintain a positive trajectory, we see little chance of the $165 level being breached over the next 37 days.
IWM Asset Flows Improving (Seeking Alpha)
Why A Broken Wing Butterfly Over Regular Butterfly?
A normal put butterfly consists of the purchase of a long put spread combined with the sale of a further out of the money put spread. The put strikes are the same for both spreads and the wings (long options) are both equidistant from the short strikes. This usually is routed for a debit which means that price has to move in the direction of the butterfly in order to make money on the position.
This is not the case in our broken wing butterfly because of being able to route the strategy for a credit. What we are eyeing up here is the purchase of the $170/$168 IWM long October put spread combined with the sale of the $168/$165 corresponding October put spread. The broken wing corresponds to the further out of the money put ($165 strike which is not equidistant like in the regular butterfly). Although we are taking on more risk due to that further out long put, the probability of profit in this play now comes in at a very elevated 85% as we see below because even if IWM does not move down in price, we still keep was what originally collected ($0.08 per butterfly). Here is how the numbers play out for 10-lot in this trade. Remember, we want IWM to be sitting at our short strike ($168) by expiration to be able to make max profit in this trade.
IWM Broken Wing Butterfly x 10 (Interactive Brokers)
Conclusion
A broken wing butterfly in IWM makes sense at present due to the fund’s put skew and high implied volatility. Furthermore, strong underside support should mean that a potentially steep decline would be slowed down at the very least. We look forward to continued coverage.
Be the first to comment