

shapecharge/iStock via Getty Images
For the stock market to bottom, we need a clear vision of how the Fed is going to back off on its assault on high-beta assets. We have not ramped up quantitative tightening (QT) to its full degree. On June 1, the Fed started its balance sheet shrinkage at $47.5 billion a month for the first three months, consisting of $30 billion a month in Treasuries and $17.5 billion of mortgage-backed securities (MBS). QT will then increase to the full $95 billion three months later. In the last cycle, the top rate of QT was just $50 billion.
The upcoming $95 billion per month in QT is nearly double the $50 billion monthly rate from 2018, but today’s economy is not nearly twice as big. True, there are more excess reserves in the system now, so the much more aggressive rate of QT may not bite right away, but QT has never reached this scale, so higher levels of volatility in stocks and bonds and further expansions in credit spreads are to be expected.
EU Natural Gas; Brent Crude (Trading Economics)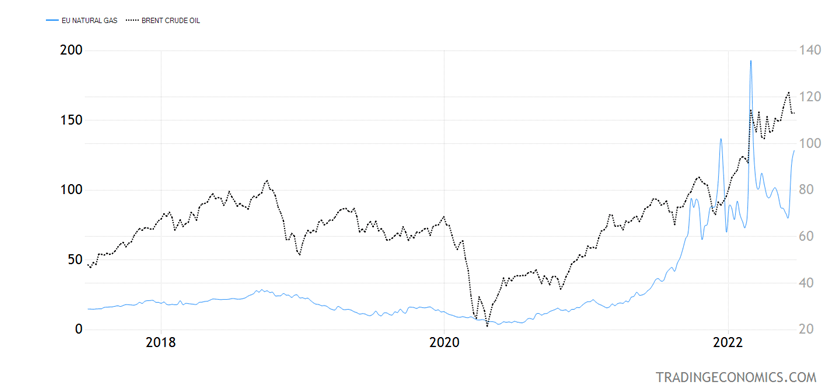
Graphs are for illustrative and discussion purposes only. Please read important disclosures at the end of this commentary.
In early June, natural gas for EU delivery trade in the Netherlands shot up 50%-plus in a single week as Gazprom (OTCPK:OGZPY) had a malfunction in its equipment and volumes declined to 40% of normal overnight. Those volumes are normalizing, but the price of EU natural gas is not. I doubt this was a pure malfunction, as it coincided with some high-profile EU leaders visiting Kyiv. The price of EU natural gas can go quite a bit higher, and so can the price of oil, so I am not really trusting the recent pullback in crude oil.
US Government Bond 10Y; US Fed Funds Rate (Trading Economics)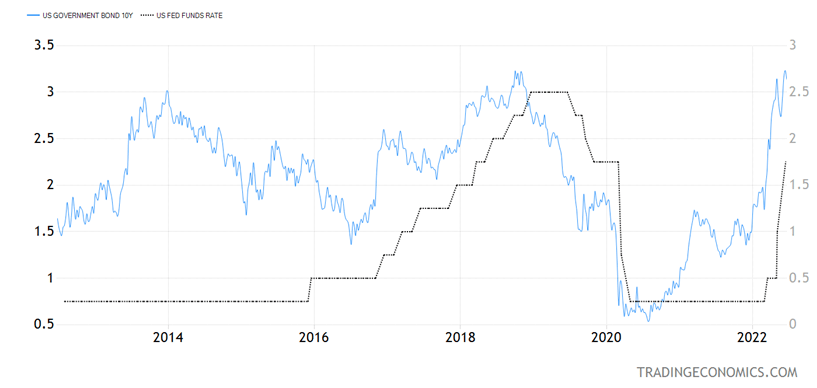
Graphs are for illustrative and discussion purposes only. Please read important disclosures at the end of this commentary.
Also, it would be very helpful if 3.50% was “it” for the 10-year Treasury yield. We had a very messy and quick sell-off in bonds from 2.75% to 3.50%. After a huge rebound in bond prices down to 3%, we closed Friday at 3.14%. Before the rise above 3.25% (the high for the prior Fed rate hiking cycle in 2018), yields had not risen above the high from the prior Fed rate hiking cycle for 40 years – but they did this time.
Fingers crossed that this was a false breakout in Treasury yields, but the only way the trading gods will cooperate is if we don’t see sustained trading above 3.5%. If we do, any talk of a false breakout is moot.
Russian Ruble; EURUSD (Trading Economics)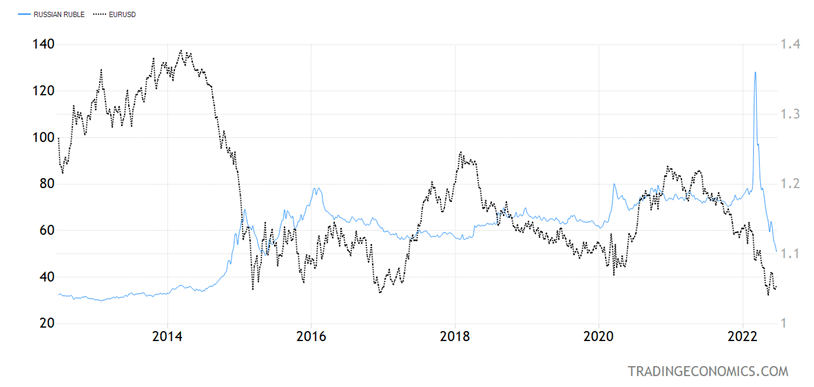
Graphs are for illustrative and discussion purposes only. Please read important disclosures at the end of this commentary.
Finally, for the stock market to bottom, we need to see an end to the fighting in Ukraine, which as things stand is ongoing with no end in sight. The Russian ruble closed Friday at 50.90 to the dollar. Right after the war broke out, it was trading in the 130s. I don’t know of one person that forecast this huge recovery in the ruble, which has dramatically appreciated in the last three months. Even though Russia’s economy has been hit, clearly the contingency plan is working, and the ruble is being supported by the much higher value of petrodollars pouring into Russia compared to last year, courtesy of higher energy prices.
While we can have a 5-10% rebound at any time, a firm bottom in the stock market is contingent on a series of resolutions to the several uncertainties I’ve described above.
Gold is Likely to Move Soon
Gold is not yet responding to the high inflation numbers because U.S. interest rates are rising and the dollar is generally strong. The minute inflation peaks and interest rates begin to move down, which may be a 2023 phenomenon, the gold market will likely begin to move up. Gold may move much sooner if 3.50% turns out to be the high for this cycle in the 10-year Treasury – which is only a hope at present.
Gold; US Fed Funds Rate (Trading Economics)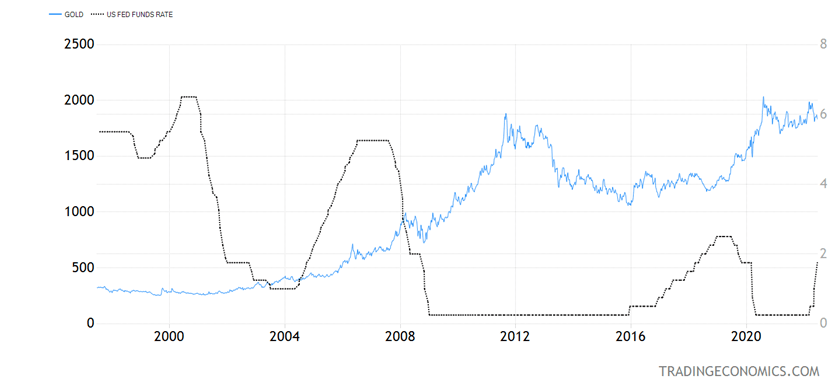
Graphs are for illustrative and discussion purposes only. Please read important disclosures at the end of this commentary.
I don’t think the Fed can do all they say they will do without breaking something, and they will probably have to reverse course before the end of 2022, even though there is no indication of any course reversal right now, but more leverage in the financial system should require fewer rate hikes to do the job.
All content above represents the opinion of Ivan Martchev of Navellier & Associates, Inc.
Disclosure: *Navellier may hold securities in one or more investment strategies offered to its clients.
Disclaimer: Please click here for important disclosures located in the “About” section of the Navellier & Associates profile that accompany this article.
Editor’s Note: The summary bullets for this article were chosen by Seeking Alpha editors.
Be the first to comment