

Andrii Dodonov/iStock via Getty Images
It’s tempting to assume that you can find a silver bullet for predicting returns. But along with unicorns and free money, reliable (or at least high confidence) one-factor models for estimating ex-ante performance are the stuff that dreams are made of.
The reason, of course, is that the world (and by extension markets) are complicated. That doesn’t mean you should abandon single-factor models, which (sometimes) are reasonable first approximations. Almost certainly, however, you’ll need to go deeper, but every thousand-mile journey starts with a first step.
Consider the US stock market via the S&P 500 Index. As a general rule, it’s reasonable to hypothesize that current and future returns are inversely related so that higher (lower) ex-post performance implies lower (higher) ex-ante performance. As a simple modeling exercise, that’s a solid foundation, but it needs work (i.e., additional factors) to reduce noise and create an investment strategy that’s worthy of the name.
As one example, the chart below compares current 1-year S&P 500 returns with the one-year ahead return. The relationship is weak, although at the extremes (particularly for high current returns) the connection is stronger, i.e., future results are likely to be negative.
Author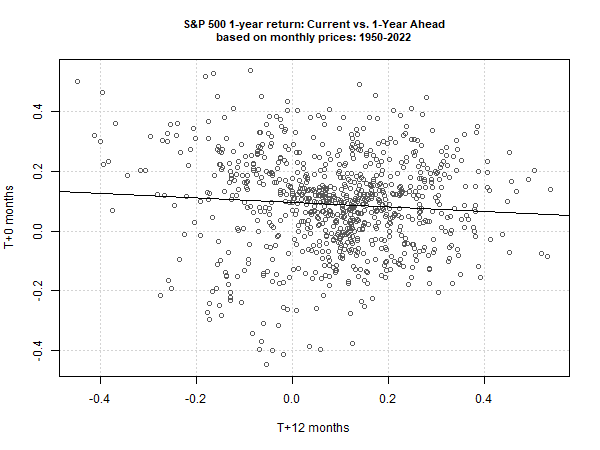
Nonetheless, there’s a lot of noise, which is why the regression line for this relationship has only a slight downside bias from left to right.
The message here is that if you’re focused on predicting one-year returns for the S&P 500, you’ll need additional factors beyond the trailing one-year performance. There are limits, however. More factors, at some point, don’t equate with greater forecast reliability. (And, yes, I’m assuming that the factor list is relevant for the task at hand.)
But the time horizon is relevant, too. Namely, longer time horizons (up to a point) tend to reduce noise, at least for some markets. For comparison, the next chart shows the relationship for trailing 10-year annualized S&P 500 returns with the 10-year ahead result. The relationship is conspicuously stronger vs. the 1-year horizon shown above. As a result, history suggests you’re more likely to earn higher (lower) returns over the decade ahead if the past 10-year performance is lower (higher).
Author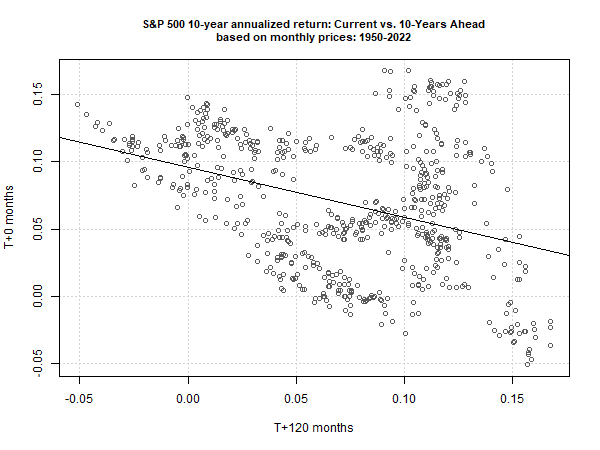
There’s still a non-trivial amount of noise, however, and so additional factors are still needed to enhance the reliability of the model. Interest rates and inflation, for instance, can help.
This simple test highlights a lesson, however. The shorter your forecasting horizon, the more factors you’ll need to generate robust estimates (assuming you identify relevant factors). By contrast, the further out in time you forecast, the lower the need for more factors. The art/science of estimating expected returns is finding the sweet spot for choosing time horizons and factors.
Editor’s Note: The summary bullets for this article were chosen by Seeking Alpha editors.
Be the first to comment