

wsmahar
There is some debate right now as to what stage of the market cycle we are in. There are signs that we are near the late innings of the general downturn in stocks and could be near a recovery. Why’s that? Bonds could have made their low last month around the June FOMC meeting. That’s when Treasury yields spiked to near 3.5% across much of the curve. A big bond rally ensued, taking rates from the 2yr to the 10yr to under about 2.8%.
This morning, the week begins with modest bids in Treasuries with yields off just a touch despite some shaky weekend headlines.
U.S. Treasury Rates Today
WSJ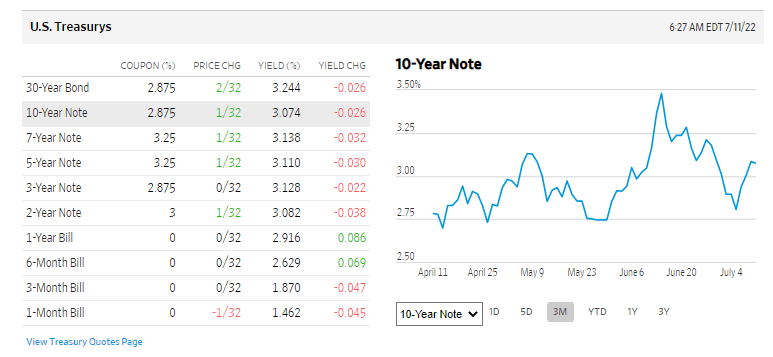
Technicians like to look at how three groups move: stocks, bonds, and commodities. Those who have gone through the Chartered Market Technician (‘CMT’) program might remember the sequence of that trio as “BSC.” Bonds move first, then stocks, then commodities – at least that is the rule of thumb when it comes to intermarket asset class trends.
For example, a market top is seen when stocks and bonds turn lower while commodities march higher (this was the case late last year). That was stage 5. Recently, bonds caught a bid, though, as commodities tanked. Then, as mentioned earlier, bonds began to move up (yields lower) while commodities continued to pull back. That inflection often coincides with an economic contraction (recession). So, does that mean we are around stage 2? Should you load up on stocks? Tough call, but let’s focus on fixed income for now.
The Business Cycle & Intermarket Relationships
Stockcharts.com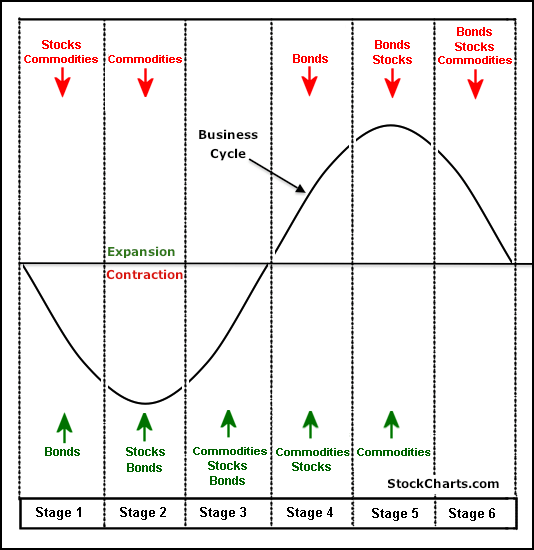
In my eye, the best gauge of the U.S. government bond market is the iShares U.S. Treasury Bond ETF (BATS:GOVT). The fund tracks an index composed of U.S. Treasury bonds, according to iShares. Including dividends, it’s down more than 9% this year as rates have risen big. GOVT’s duration, a measure of sensitivity to changes in yields, is 6.3 years while its current average yield to maturity is 3.2%. At just 0.05 percentage points, it is a cheap way to own default-risk-free Treasuries.
GOVT: The Broad Treasury Market Yields > 3%
iShares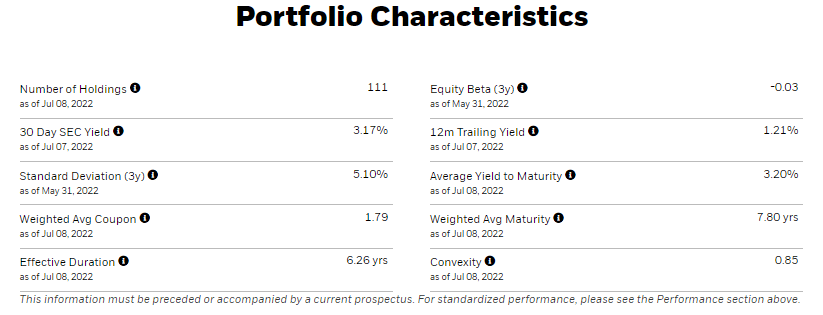
There is huge volatility across the Treasury yield curve right now. The ICE BofAML MOVE Index (‘MOVE’) measures rate volatility from the 2yr note to the 30yr bond using option prices. At 145%, rate volatility is the highest since 2009. So, expect relatively large swings in GOVT compared to generally quiet trading ranges in years past.
ICE BofA MOVE Index: Treasury Market Volatility Is the Highest Since 2009
Investing.com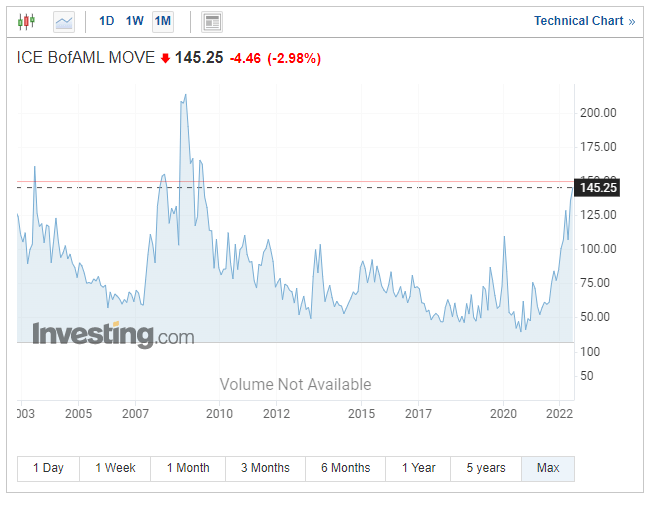
The Technical Take
GOVT has some work to do. Since the ETF’s inception in early 2012, the $24 area has been important. It was the taper-tantrum low in Q3 2013 and found support there as well during the rate-hike cycle of late 2018. Today, it has fallen below the key spot but has rallied back to it. Could a bullish false breakdown be on the way? Watch $24 in the coming weeks. We will get important CPI data later this week and a pivotal Fed meeting on July 27 that could spark the next trend.
Above that level, $26 is a critical line in the sand – that was a neckline to a bearish head and shoulders topping pattern that spanned late 2019 through early 2022.
GOVT: $24 A Pivotal Spot, Further Resistance At $26
Stockcharts.com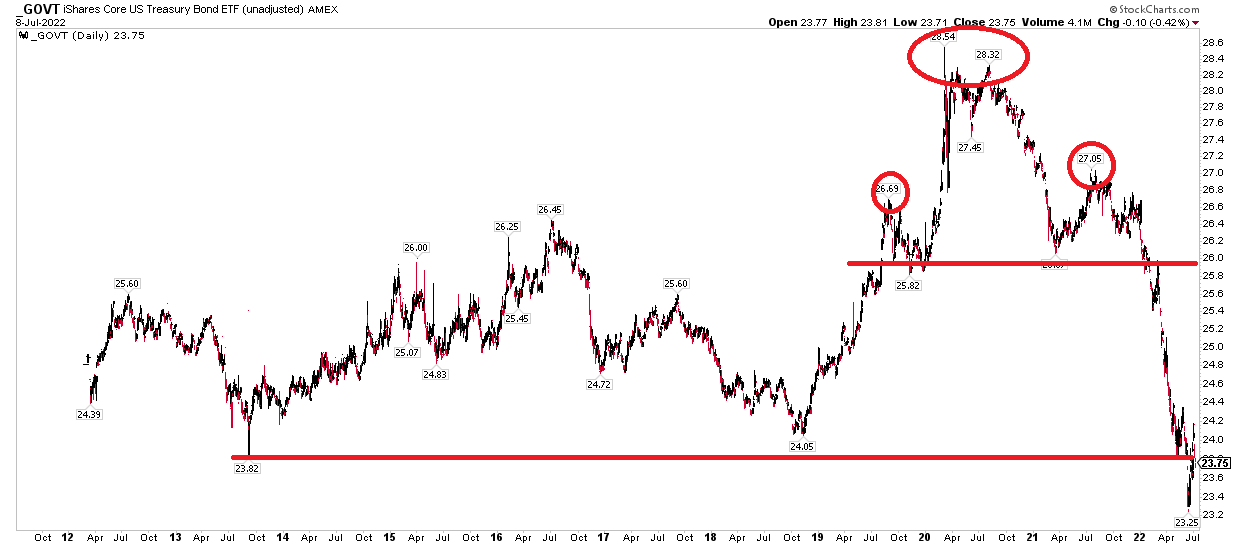
The Bottom Line
GOVT tracks the entire Treasury curve. Analysts are eyeing a possible bullish reversal that might warrant a sign of a market cycle stage shift to a more bullish equity regime. Time will tell but watch how GOVT trades around the crucial $24 price level.
Be the first to comment