

Hand draws a descending graph – concept image Francesco Scatena/iStock via Getty Images
Introduction
Investing in growth stocks has been the stock market’s de facto investment advice and strategy, especially over the last decade. But what happens when growth stocks are faced with their biggest weakness: a market environment that rewards rapid-value yield? The answer to that question encapsulates my analysis of an exchange-traded fund (“ETF”) that is completely invested in growth stocks; and no; it is not ARK Innovation ETF (ARKK) or any of its variants.
IWY Ticks the Bearish Box
The iShares Russell Top 200 Growth ETF (NYSEARCA:IWY) tracks the movement of the top 200 growth stocks in the US equity market. Here is its composition:
IWY ETF Constituents
IWY ETF Asset Exposure (IWY ETF Website, Author’s Analysis)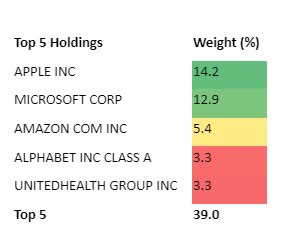
The top 5 names in the IVW ETF are familiar tech and industry giants: Apple (AAPL), Microsoft Corp. (MSFT), Amazon (AMZN), Alphabet Inc. Class A (GOOGL), and UnitedHealth Group (UNH). Clearly, IWY shows notable exposure to blue-chip tech stocks.
Relative Comparison Between IWY and IVW
Because of the similarities in their holdings, the majority of my analysis here will serve as a sort of comparative analysis between the IWY and iShares S&P 500 Growth ETF (IVW) ETFs.
Unlike the IVW ETF, the IWY’s focus, as its name suggests, is on the top 200 large-cap growth stocks in the US equity market. The IVW, on the other hand, tracks the results of large-cap growth stocks in the S&P500 (SP500).
IWY vs IVY Composition Comparison (ETF Website, Author’s Analysis)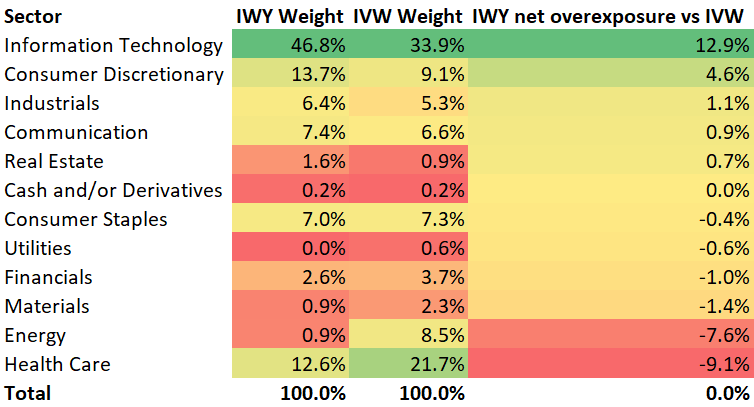
As seen in the table above, the IWY ETF has 12.9% more exposure to the technology sector than the IVW ETF. If tech stocks continue to underperform as some market analysts expect, this would imply a continued steeper descent in IWY vs IVW.
The IWY ETF underperforming the IVW is interesting to see considering the former has also outperformed the latter due to its more nimble state over much of the last decade. Looks like gravity applies to ETF pairs, too:
IVY vs. IVW Technical Analysis (TradingView, Author’s Analysis)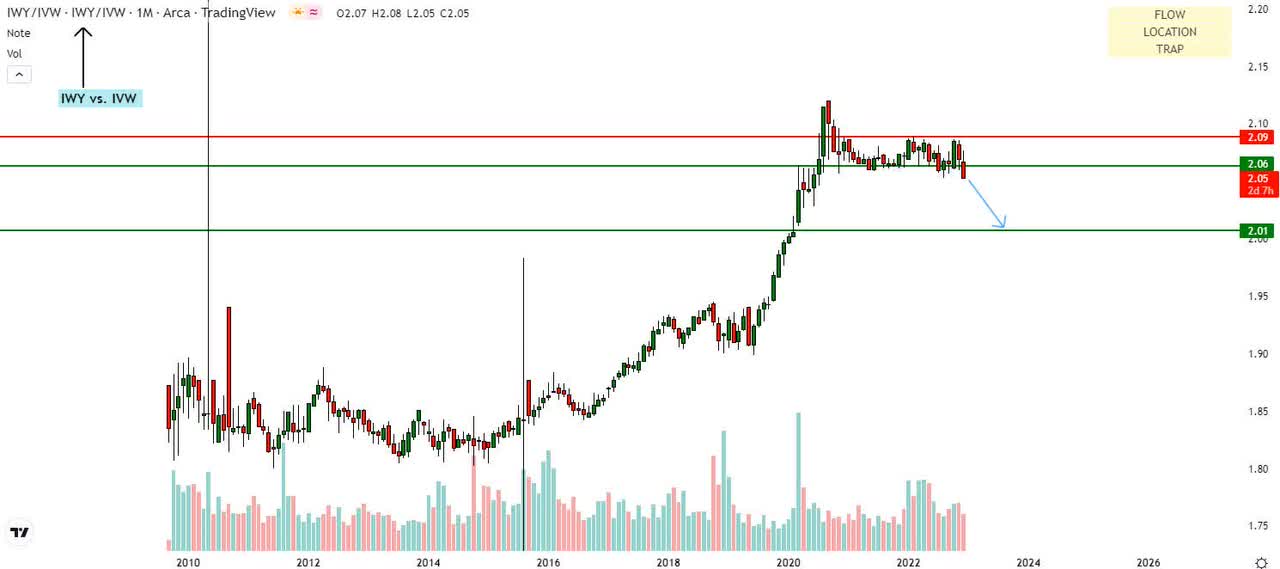
U.S. Federal Reserve’s Plans Are Not For IWY
As was expressed in my previous IVW analysis, the U.S. Federal Reserve’s interest rate hike campaign is the major driver influencing the fate of growth stocks in the U.S. currently. The U.S. Fed has an interest rate peak target of 4.25-4.5% and plans to keep the rate near this peak until 2024.
As growth stocks fare worse in high interest rate environments, this only puts more pressure on the IWY ETF over the short to medium term.
Here’s how I’m reading the technicals on IWY.
If this is your first time reading a Hunting Alpha article using technical analysis, you may want to read this post, which explains how and why I read the charts the way I do, utilizing the principles of Flow, Location, and Trap.
Read of Relative Money Flow
IWY vs SPX500 Technical Analysis (TradingView, Author’s Analysis)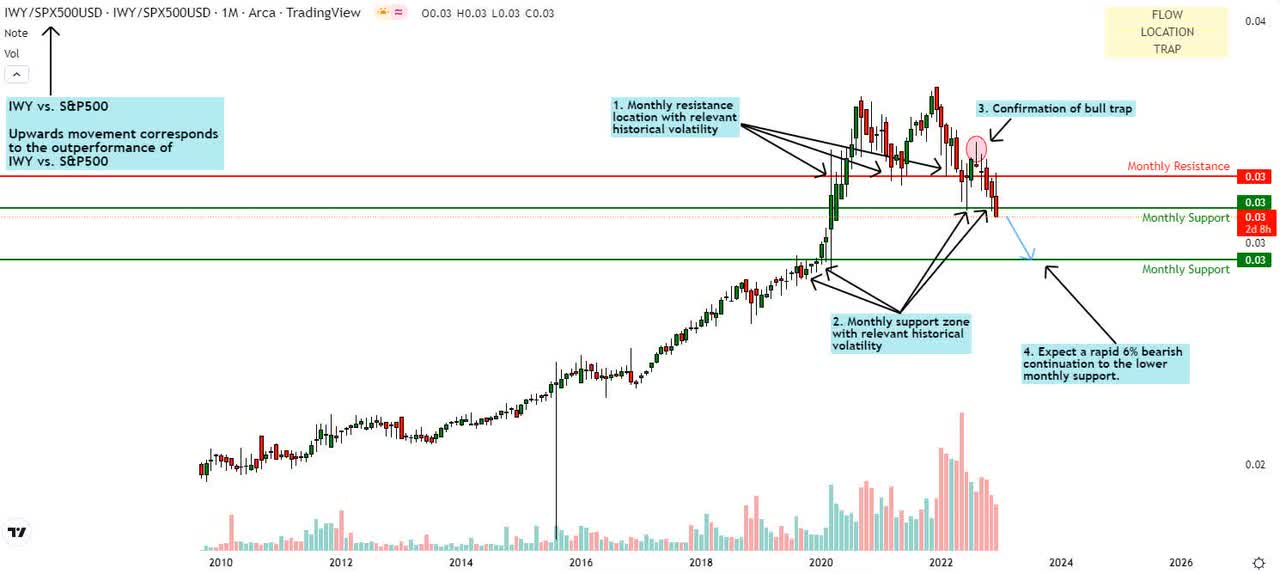
The IWY vs S&P500 (SPY) monthly chart shows a textbook buyer’s trap going by my technical analysis methodology. Between July and August 2022, the IWY/SPX500 pair feigned a switch in trend and attracted buyers who believed they were getting in at a discounted level. Alas, the pullback was a false breakout, trapping buyers and aggressively barreling downward.
At the time of writing this analysis, the ETF pair has breached the immediate monthly support and the focus has turned to the lower support level, from where the initial bullish spike in 2020 emanated.
Thus, I am bearish on the IWY/SPX500 pair and expect a 6% descent over the next few months.
Read of Absolute Money Flow
IWY Technical Analysis (TradingView, Author’s Analysis)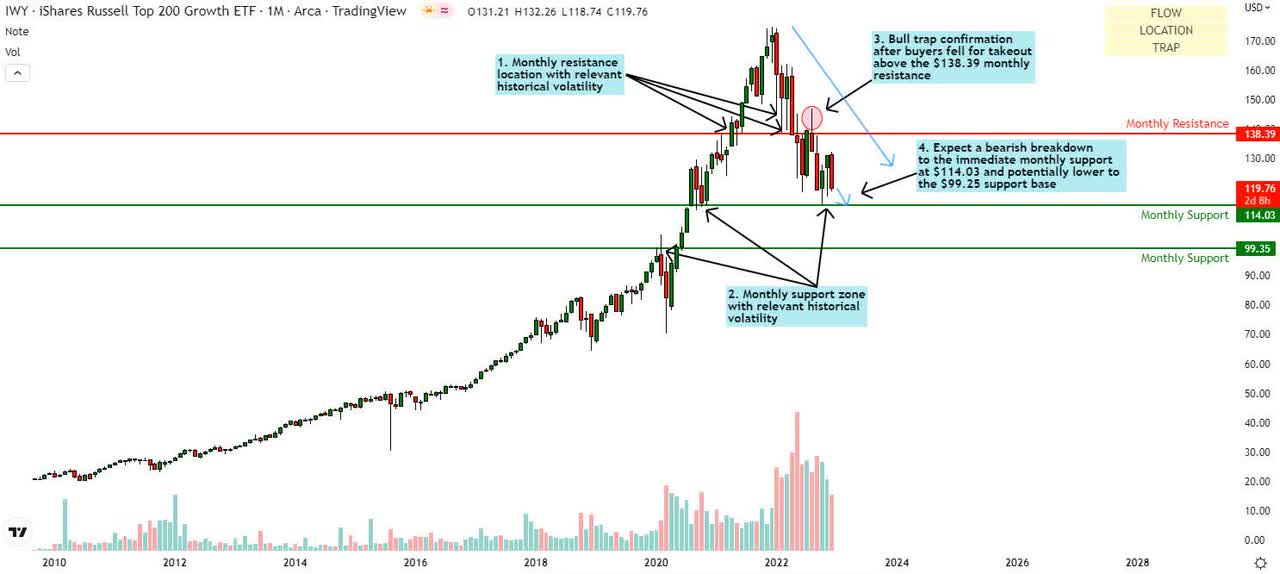
The story is similar on the standalone IWY monthly chart, with the ETF on its way to retesting the $114.03 support mark. This bearish move comes after a trap sighting in August as well, confirming a bearish continuation as the interest rate environment in the U.S. chips away at growth stocks. I expect to see a drop in price for the IWY ETF, potentially even down to the fresh, untested $99.35 monthly support.
Summary
I think the IWY ETF will continue on a steep path against the S&P500. As such, I believe both the IWY/SPX500 and the standalone IWY ETF is a sell. I expect IWY to be a more aggressive sell than IWV due to its higher exposure to technology stocks, which are hit badly in the current cycle of interest rate hikes.
Be the first to comment