

damircudic/E+ via Getty Images

Background
There are a number of options to invest in Indian stocks through ETFs, CEFs, and mutual funds. To gain exposure to faster-growing small-cap companies in India, the iShares MSCI India Small Cap ETF (BATS:SMIN) is one to consider. The iShares MSCI India Small Cap ETF, created by Blackrock, seeks to track the investment results of small-capitalization Indian equities. The iShares MSCI India Small-Cap ETF offers targeted access to mid- and small-cap Indian stocks. It can be paired with a large-cap ETF like WisdomTree Earnings ETF (EPI) for comprehensive India exposure.
India has a growing middle class in terms of population, and the middle class has rising income levels. By 2025, the middle class will be between 600 million and 700 million people, with an income compounding at 5-6% per year. The Indian economy is expected to grow at 6% to 7% in 2022, 2023, and 2024 due to growth in manufacturing and investments in infrastructure. The growth is likely to support Indian mid- and small-cap stocks. McKinsey projects India to have the largest talent pool of workers due to the combination of the English language with engineering, medicine, scientific, and technical degrees within the coming decade.
About SMIN
The inception date of the iShares MSCI India Small-Cap ETF is February 2012; thus, it has over 10 years of history. The fund trades nearly 50,000 shares a day and has net assets of nearly $300 million; hence, it has good liquidity for individual investors.
Key Facts (iShares)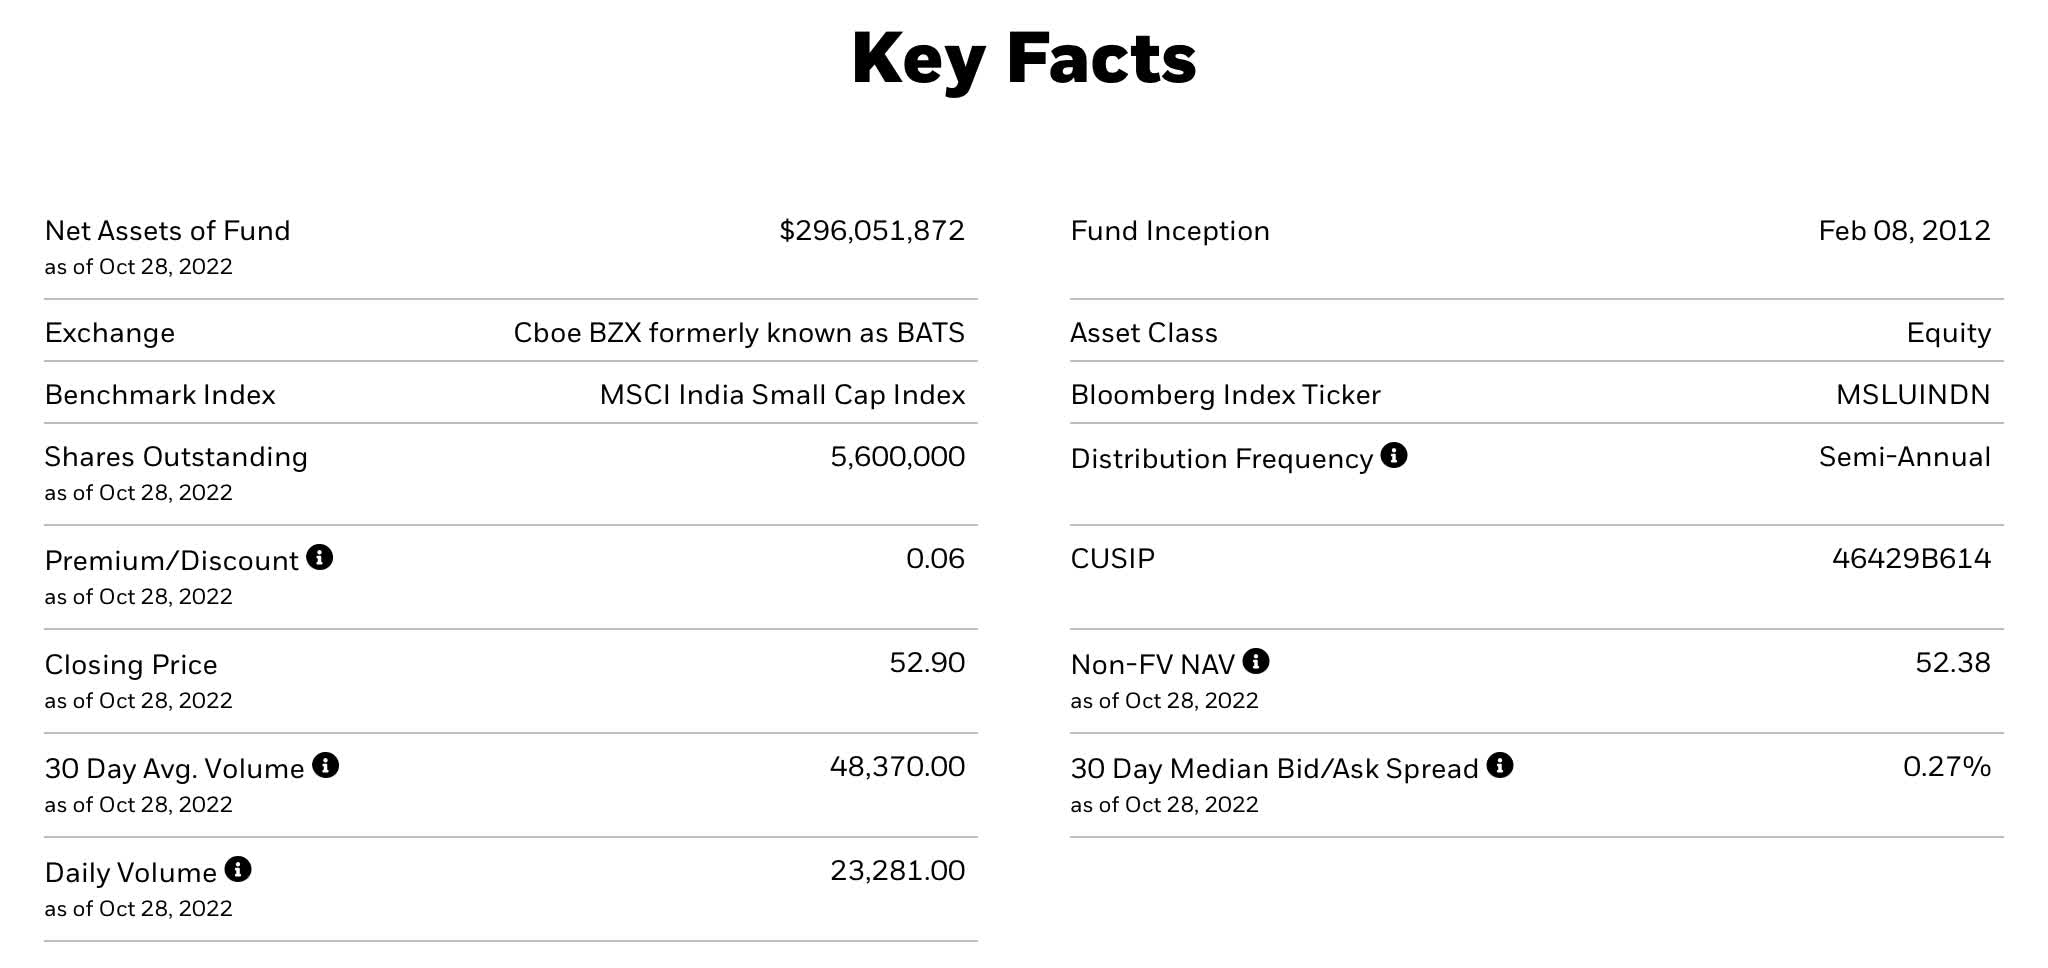
Product Characteristics
The drawback of this fund is its high future P/E ratio of 26. The fund has 354 holdings, which mitigates risk.
Product Characteristics (iShares)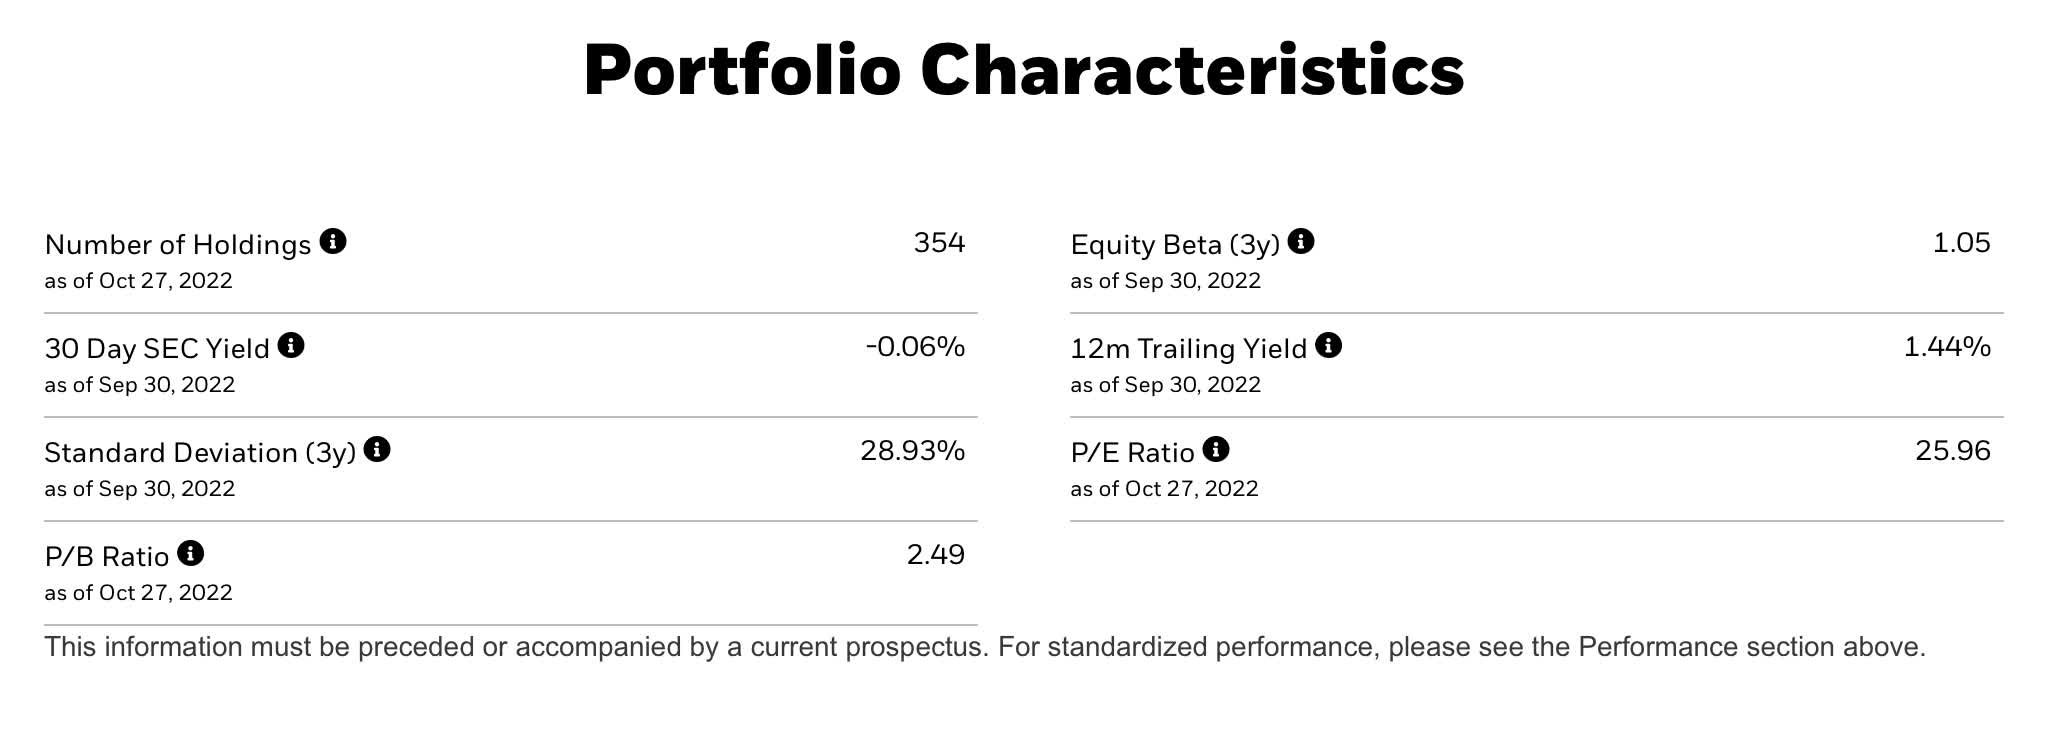
Fees
Annual fees of 0.74% are high even for an International ETF.
Fees (iShares)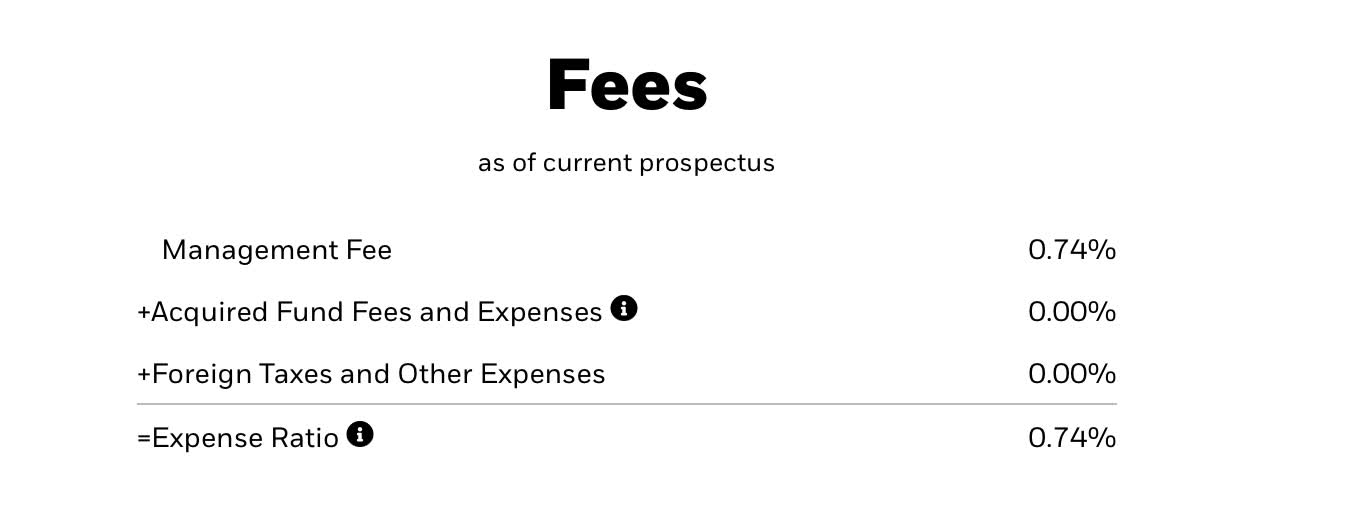
Holdings
The top 10 Indian companies besides Cash make up just over 12% of the total. The fund holds over 350 mid- and small-cap stocks.
Holdings (Seeking Alpha )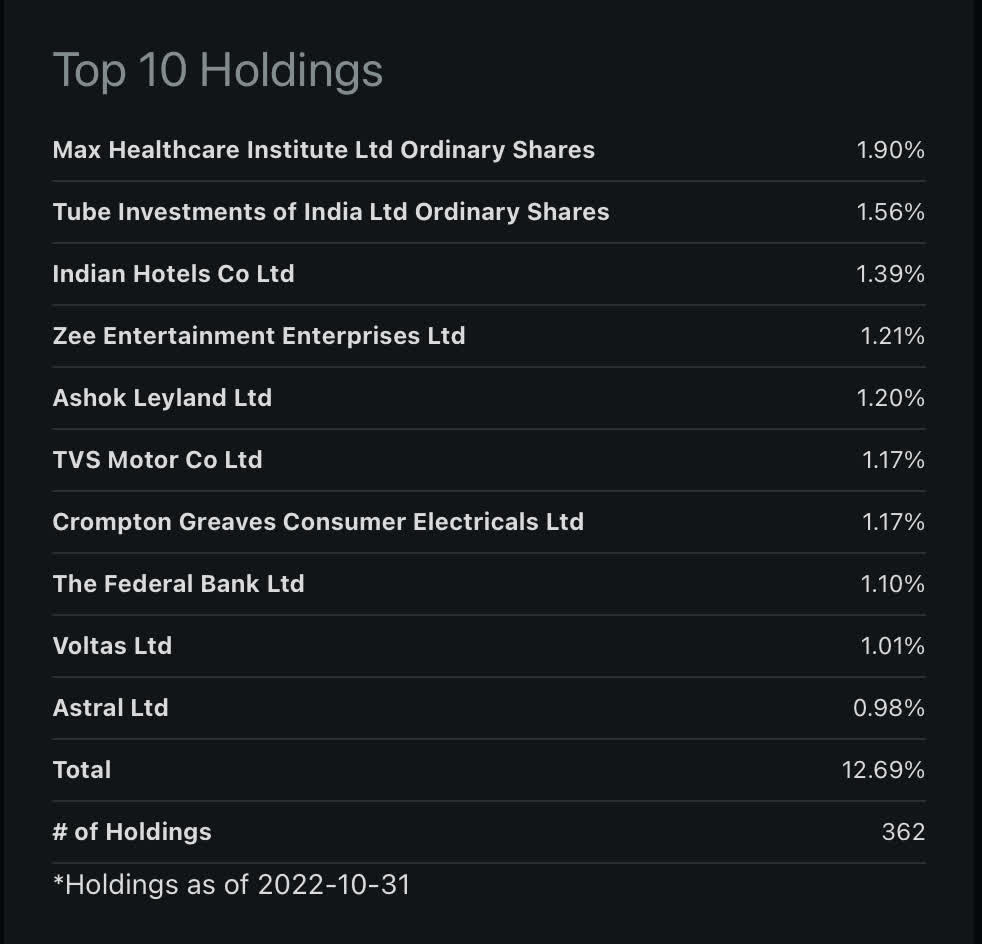
Sector
The top four sectors, which are materials, industrials, consumer discretionary, financials, and health care, make up nearly 80% of the fund.
Sector allocation (Blackrock)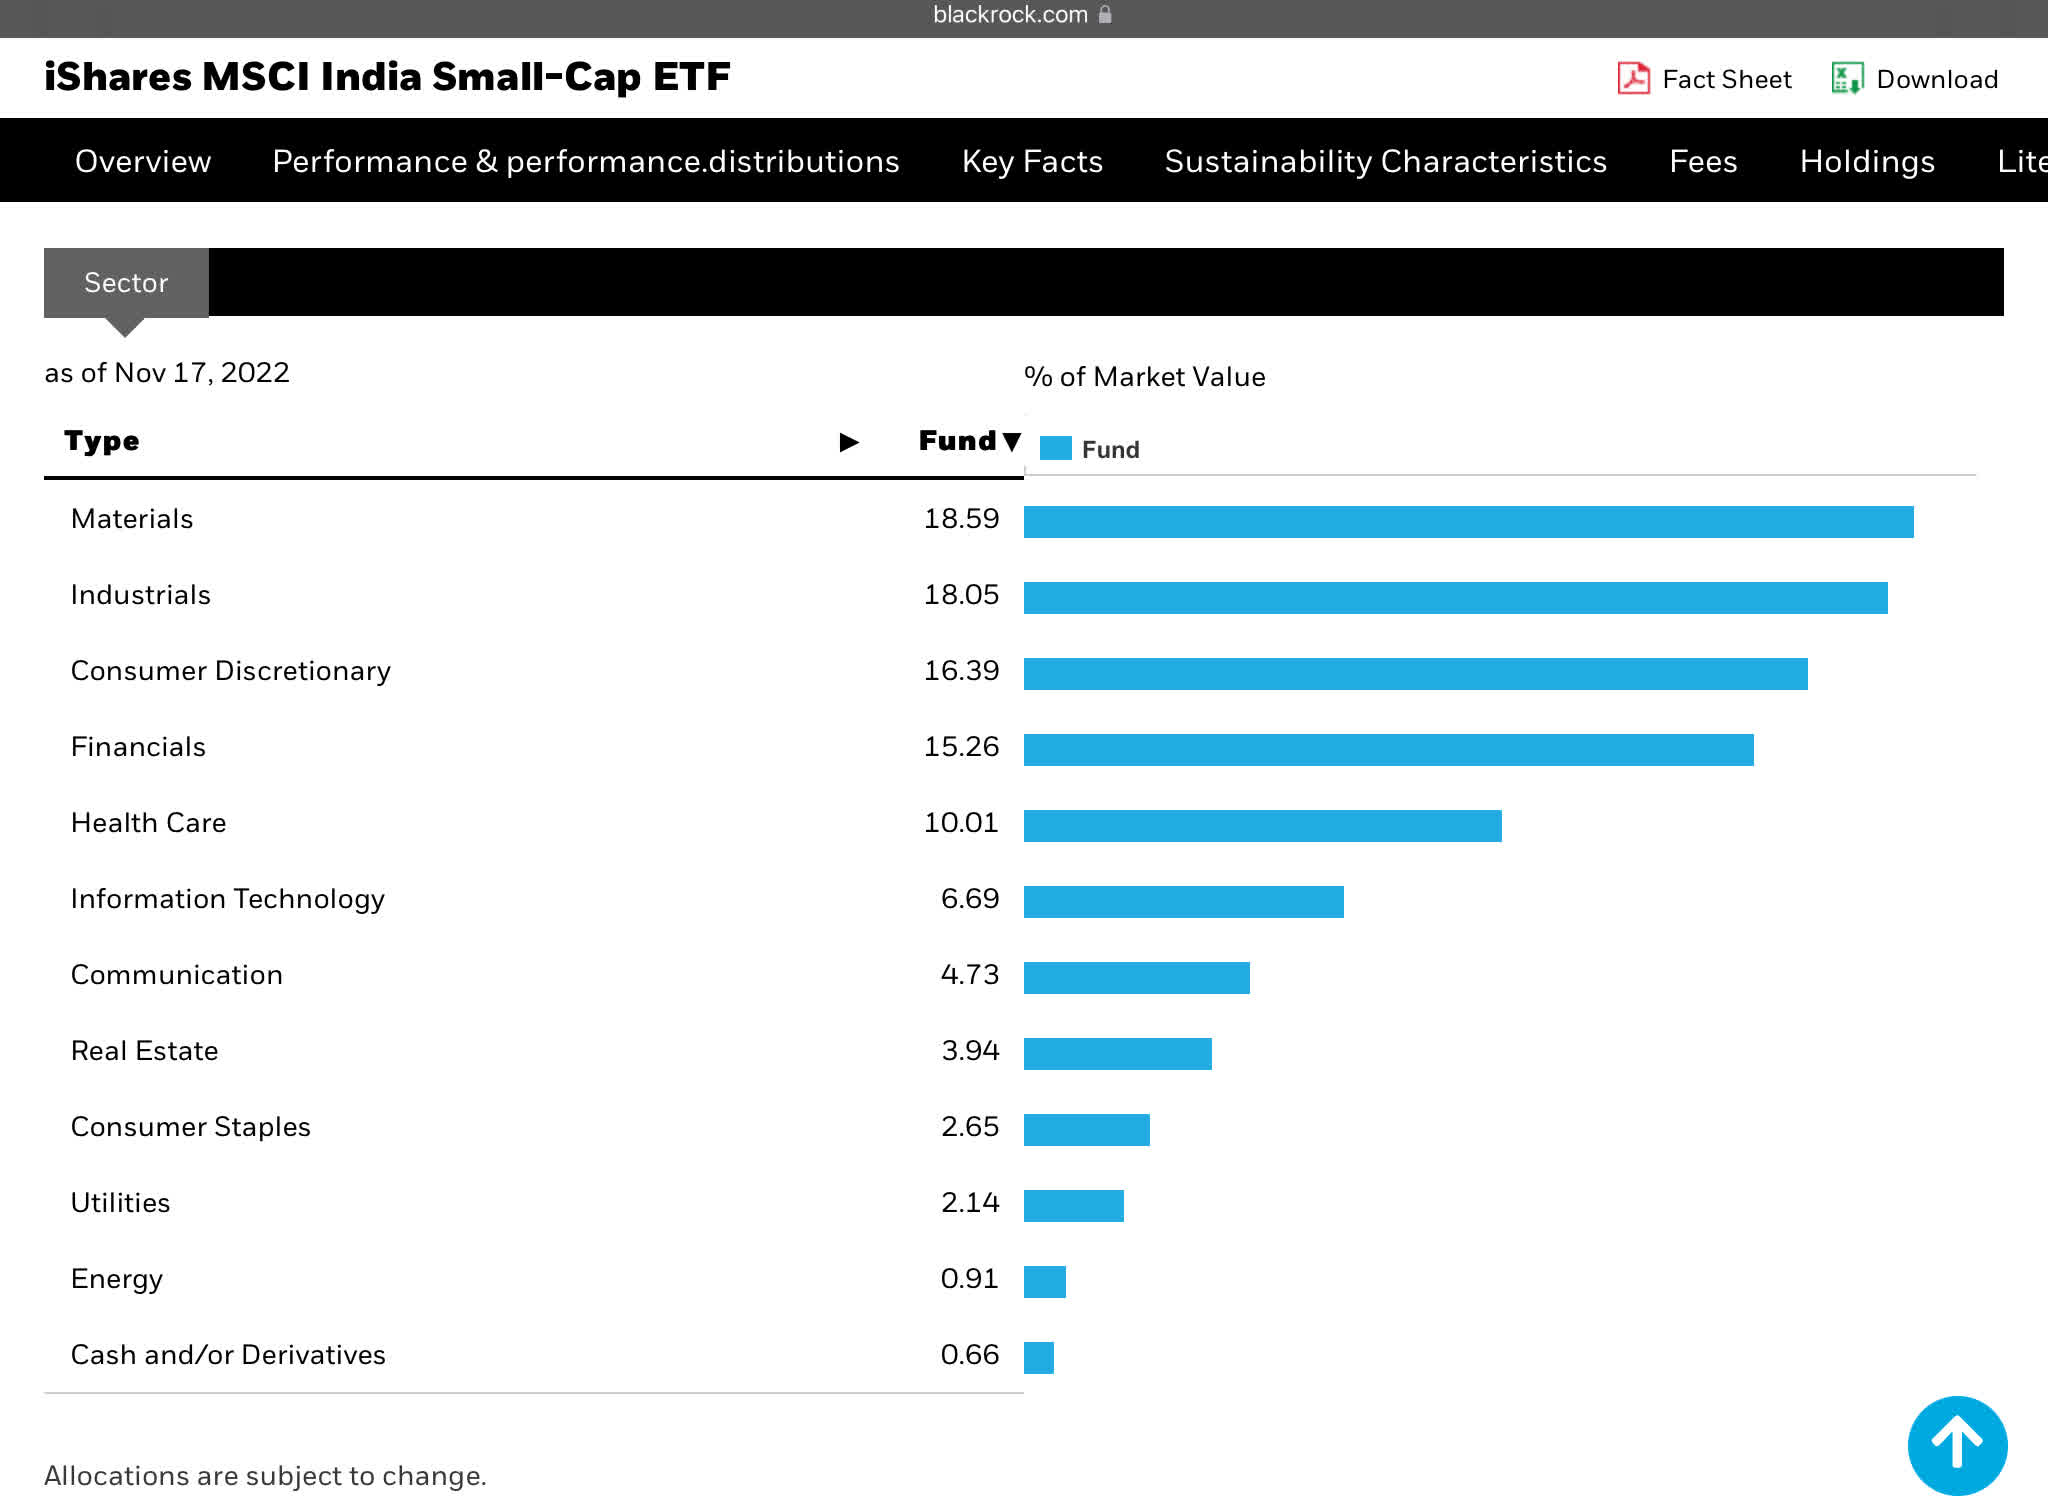
Comparing Emerging Market Small Cap ETFs
Below is a comparison of four ETFs. I am using IWM as a benchmark against three country-specific small-cap funds.
1. iShares MSCI Indian Small-Cap
2. US Small-Cap Index (IWM)
3. iShares MSCI China Small-Cap (ECNS)
4. iShares MSCI Brazil Small-Cap (EWZS)
Over any long-term time period, the iShares MSCI India Small-Cap ETF has outperformed the iShares MSCI China Small-Cap ETF and the iShares MSCI Brazil Small-Cap ETF. The iShares MSCI India Small-Cap ETF has performed almost as well as IWM.
Profile
The iShares MSCI India Small-Cap ETF has a higher expense ratio than the iShares MSCI China Small-Cap and the iShares MSCI Brazil Small-Cap, both of which are negative. Comparing assets under management, the iShares MSCI India Small-Cap ETF is considerably bigger than the iShares MSCI Small-Cap China fund or the iShares MSCI Brazil fund.
Profile 4 ETF (Seeking Alpha )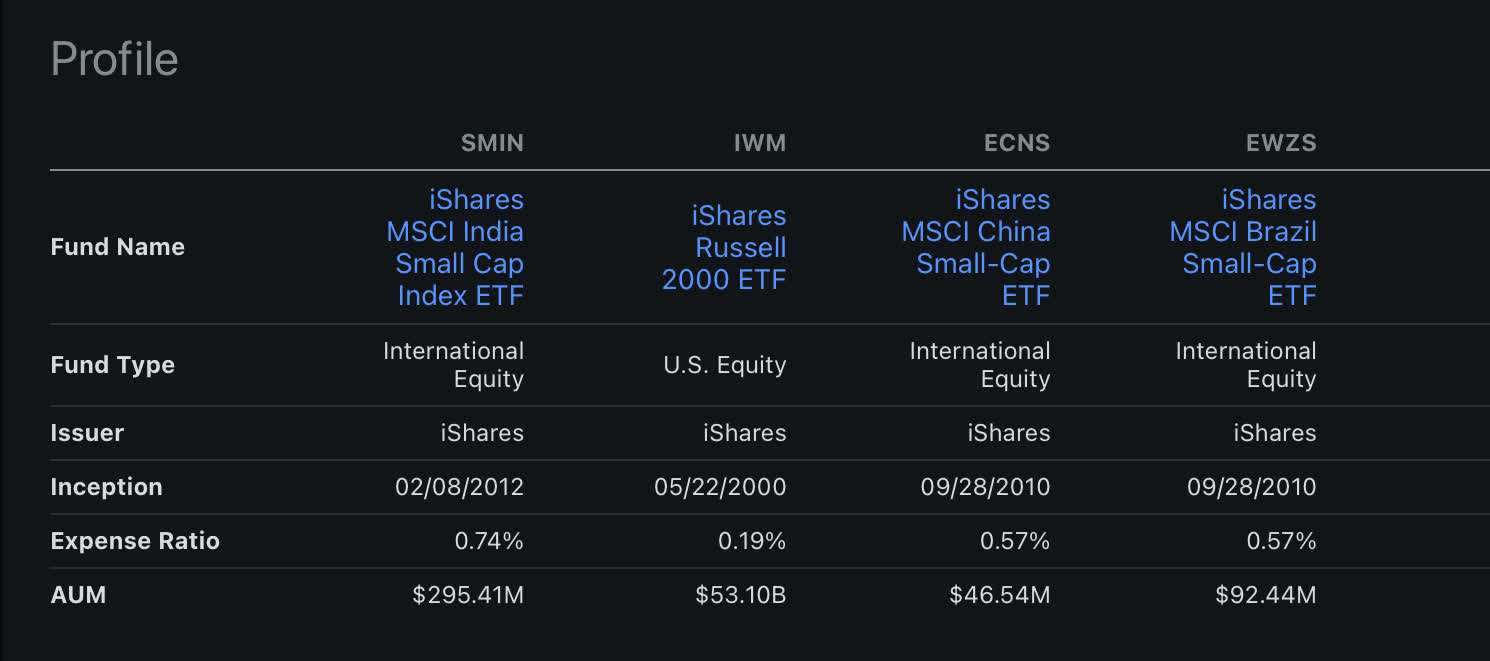
Liquidity and concentration risk
Concentration risk is lower for SMIN as it is more diverse than the ECNS or EWZS fund by having many more stocks, which reduces risk but still outperforms them over a number of time periods. The top 10 holdings in ECNS and EWZS represent a higher percentage of the total portfolio than those in SMIN.
Liquidity & Concentration Risk (Seeking Alpha )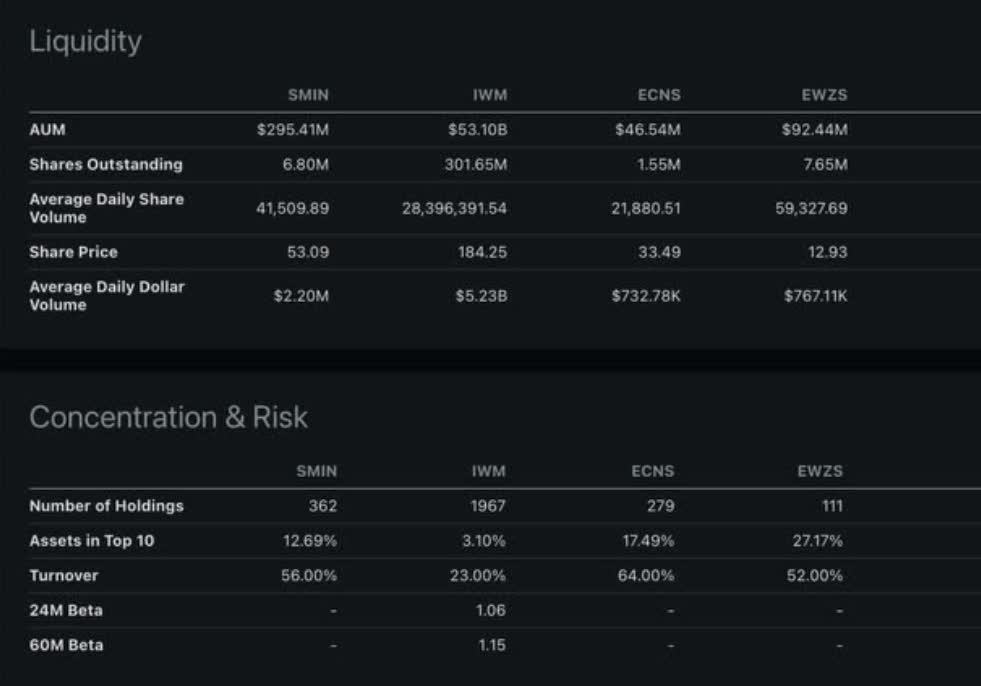
Performance
Over the past year, EWZS has performed similar to SMIN while ECNS has underperformed. SMIN has outperformed ECNS or EWZS by a significant margin over the last three, five, and ten years.
Comparison (Seeking Alpha )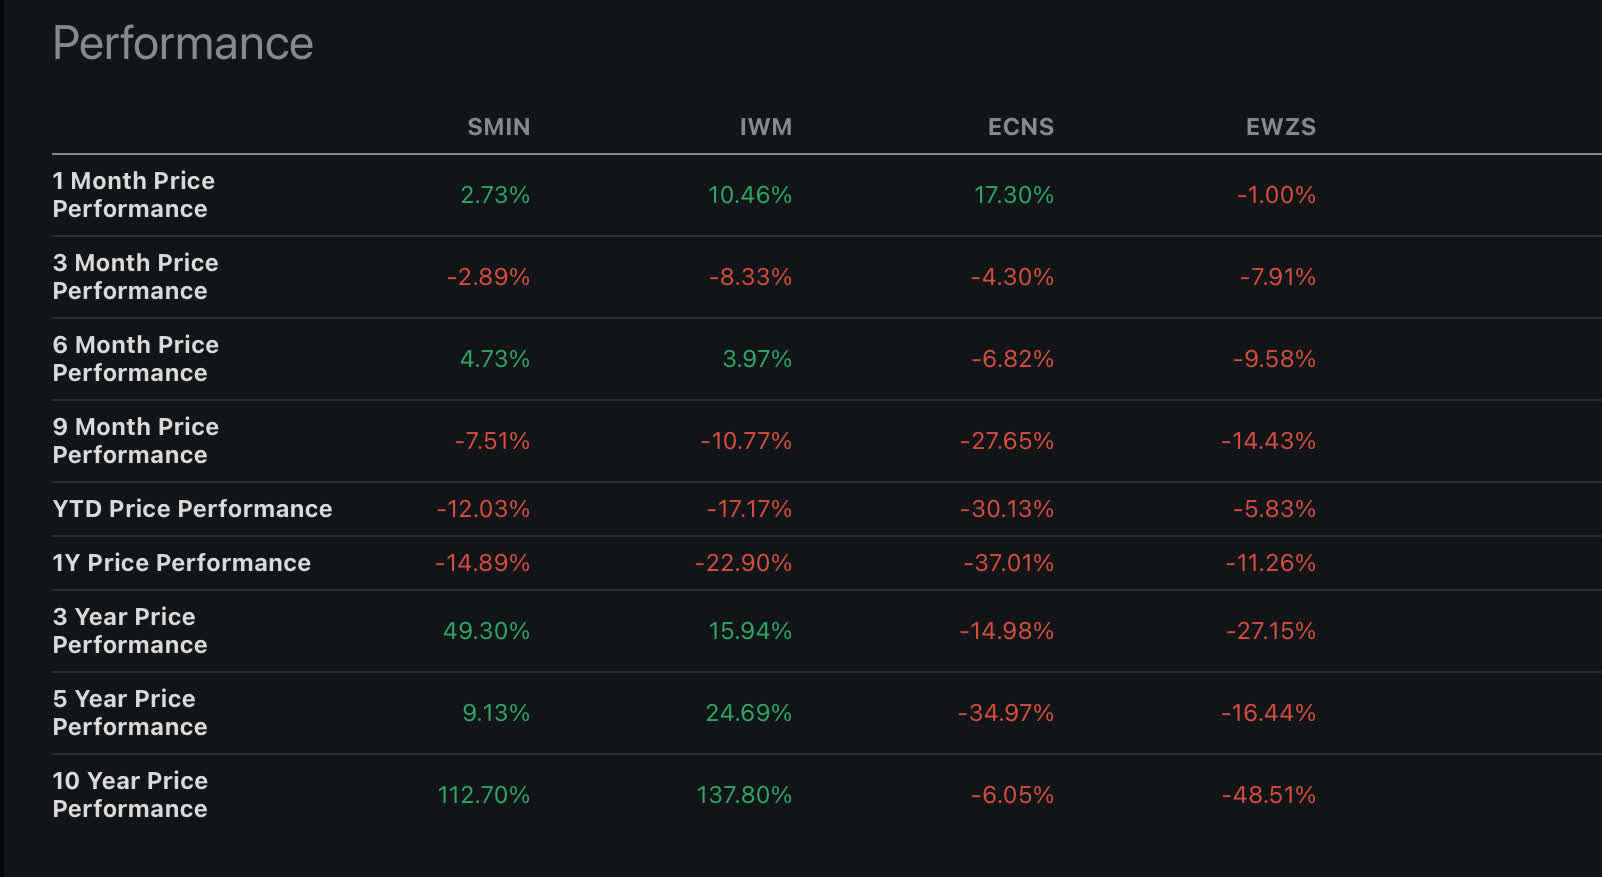
Below is the chart comparing the performance of SMIN, IWM, ECNS, and EWZS over the past 10 years. SMIN is tied with IWM while trouncing ECNS or EWNS.
10 year comparison (Author )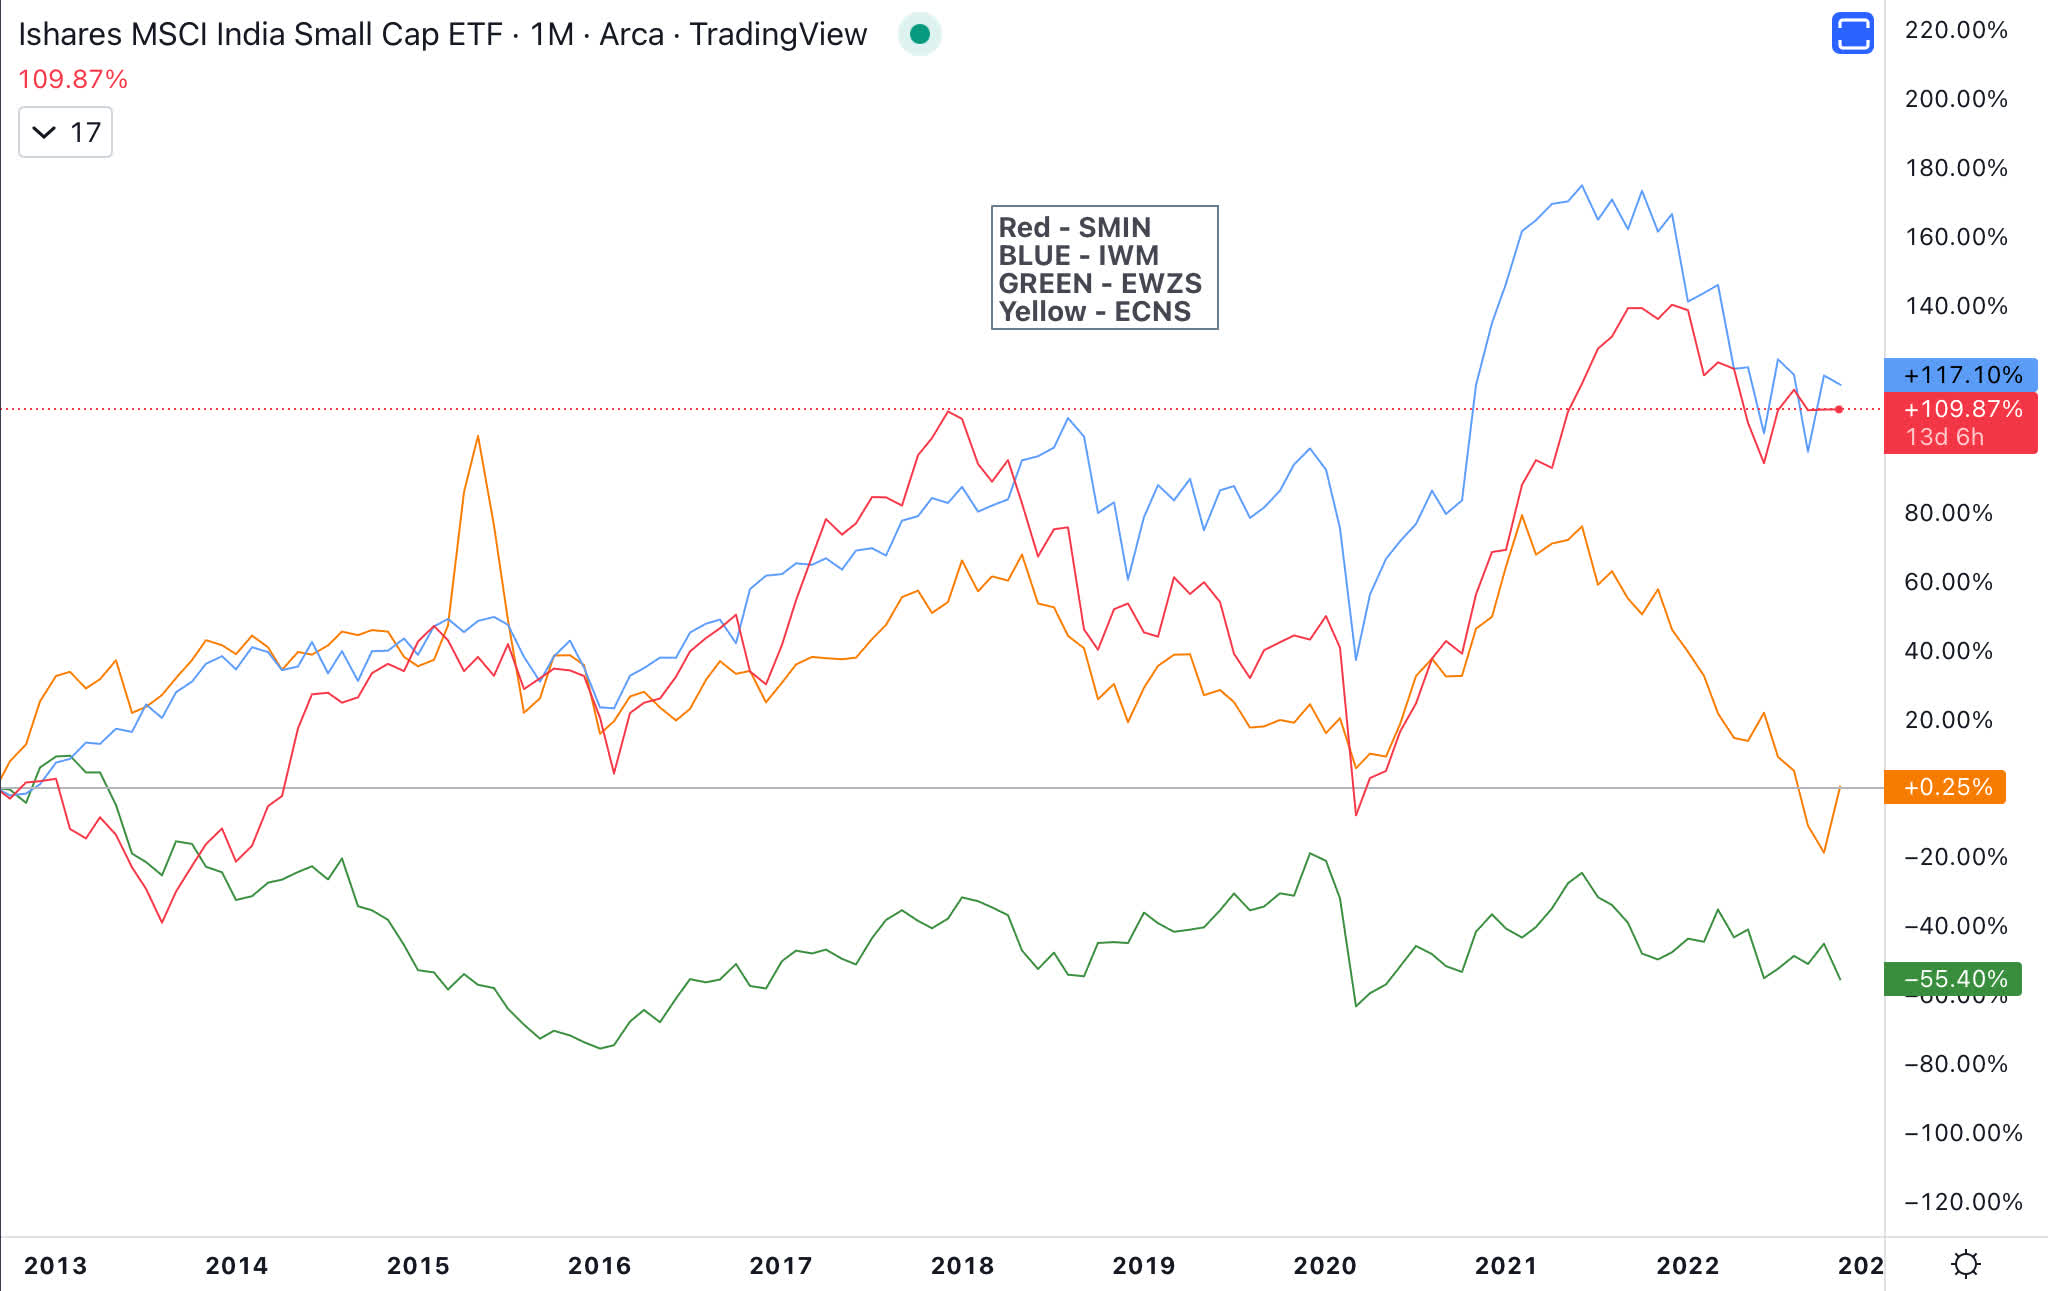
Each of the three international small-cap ETFs have underperformed IWM over the past 5 years.
5 year comparison (Author )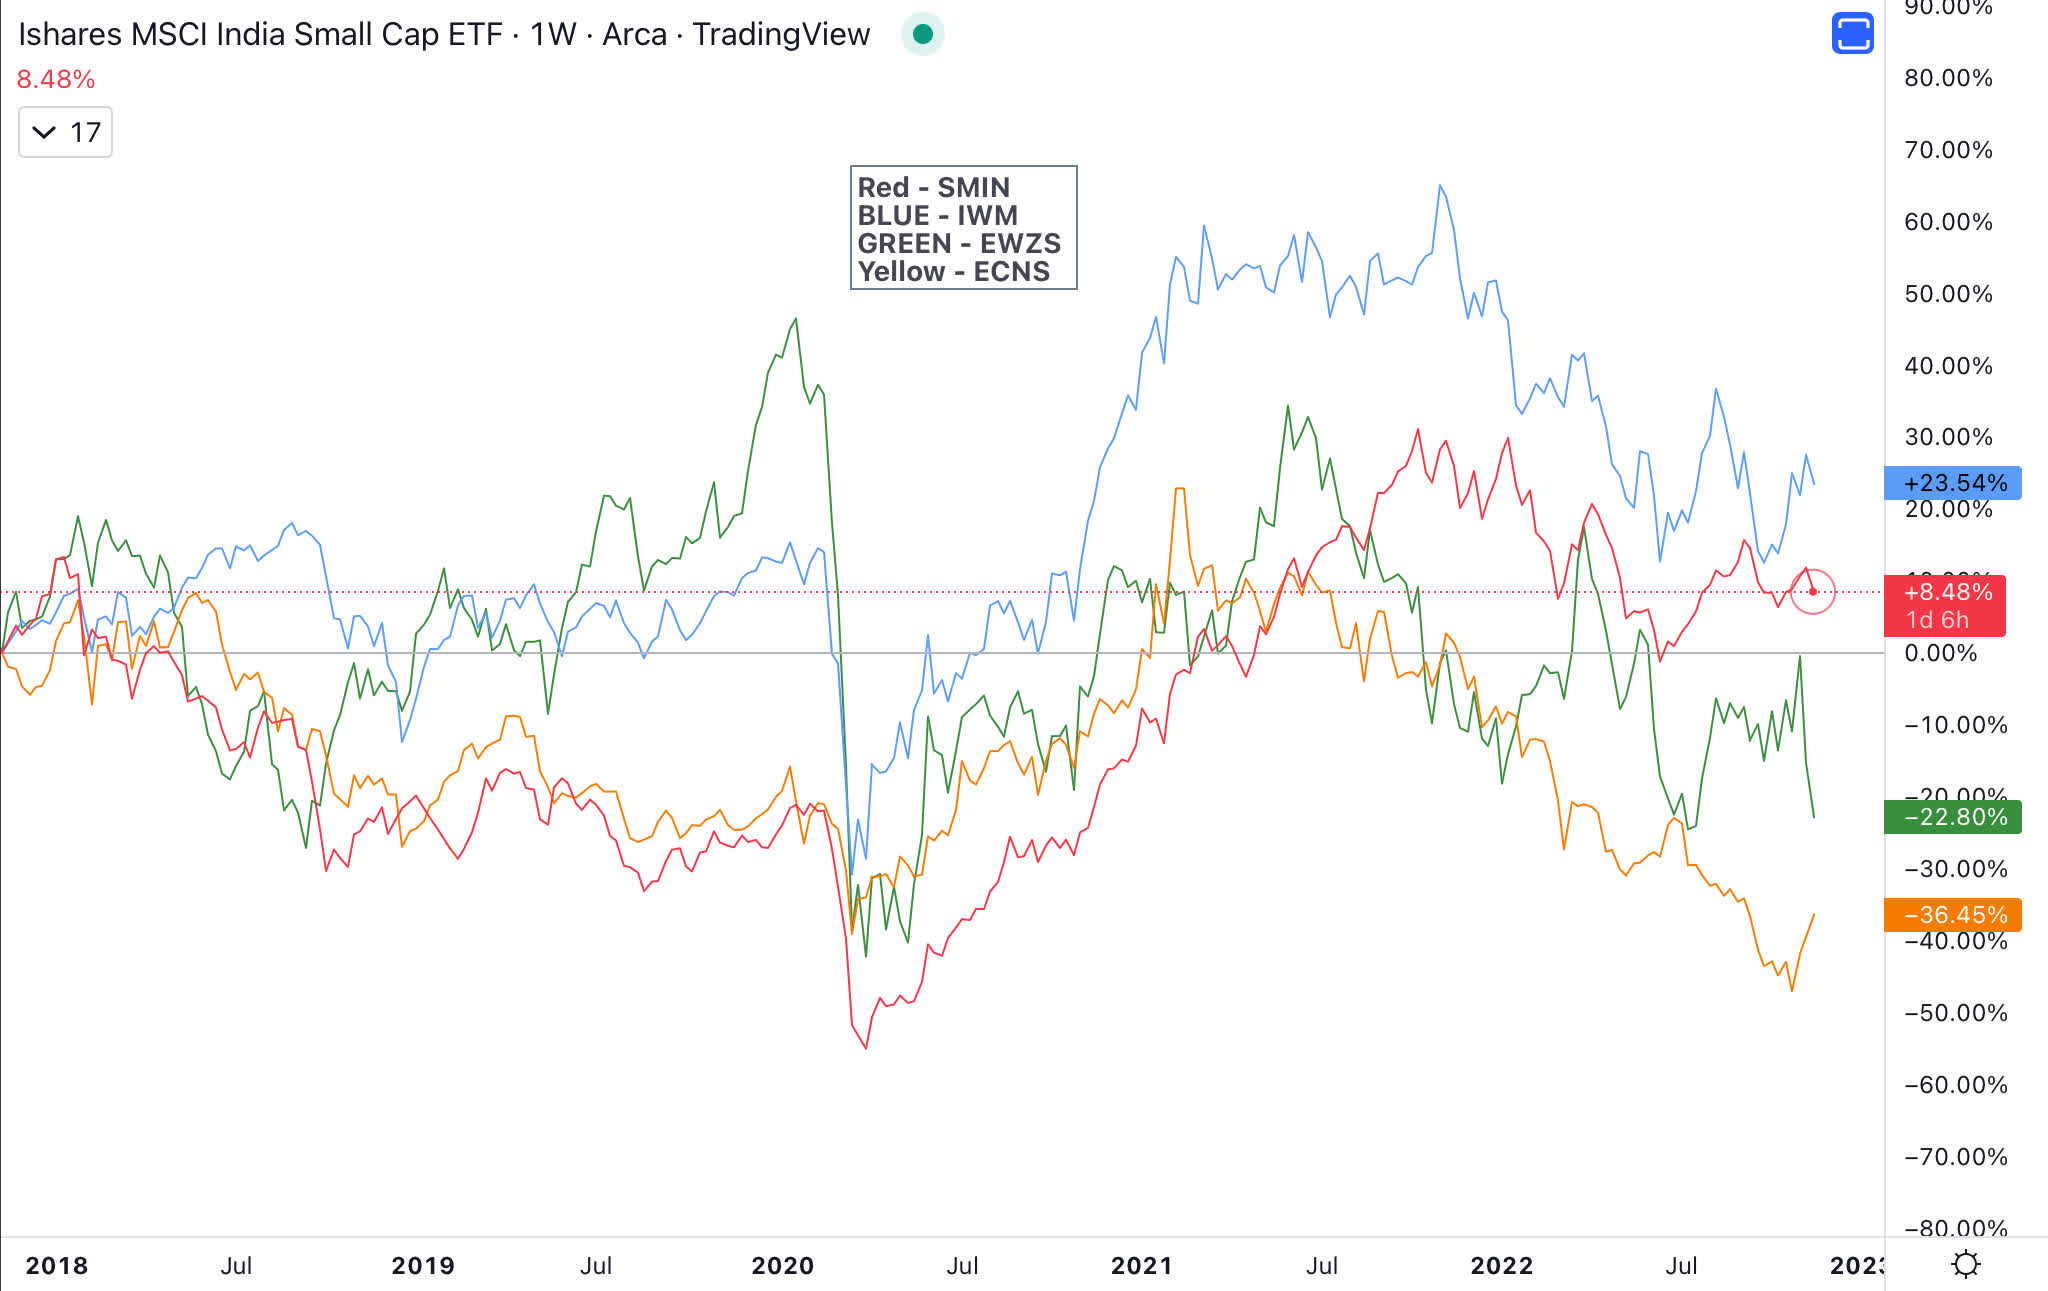
Comparison of performance since COVID bottom is where SMIN stands out. Is the outperformance by SMIN going to continue going forward? Let me know your thoughts in the comment section.
Comparison from COVID lows (Author )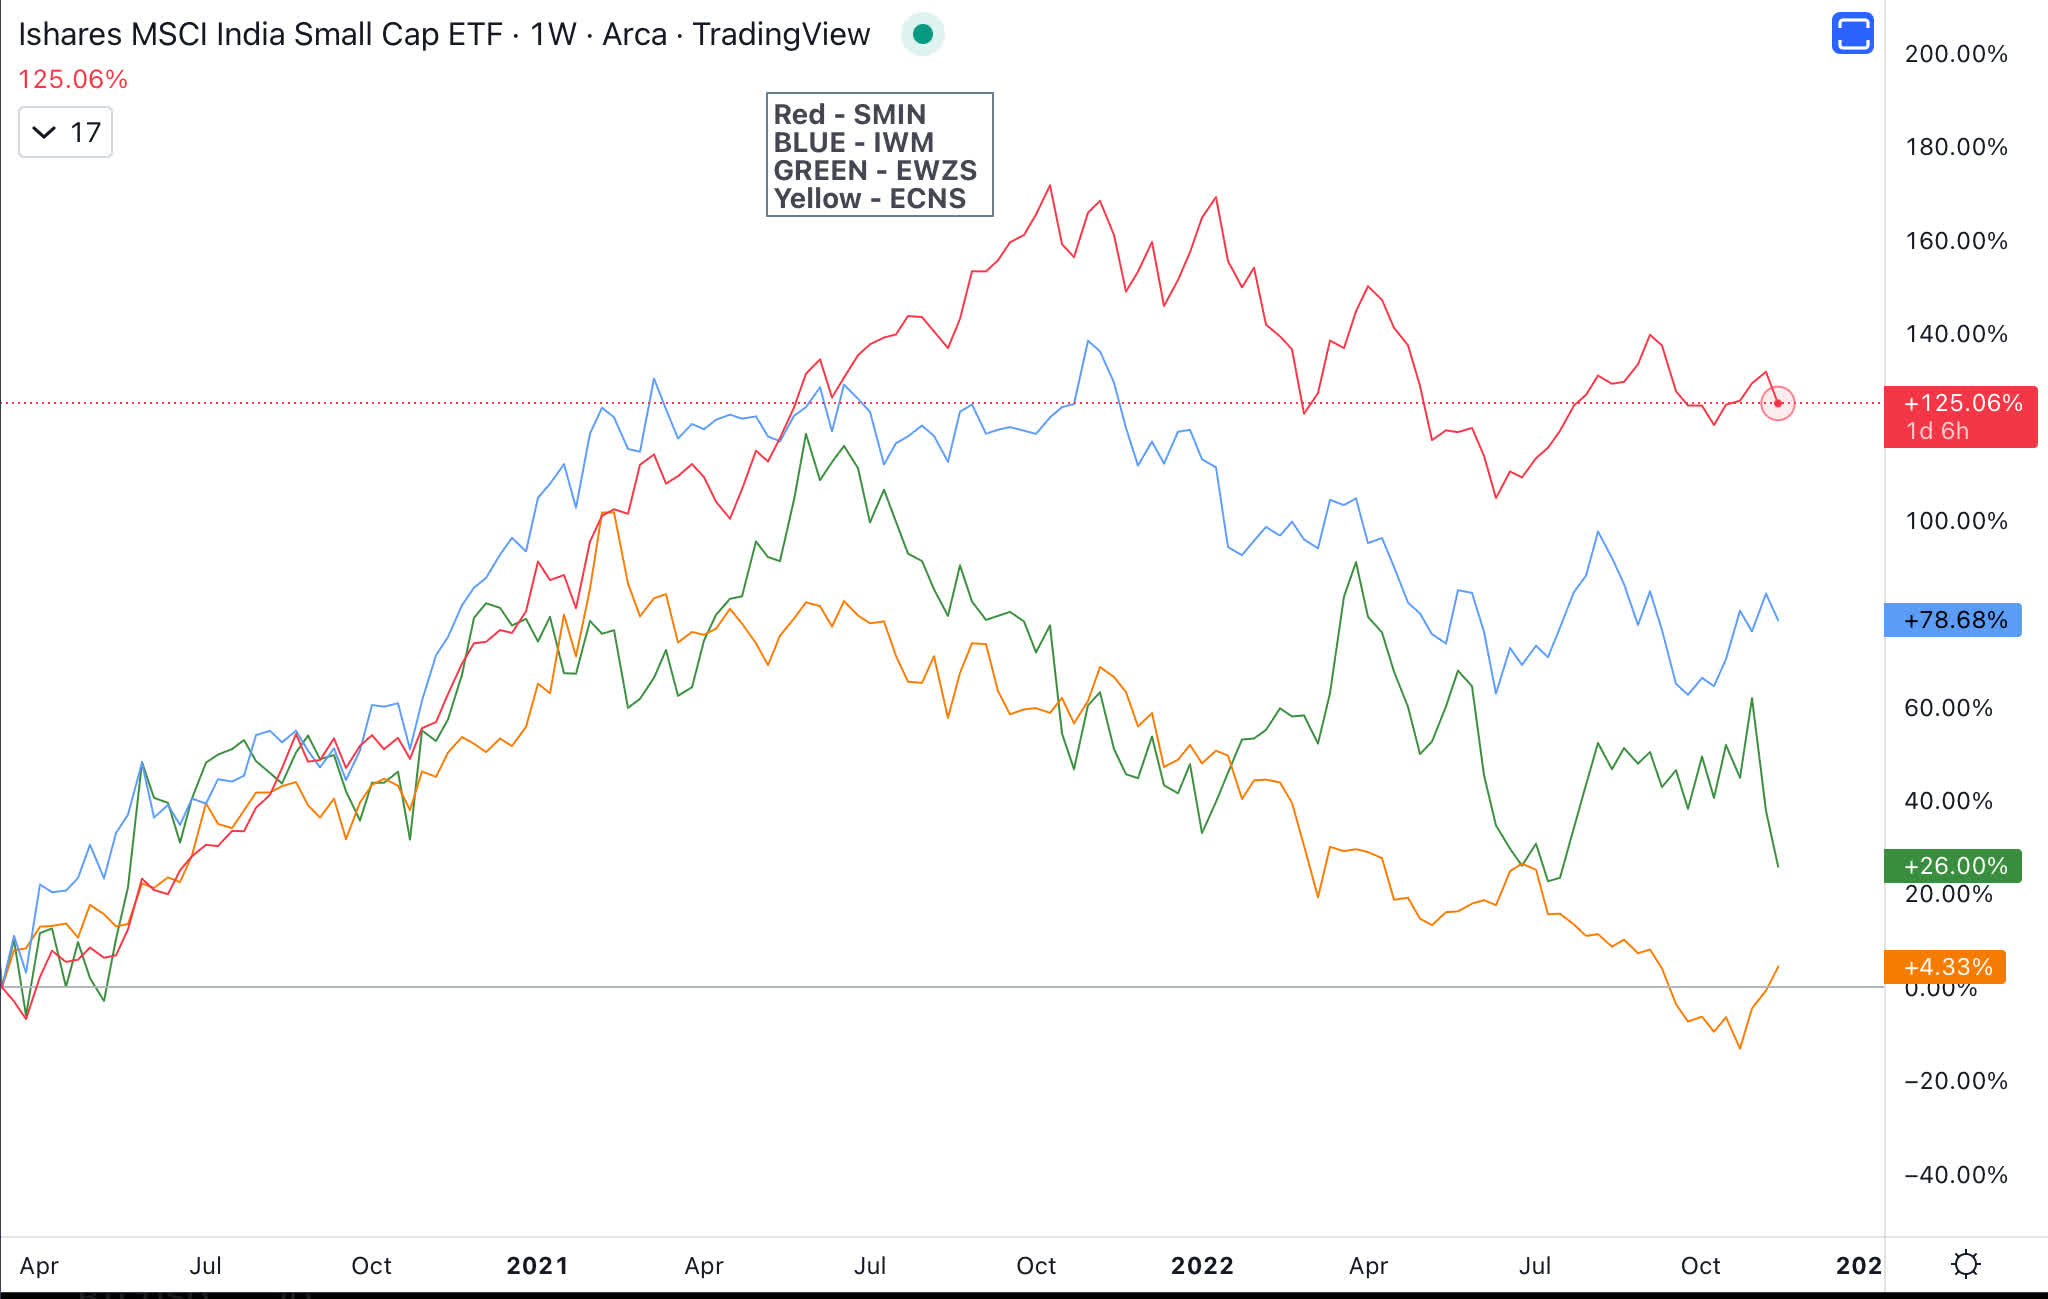
Technical Analysis
Weekly Chart
SMIN’s weekly chart is not yet a “buy” until the price is above the cloud. SMIN could be purchased on a close above $56.50 with a stop loss at $54. Above the clouds, SMIN could be starting a new uptrend.
Weekly Chart SMIN (Author )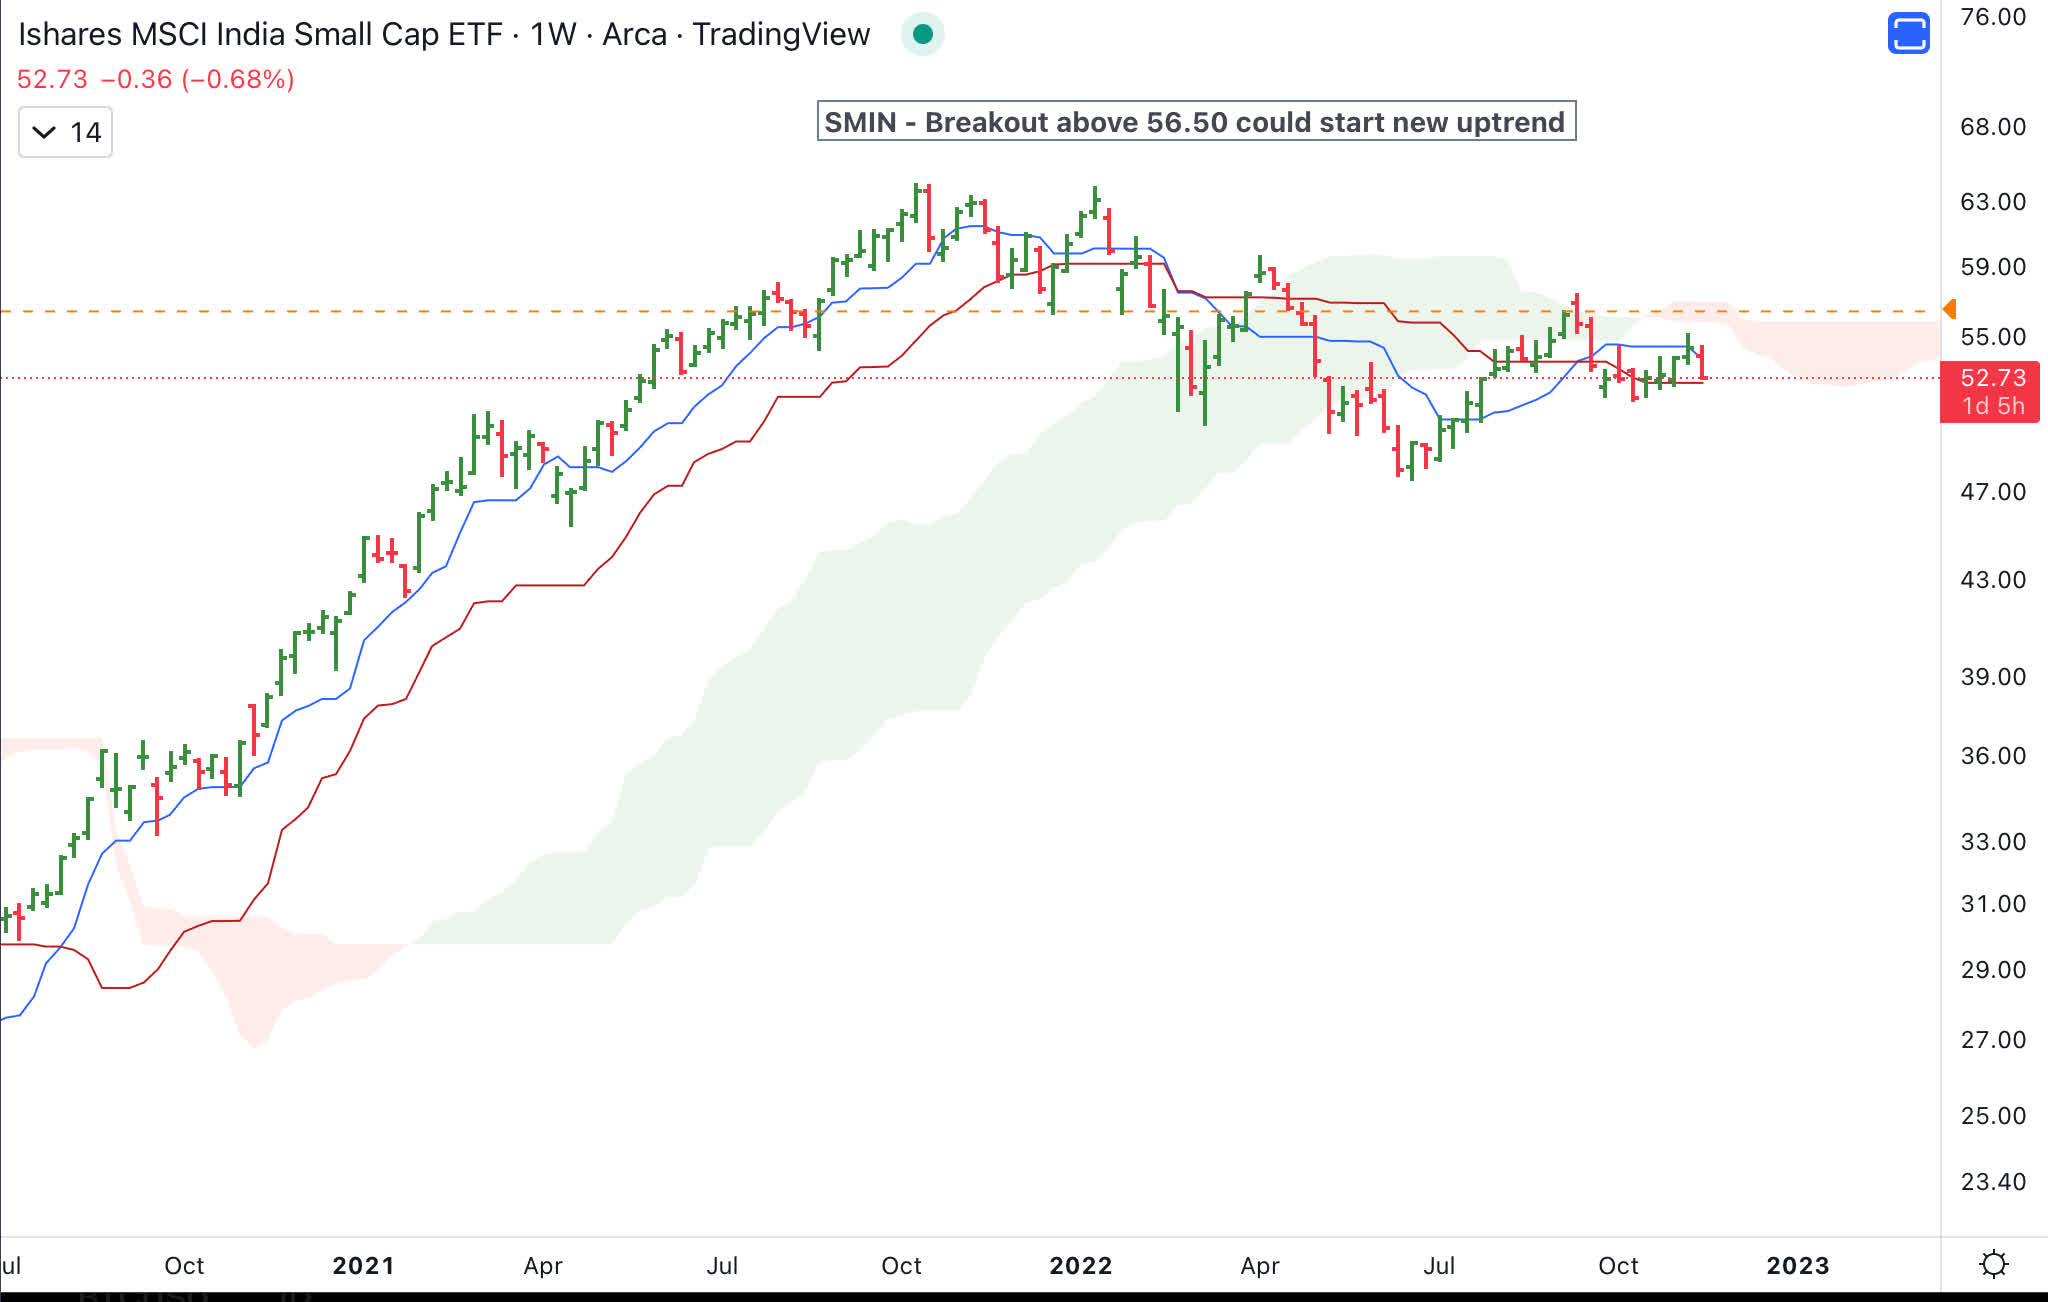
Daily Chart
From a technical analysis perspective, SMIN is tightening up just below the cloud. It’s best to wait until the SMIN price is above the cloud and breaks out above $56.50 and stays above $54.
SMIN Daily Chart (Author )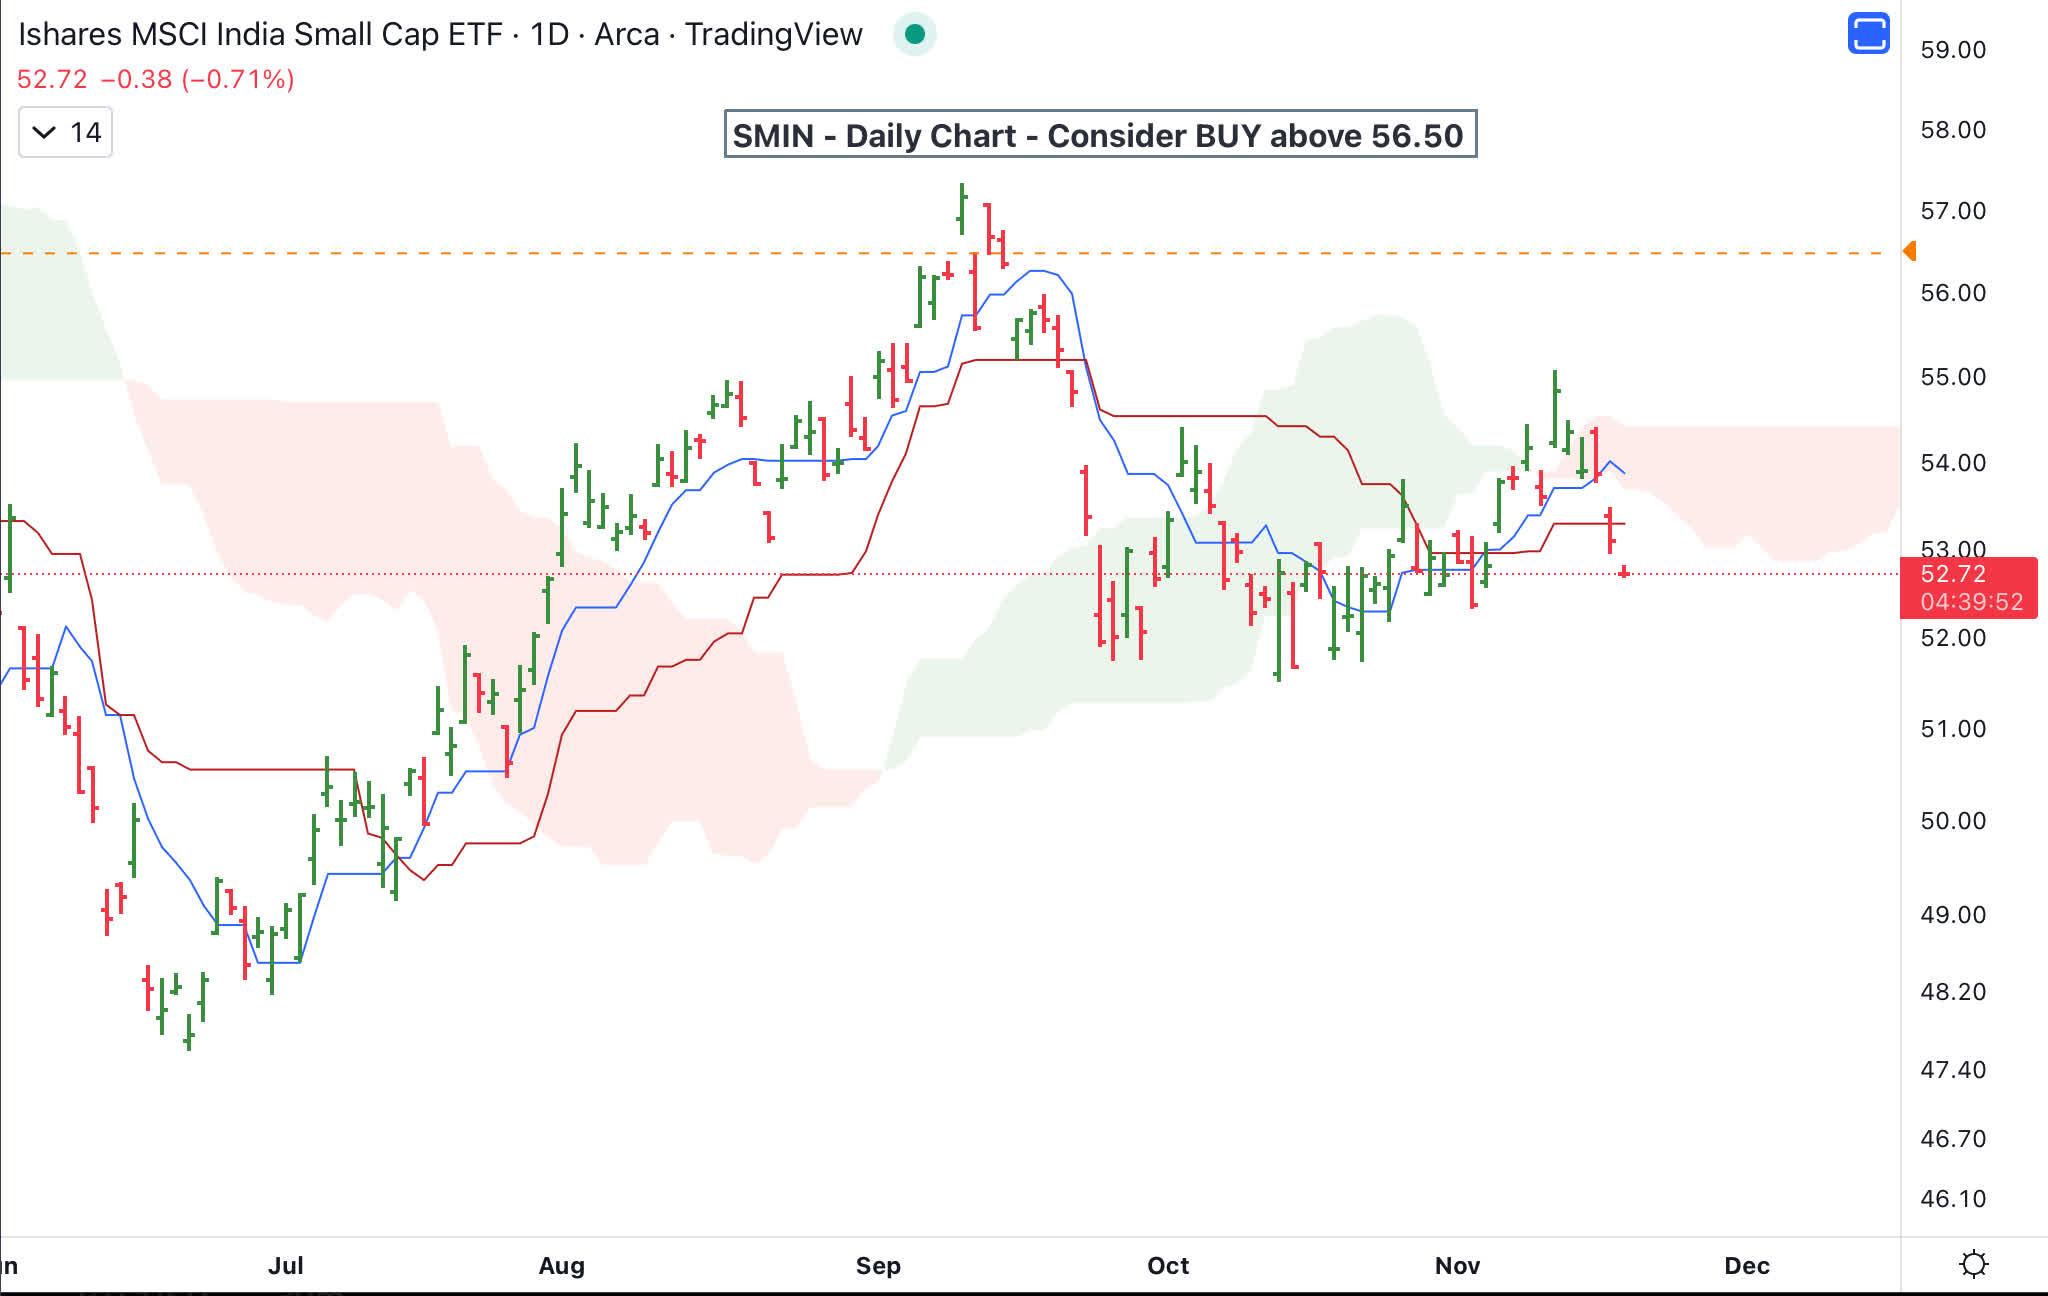
Risks
Indian laws and bureaucratic structure have and continue to work against a business friendly climate. We also have to keep in mind impact from recession in developed countries impacting growth in India. SMIN has high valuation and higher than average annual charges for the fund.
Summary
The coming decade could be one of steady growth for India as it invests heavily in modernizing infrastructure, digital transformation, and using software to develop manufacturing capability. If standards of living go up, it will help with employment and increase in income. While SMIN is not the cheapest fund based on future prices to earnings, it is an ETF to keep a keen eye on. SMIN is on the verge of receiving a buy rating, but I’m giving it a hold rating based on market conditions and technical analysis.
Be the first to comment