

da-kuk
By Gargi Pal Chaudhuri
Key Takeaways
- Rethinking the role of bonds – Recession is almost a certainty, but high and persistent inflation implies Federal Reserve easing is unlikely in 2023. Investors should consider adding high-quality fixed income to their portfolio at current yield levels.
- Pricing the damage – A higher real-rate regime favors value-style equities, a departure from a decade of growth leadership. For those willing to step out in equity risk, small-caps may present attractive risk-on fundamentals at favorable valuations.
- Living with inflation – Core inflation is unlikely to get back to pre-pandemic levels of below 2% in 2023. TIPS and infrastructure equities are historically attractive in a higher inflationary regime.
The investing regime we have long known has changed. Over the past fifteen years, accommodative central bank monetary policy had shaped asset allocation, encouraging investors to add risk in search of yield. The prolonged period of low, stable rates resulted in a fundamental shift away from fixed income and towards high-growth equities. We believe that the regime of “lower rates for longer” has transitioned to a regime of “higher rates for longer” – bringing with it profound implications for portfolio construction.
The post-pandemic inflationary shock brought a rapid rise in U.S. interest rates, with the Fed Funds rate moving from 0.25% to 4% in a span of just nine months, punishing equities and fixed income alike. In 2022, a portfolio comprised of 60% equities and 40% bonds returned -16.8% through the end of October1 – the worst annualized performance since 1937.2 The rapid normalization of monetary policy has brought about a reset across asset classes that has created incredible opportunities, particularly in fixed income markets. Today an investor can potentially earn over 5% coupon in a low-duration, high-quality fixed income bond, underscoring the enhanced role that bonds can play in an investors’ overall portfolio.3 Higher yields in fixed income also means that investors do not need their equity allocations to work as hard, and within their equity allocations they can focus on earnings resiliency in the face of an uncertain economic environment.
In this investor guide, we pair our macroeconomic views and market positioning insights to identify potential investment opportunities using exchange traded funds (ETFs). We consider fund flow trends and proprietary signals designed to capture crowded positioning and under-owned opportunities within each investment theme.
Theme One: Rethinking The Role of Bonds
We are bound for the most well-advertised economic slowdown in recent memory. Given the speed and magnitude with which the Federal Reserve needs to drive down demand in the economy to tame inflation, a recession seems inevitable. Even as the Fed’s tightening begins to bite and economic activity begins to slow, we believe inflation will likely remain above the Fed’s 2% target due to the stickiness of prices within services and other key consumption basket components, like shelter. Elevated levels of inflation should prevent the Fed from easing aggressively, even if a recession takes hold. Although markets continue to trade on the possibility of a Fed “pivot,” we think central bank authorities will raise and then hold rates in restrictive territory throughout 2023 – waiting for the long and variable lags of monetary policy tightening to feed through into the economy. Put simply, the rate regime has shifted from one of “lower for longer” to “higher for longer.”
It is time to consider a new portfolio playbook.
- Put your cash to work. We believe investors can seek to generate income while maintaining the comparative safety of cash-like investments through ultra-short duration securities. The Federal Reserve has already delivered the bulk of rate increases pegged for this hiking cycle. Therefore, investors can look to earn a steady income stream in lieu of low-yielding cash in their portfolios.
- Bonds are back. During the last decade, investors largely moved away from fixed income in search of yield amid a lower-rate environment. Reaching a similar yield target today requires less equity risk, as fixed income yields have returned (Figure 1). This is likely to drive a shift back into fixed income, as it returns as an investable asset class.
Figure 1: Minimum fixed income required to achieve a 6.5% yield
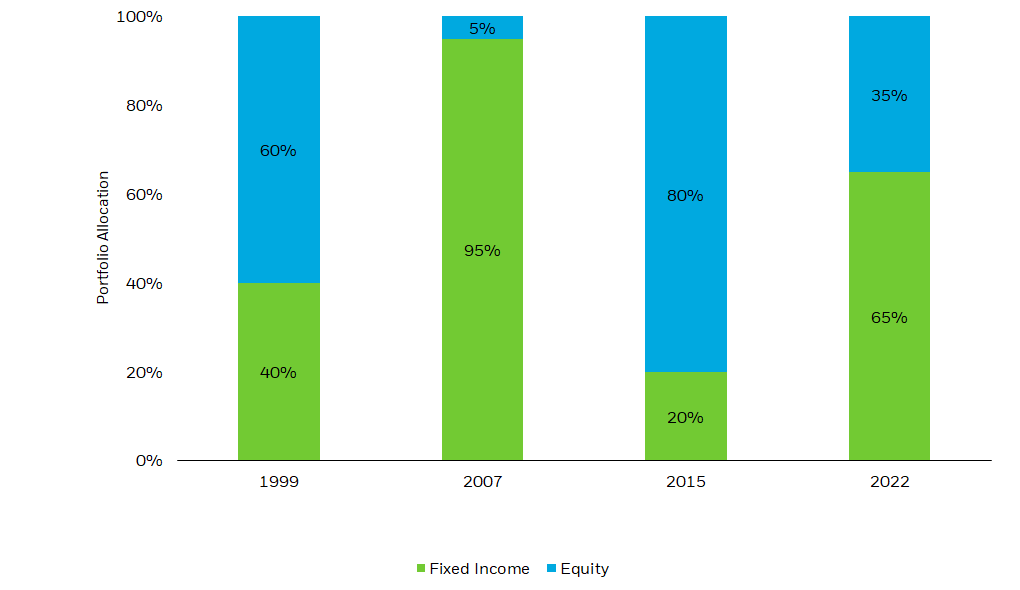
Source: BlackRock, Bloomberg, chart by iShares Investment Strategy. As of November 16, 2022. “Fixed income” represented by a set weight of different fixed income allocations (40% Investment Grade, as represented by represented by the ICE BofA U.S. Investment Grade Index, 30% Emerging Market Debt, as represented by J.P. Morgan EMBI Global Core Index, 10% 10 Year Treasury Bonds, as represented by the U.S. 10-Year Treasury, and 20% High Yield Bonds, as represented by the ICE BofA U.S Index). “Equity” represented by S&P 500 earnings yield. Index performance is for illustrative purposes only. Index performance does not reflect any management fees, transaction costs or expenses. Indexes are unmanaged and one cannot invest directly in an index. Past performance does not guarantee future results.
Chart Description: Bar chart displaying portfolio allocation (between fixed income and equities) needed to achieve a 6.5% yield in 1999, 2007, 2015, and 2022. The chart depicts a 65% allocation to fixed income in 2022, a large increase in allocation compared to 20% in 2015.
The rapid shift higher in yields has created significant opportunities in high-quality, front-end fixed income exposures.
With yields at levels not seen since the Global Financial Crisis, the front end of the curve in both nominal U.S. Treasuries and investment grade credit offer the potential for attractive total returns (Figure 2). High quality corporations with strong balance sheets can weather a mild recession, especially as many of these companies have refinanced their debts at lower yields. We’ve already seen investors move in this direction, with front-end U.S. Treasury and investment grade credit ETFs adding $10.6 billion and $1.3 billion, respectively, in net assets year-to-date.4
Figure 2: Fixed income yields: 2021 vs. 2022
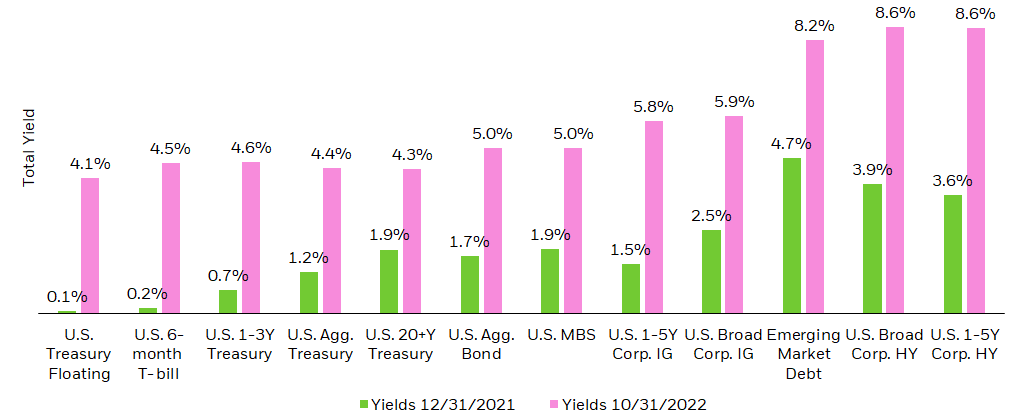
Source: BlackRock, Bloomberg, chart by iShares Investment Strategy. Yields shown are yield to worst.5 As of November 11, 2022. Index performance is for illustrative purposes only. Index performance does not reflect any management fees, transaction costs or expenses. Indexes are unmanaged and one cannot invest directly in an index. Past performance does not guarantee future results.
Chart description: Bar chart displaying yields across fixed income strategies comparing year-to-date yields in 2021 to 2022. Total yield dramatically outperformed in 2022, with US 1-5Y Corp. HY reaching 8.6% as of October 31, 2022, the highest-yielding fixed income security displayed.
We also see opportunity in agency mortgages. Mortgage-backed securities (MBS) have suffered this year from the sharp rise in mortgage rates and pressures from the Federal Reserve’s balance sheet runoff. However, U.S. mortgage-backed securities – including those issued by government-sponsored agencies such as Ginnie Mae, Fannie Mae, and Freddie Mac – have a current yield over 4.6%, a level not seen since the Global Financial Crisis.6 We believe the underlying mortgage market is healthier than during the crisis, while carrying very little prepayment risk due to the rate backdrop.7 For those looking to moderately extend duration, mortgage-backed securities can be a liquid way to access high quality income.
Theme 2: Pricing The Damage
In assessing the damage from the sell-off that defined markets in 2022, the discussion for many investors often turns with surprising speed to “when do I buy the dip?” Given the sector weighting of broad equity indexes, “dip-buying” is often conflated with the question of “when do I buy tech again?” This implicit question fails to recognize the regime shift that has taken place: the accommodative monetary policy that drove the decade-long outperformance of growth (and large-cap technology in particular) is over.8 As a result, we remain broadly defensive on a tactical basis, favoring industries like health care and energy producers.
Stock prices are a function of earnings, interest rates, and risk sentiment. Equity valuations have mean-reverted to their pre-pandemic average of 17-18x earnings.9 But this isn’t necessarily cheap, especially headed into a slowing growth environment that should be very different than the past decade.
The post-Global Financial Crisis interest rate paradigm was one of historically “low for long” interest rates. With real rates at or below zero, valuation multiples expanded broadly, but the decline in the discount rate was felt most keenly in sectors where expected future earnings growth was the highest. Consequently, high-growth segments like technology saw the largest gains.10
Instead, the regime has changed to one in which investors should be prepared for a positive real rate environment for the foreseeable future. Therefore, multiple expansion may not be the sustained driver of equity returns as it was during the last market cycle, as price-to-earnings (P/E) sensitivity to real rates decreases in a positive real rate environment (Figure 3). In other words, because the rates regime has changed during “the dip”, the most beaten-down stocks may not rebound as convincingly.
Figure 3: S&P 500 growth P/E multiples & real rates
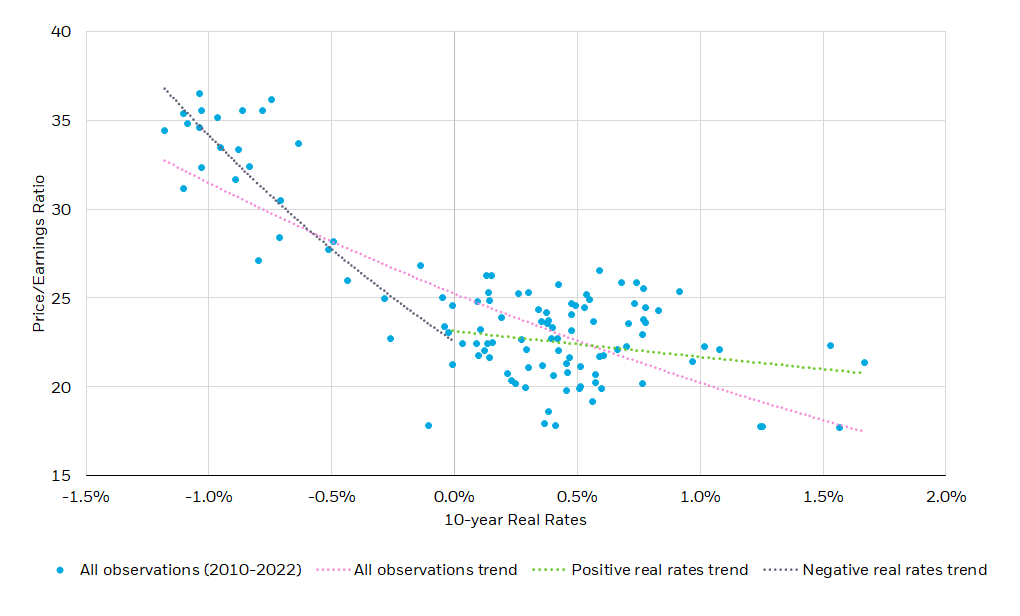
Source: BlackRock, Bloomberg, chart by iShares Investment Strategy. Data as of November 11, 2022. Reference index for price-to-earnings ratio (P/E) is the S&P 500 Growth Index. Reference index for 10-year real rates is the U.S. 10-Year TII Index. Observations are the P/E ratio plotted against 10-year real rates monthly between March 01, 2010, and October 31, 2022. Pink trendline is representative of all observations; black trendline for observations when real rates are negative; green trendline for observations when real rates are positive.
Chart Description: Scatter plot displaying the S&P 500 Growth Index’s price-to-earnings (P/E) ratio from 2010 through 2022 plotted against 10-year real rates. One trendline displays the trend of all observations, which slopes negatively as real rates increase. The positive real rates trendline shows a flatter slope, whereas the negative real rates trend shows a steeper negative slope.
This shifts the focus in equities back to earnings, which ties closely with our fundamental economic outlook. There is further downside risk to household balance sheets as the cumulative effects of inflation and interest rates materialize in lower home prices, decreased spending power, and layoffs. Growth-style equity earnings-per-share (EPS) correlate more with retails sales than value-style equity EPS, presenting greater downside earnings risk in the case of a consumer-led slowdown.11
However, value-style equities tend to provide exposures to the “real economy,” as evidenced by high correlations with industrial production and durable goods orders.12 This means value embodies a mature segment of the overall market – one that is more defensive in nature with higher earnings yields and less sensitivity to the U.S. consumer.13 We believe infrastructure and agricultural producers are two sub-sectors that embody this type of value exposure. Furthermore, the equity risk premium attached to value segments of the market is solidly positive, meaning investors potentially would be compensated for taking on equity risk in an otherwise bleak economic environment (Figure 4).
Figure 4: Growth & value equity risk premium
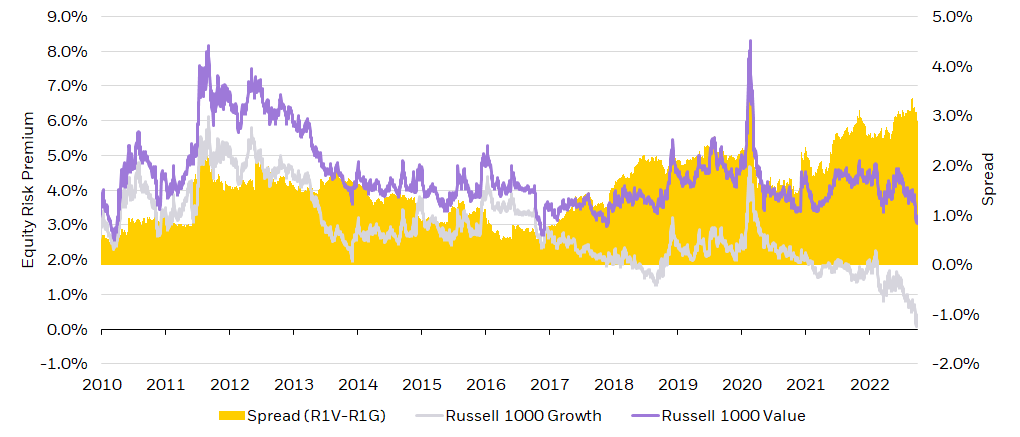
Source: BlackRock, Bloomberg, chart by iShares Investment Strategy. ‘Equity risk premium’ is the difference between the 12-month forward earnings yield (inverse price/earnings) and U.S. 10-Year Treasury yield. As of November 11, 2022.
Chart Description: Area chart displaying the spread between Russel 1000 Growth and Russell 1000 Value equity risk premium. The positive spread shows a larger equity risk premium for value exposures.
For investors who believe that the Fed will be able to engineer a soft landing and are willing to extend equity risk, it may make more sense to look towards small-cap equities rather than growth. Not only do small-caps represent a general post-recession risk-on investment, but they are trading at the largest discount relative to large-cap equities since 2001.14 Furthermore, the shift back towards consumer spending on services and away from goods provides a strong fundamental backdrop to the services economy, to which small-caps tout higher exposure.15 In this context, small-cap equities are better set up from a valuation and fundamental perspective to benefit from the upside risk of a resilient U.S. consumer.
Theme 3: Living With Inflation
The single most important driver of financial markets in 2022 was the trajectory of inflation. This is because persistently above-target levels of inflation pushed the Fed towards a path of significantly higher rates, which drove asset prices down for stocks and bonds alike. While U.S. CPI inflation has decelerated from the 9.1% level seen this summer, we are still far away from Fed’s target of 2%.
In the near term, we believe there are some reasons to expect further normalization in the path of inflation. We expect to see a continued easing of supply chain constraints in the goods sector of the economy. Indeed, the cost of shipping a 40 cubic foot container from Shanghai to LA has declined by 78% from the highs seen in the fall of 2021.16 Additionally, as interest rates continue to rise, the interest rate-sensitive sectors of the economy, such as autos, can continue to see decelerating demand. A rising U.S. dollar can continue to push inflation lower via import prices moving lower.
Yet even in the most optimistic scenario (where inflation only rises on average by 0.2% m/m for the next 12 months), inflation is unlikely to get back to the Fed’s target of 2% y/y, given the continued strength coming from the services category of the CPI market (Figure 5). Shelter inflation, comprising nearly 40% of core CPI,17 will remain high as demand for housing continues to remain elevated and rental prices in the economy are reflected in CPI with a lag. Longer term, geopolitical tensions, deglobalization, and the impact of onshoring production can drive a secular boost to inflation.
Figure 5: Inflation likely to remain elevated
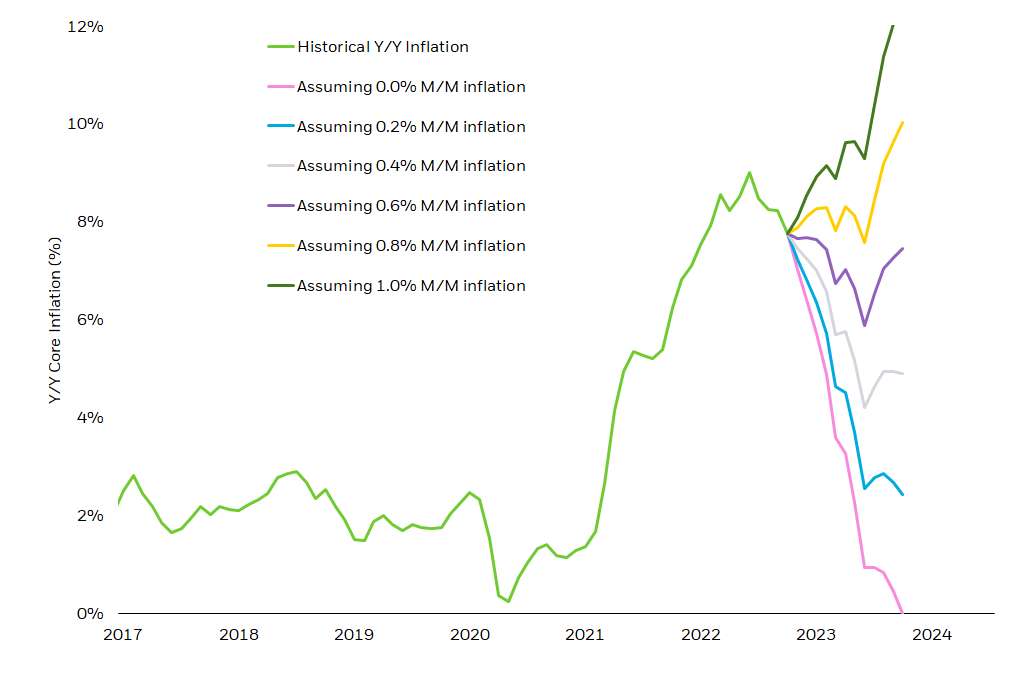
Source: BlackRock, Bloomberg, chart by iShares Investment Strategy. Y/Y core inflation represented by year-over-year core Consumer Price Index. As of November 11, 2022. Forward looking estimates may not come to pass.
Chart Description: Line chart showing historical year-over-year core inflation back to 2017. Several lines extend from the last point of historical CPI and show potential paths of inflation the next CPI prints show consistent 0.0%, 0.2%, 0.4%, 0.6%, 0.8%, 1.0% month-over-month inflation. Even with consistent 0% month-over-month inflation, it will take us until mid-2023 to return to the Fed’s 2% inflation.
For investors, a higher inflationary regime favors owning inflation-linked bonds. After spending a few years in negative territory, TIPS real rates have repriced higher and have regained their role of providing a potential ballast in a multi-asset portfolio (Figure 6). As this paper outlines, TIPS pay investors a principal and a coupon that are tied to CPI inflation. Given our view of higher inflation and stable rates in the months ahead, allocation to TIPS can be a hedge against inflation and a ballast to equities in a portfolio. Flows have recently turned negative in TIPS with investors fleeing the asset class as real rates have risen. After inflows of $40bn in 2021, TIPS ETFs have been in outflow mode in 2022 but we believe that the positive real rate environment will entice investors back in the space in 2023.18
Figure 6: 10-year real rates & cumulative inflation-linked ETF flows
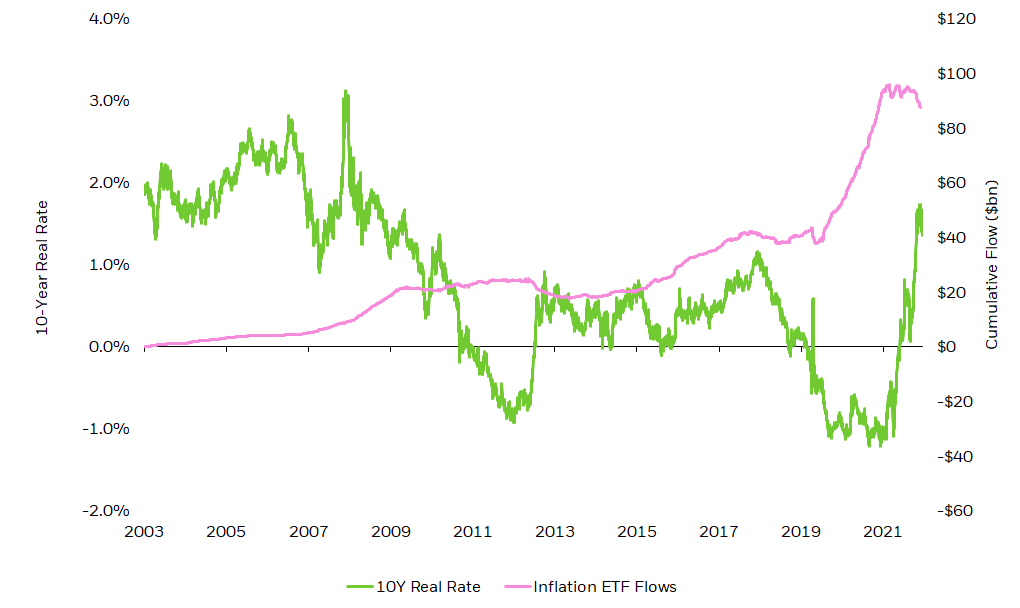
Source: BlackRock, Bloomberg, Markit, chart by iShares Investment Strategy. As of November 11, 2022. 10Y Real Rate represented by US Generic Govt TII 10 Yr Index (USGGT10YR Index). ETF groupings determined by Markit. As of November 11, 2022.
Chart Description: Line graph displaying 10Y real rates and cumulative flows into inflation-linked ETFs, as of 2003. The chart displays inflows into inflation-linked ETFs accelerate between 2019 and now when the 10-year real rate was negative or moving higher.
Investors can also capitalize on the higher inflation theme in equity markets by focusing on infrastructure stocks, which tend to hail from value-oriented sectors like utilities, industrials, and materials. The Infrastructure and Jobs Act directs $1.2 trillion to U.S. infrastructure, which includes 4300 projects that have been announced for 2023. Nationwide, infrastructure enablers from construction to materials could benefit from the spending boom in this space. A higher-inflation regime could lead to the relative outperformance of infrastructure owners, as they often have 10- to 20-year contracts that reset their pricing in parallel with changes in inflation. In addition, they are more often funded by long-term fixed debt that erodes in relative cost as inflation rises. Finally, the services they provide, such as lights, water, and trash collection, are typically less sensitive to recession.
For global investors, increased geopolitical risks and slower structural growth in China suggest taking a modular, flexible approach to EM investing over the medium- to long-term. EM ex-China is well-positioned to benefit from 1) peak Fed expectations and the potential reversal in dollar strength; 2) higher commodity exposures and 3) historically cheap valuations.19
© 2022 BlackRock, Inc. All rights reserved.
1 Source: BlackRock, Bloomberg. ‘Equities’ represented by the S&P 500 Index, ‘bonds’ represented by the Bloomberg U.S. Aggregate Bond Index. ‘Year-to-date’ reference period between January 01, 2022, to October 31, 2022. As of November 11, 2022. For illustrative purposes only. Indexes are unmanaged and one cannot invest directly in an index. Past performance does not guarantee future results.
2 Source: BlackRock, Bloomberg. ‘Equities’ represented by the S&P 500 Index, ‘bonds’ represented by the Bloomberg U.S. Aggregate Bond Index. As of November 11, 2022. Index performance is for illustrative purposes only. Index performance does not reflect any management fees, transaction costs or expenses.
3 Source: BlackRock, Bloomberg. ‘Low-duration, high-quality fixed income bond’ represented by represented by the ICE BofA 1-5 Year U.S. Investment Grade Index. For illustrative purposes only. Indexes are unmanaged and one cannot invest directly in an index. Past performance does not guarantee future results. As of November 11, 2022.
4 Source: BlackRock, Bloomberg, Markit. ETF groupings determined by BlackRock, Markit. ‘Year-to-date’ reference period between January 01, 2022, through November 11, 2022. Data as of November 11, 2022.
5 Note: U.S. Treasury Floating represented by Bloomberg U.S. Treasury Floating Rate Index; U.S. 6-month T-bill represented by ICE BofA U.S. 6-Month Treasury Bill Index; U.S. 1-3Y Treasury represented by ICE U.S. Treasury 1-3 Year Index; U.S. Agg Treasury represented by ICE U.S. Treasury Core Bond Index; U.S. 20+Y Treasury represented by ICE U.S. Treasury 20+ Year Index; U.S. Agg. Bond represented by Bloomberg U.S. Aggregate Bond Index; U.S. MBS represented by Bloomberg U.S. MBS Index; U.S. 1-5Y Corp. IG represented by ICE BofA 1-5 Year U.S. Corporate Index; U.S. Broad Corp. IG represented by Markit iBoxx USD Liquid Investment Grade Index; Emerging Market Debt represented by J.P. Morgan EMBI Global Core Index, U.S. Broad Corp. HY represented by Markit iBoxx USD Liquid High Yield Index; U.S. 1-5Y Corp. HY represented by Markit iBoxx USD Liquid High Yield 0-5 Index.
6 Source: BlackRock, Bloomberg, iShares Investment Strategy. Reference index is the Bloomberg U.S. Mortgage-Backed Security Index. As of November 11, 2022.
7 Source: BlackRock, iShares Investment Strategy. Is another housing bust coming? | iShares – BlackRock. As of November 11, 2022.
8 Source: BlackRock, Bloomberg. Based off the relative index total return between the Russell 1000 Growth Index and the Russell 1000 Value Index between January 01, 2010, and January 01, 2020. Index performance is for illustrative purposes only. Index performance does not reflect any management fees, transaction costs or expenses. Indexes are unmanaged and one cannot invest directly in an index. Past performance does not guarantee future results.
9 Source: BlackRock, Bloomberg. Reference index is the S&P 500 Index. As of November 11, 2022.
10 Source: BlackRock, Bloomberg. Based off the relative index total return of S&P 500 GICS Level 1 Sector Indexes between January 01, 2010, and January 01, 2020. Index performance is for illustrative purposes only. Index performance does not reflect any management fees, transaction costs or expenses. Indexes are unmanaged and one cannot invest directly in an index. Past performance does not guarantee future results.
11 Source: BlackRock, Bloomberg. Reference equity indexes are the S&P 500 Value Index (‘value’) and S&P 500 Growth Index (‘growth’). Reference Index is the U.S. Census Bureau’s Adjusted Retail Sales Index (‘retail sales’). Correlations are between equity index earnings-per-share and economic index monthly levels from January 01, 1995, through October 31, 2022. Data as of November 11, 2022.
12 Source: BlackRock, Bloomberg. Reference equity indexes are the S&P 500 Value Index (‘value’) and S&P 500 Growth Index (‘growth’). Reference Index is the Federal Reserve’s U.S. Industrial Production Index (‘industrial production’) and the U.S. Census Bureau’s U.S. Durable Goods New Orders Index (‘durable goods orders’). Correlations are between equity index earnings-per-share and economic index monthly levels from January 01, 1995, through October 31, 2022. Data as of November 11, 2022.
13 Source: BlackRock, Bloomberg. Reference equity indexes are the S&P 500 Value Index (‘value’) and S&P 500 Growth Index (‘growth’). Earnings yields calculated as 12-month trailing earnings over price. As of November 11, 2022.
14 Source: BlackRock, Bloomberg. ‘Small-cap’ in reference to S&P Small-Cap 600 Index, ‘large-cap’ in reference to S&P 500 Index. ‘Discount’ calculated as the spread between price/earnings for respective indexes. As of November 11, 2022.
15 Source: BlackRock, Bloomberg. ‘Small-cap’ in reference to S&P Small-Cap 600 Index, ‘large-cap’ in reference to S&P 500 Index. Service economy exposure determined by correlations between equity index earnings-per-share and economic index monthly level from January 01, 1995, through October 31, 2022. As of November 11, 2022.
16 Source: BlackRock, Bloomberg. In reference to the WCI Shanghai to Los Angeles Container Freight Benchmark Rate per 40 Foot Box Index. As of November 11, 2022.
17 Source: BlackRock, Bloomberg, Bureau of Labor Statistics. ‘Core CPI’ as defined by Bureau of Labor Statistics. As of November 11, 2022.
18 Source: BlackRock, Markit, Bloomberg. ETF groupings determined by BlackRock, Markit. As of November 11, 2022.
19 Source: Bloomberg, based on the MSCI Emerging Market Index (M1EF Index), as of November 14, 2022.
Carefully consider the Funds’ investment objectives, risk factors, and charges and expenses before investing. This and other information can be found in the Funds’ prospectuses or, if available, the summary prospectuses, which may be obtained by visiting the iShares Fund and BlackRock Fund prospectus pages. Read the prospectus carefully before investing.
Investing involves risk, including possible loss of principal.
Fixed income risks include interest-rate and credit risk. Typically, when interest rates rise, there is a corresponding decline in the value of debt securities. Credit risk refers to the possibility that the debt issuer will not be able to make principal and interest payments.
Non-investment-grade debt securities (high-yield/junk bonds) may be subject to greater market fluctuations, risk of default or loss of income and principal than higher-rated securities.
There may be less information on the financial condition of municipal issuers than for public corporations. The market for municipal bonds may be less liquid than for taxable bonds. Some investors may be subject to federal or state income taxes or the Alternative Minimum Tax (AMT). Capital gains distributions, if any, are taxable.
TIPS can provide investors a hedge against inflation, as the inflation adjustment feature helps preserve the purchasing power of the investment. Because of this inflation adjustment feature, inflation protected bonds typically have lower yields than conventional fixed rate bonds and will likely decline in price during periods of deflation, which could result in losses. Government backing applies only to government issued securities, and does not apply to the funds.
There is no guarantee that interest rate risk will be reduced or eliminated within the Fund.
The Fund’s use of inflation hedging instruments is intended solely to mitigate inflation risk and is not intended to mitigate credit risk, interest rate risk, or other factors influencing the price of investment-grade corporate bonds, which may have a greater impact on the bonds’ returns than inflation. There is no guarantee that the Fund’s positions in inflation hedging instruments will reduce or completely eliminate inflation risk within the fund.
An investment in the Fund is not insured or guaranteed by the Federal Deposit Insurance Corporation or any other government agency and its return and yield will fluctuate with market conditions.
Small-capitalization companies may be less stable and more susceptible to adverse developments, and their securities may be more volatile and less liquid than larger capitalization companies.
Funds that concentrate investments in specific industries, sectors, markets or asset classes may underperform or be more volatile than other industries, sectors, markets or asset classes and then the general securities market.
This material represents an assessment of the market environment as of the date indicated; is subject to change; and is not intended to be a forecast of future events or a guarantee of future results. This information should not be relied upon by the reader as research or investment advice regarding the funds or any issuer or security in particular.
The strategies discussed are strictly for illustrative and educational purposes and are not a recommendation, offer or solicitation to buy or sell any securities or to adopt any investment strategy. There is no guarantee that any strategies discussed will be effective.
The information presented does not take into consideration commissions, tax implications, or other transactions costs, which may significantly affect the economic consequences of a given strategy or investment decision.
This material contains general information only and does not take into account an individual’s financial circumstances. This information should not be relied upon as a primary basis for an investment decision. Rather, an assessment should be made as to whether the information is appropriate in individual circumstances and consideration should be given to talking to a financial professional before making an investment decision.
This material contains general information only and does not take into account an individual’s financial circumstances. This information should not be relied upon as a primary basis for an investment decision. Rather, an assessment should be made as to whether the information is appropriate in individual circumstances and consideration should be given to talking to a financial professional before making an investment decision.
The information provided is not intended to be tax advice. Investors should be urged to consult their tax professionals or financial professionals for more information regarding their specific tax situations.
The Funds are distributed by BlackRock Investments, LLC (together with its affiliates, “BlackRock”).
The iShares Funds are not sponsored, endorsed, issued, sold or promoted by Bloomberg, BlackRock Index Services, LLC, Cohen & Steers, European Public Real Estate Association (“EPRA®”), FTSE International Limited (“FTSE”), ICE Data Indices, LLC, NSE Indices Ltd, JPMorgan, JPX Group, London Stock Exchange Group (“LSEG”), MSCI Inc., Markit Indices Limited, Morningstar, Inc., Nasdaq, Inc., National Association of Real Estate Investment Trusts (“NAREIT”), Nikkei, Inc., Russell or S&P Dow Jones Indices LLC or STOXX Ltd. None of these companies make any representation regarding the advisability of investing in the Funds. With the exception of BlackRock Index Services, LLC, which is an affiliate, BlackRock Investments, LLC is not affiliated with the companies listed above.
Neither FTSE, LSEG, nor NAREIT makes any warranty regarding the FTSE Nareit Equity REITS Index, FTSE Nareit All Residential Capped Index or FTSE Nareit All Mortgage Capped Index. Neither FTSE, EPRA, LSEG, nor NAREIT makes any warranty regarding the FTSE EPRA Nareit Developed ex-U.S. Index or FTSE EPRA Nareit Global REITs Index. “FTSE®” is a trademark of London Stock Exchange Group companies and is used by FTSE under license.
© 2022 BlackRock, Inc. All rights reserved. BLACKROCK, BLACKROCK SOLUTIONS, BUILD ON BLACKROCK, ALADDIN, iSHARES, iBONDS, FACTORSELECT, iTHINKING, iSHARES CONNECT, FUND FRENZY, LIFEPATH, SO WHAT DO I DO WITH MY MONEY, INVESTING FOR A NEW WORLD, BUILT FOR THESE TIMES, the iShares Core Graphic, CoRI and the CoRI logo are trademarks of BlackRock, Inc., or its subsidiaries in the United States and elsewhere. All other marks are the property of their respective owners.
This post originally appeared on the iShares Market Insights
Editor’s Note: The summary bullets for this article were chosen by Seeking Alpha editors.
Be the first to comment