

bennymarty
Bitcoin (BTC-USD) miner Riot Blockchain (NASDAQ:RIOT) is transitioning from a hosted model to a vertically integrated housing and power infrastructure. Rival Marathon Digital (NASDAQ:MARA) is employing an asset light strategy primarily focused on mining rig quantity. As two of the larger and longer standing U.S. based miners, Riot and Marathon make for a natural comparison. Riot is currently winning from a control and production standpoint, while interestingly, Marathon’s use of outside hosting may yield similar costs and a higher theoretical rig count.
The article below begins by considering the current production levels and ties to the two opposing strategies. Further, both companies have presented calculations showing higher theoretical return scenarios than the other, note the next two graphics. In its second section, the article focuses on the details of these strategy arguments and provides context to evaluate the claims.
Riot Blockchain IRR Calculation Supporting Vertical Integration Model
riotblockchain.com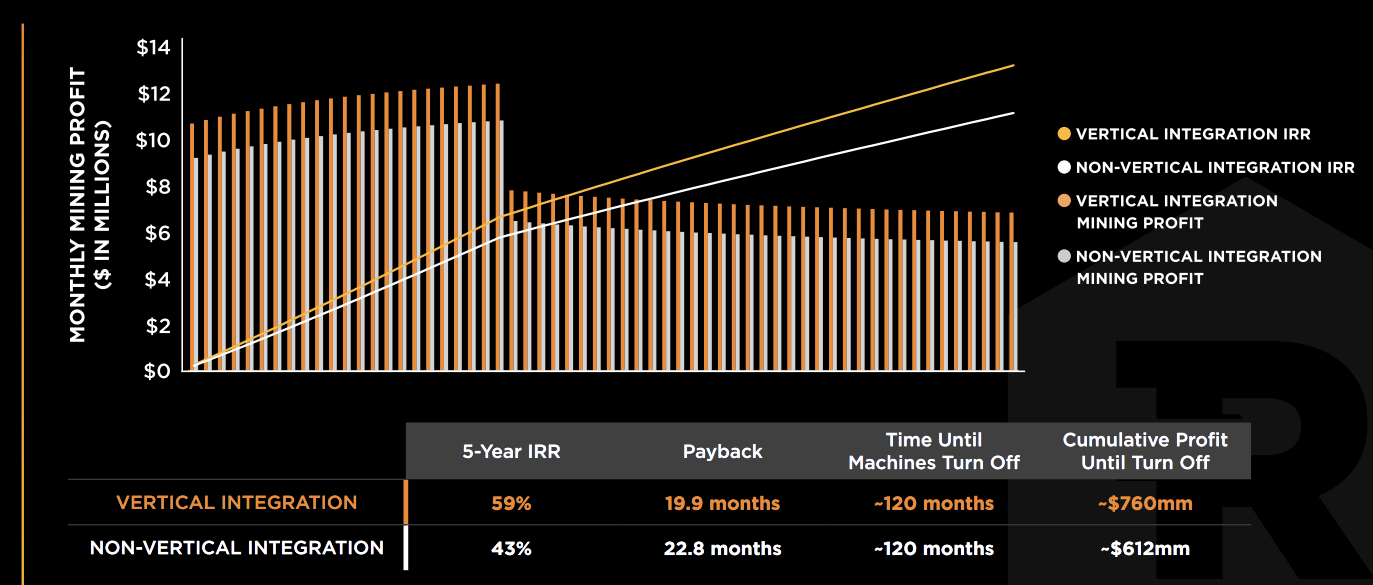
Marathon Digital ROA Calculation Supporting Asset Light Model
ir.marathondh.com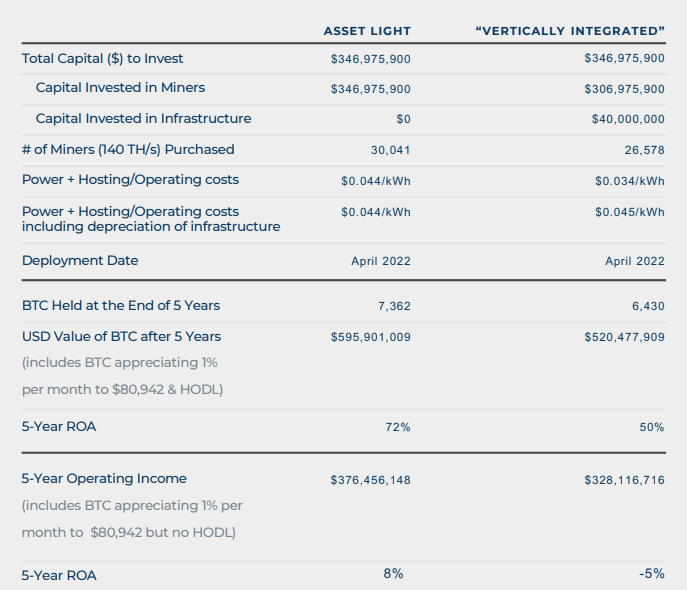
Riot Leading On Control and Production
Thinking back to last summer, I believed Marathon would have twice the deployed and operational hash rate of Riot by Q2 of this year; round number predictions had Riot at 5 EH/s with Marathon at 10 EH/s. Marathon had a meaningfully stronger delivery schedule of new rigs from Bitmain and valuations based on expected future hash rate to market cap favored Marathon.
But as the year unfolded for the mining industry, acquisition of reliable power become the gate to hash rate expansion, as opposed to mining equipment contracts. Energy, as the largest operational component, also become a focus as Bitcoin prices fell and there was a closer look at costs. Though not operating near total capacity due to power issues, note for reference that both Riot and Marathon had just over 4.5 EH/s of computation power deployed at the end of Q2.
| June Production | July Production | |
| Marathon | 140 bitcoins | 72 bitcoins |
| Riot | 421 bitcoins | 318 bitcoins |
Source: Author compiled from riotblockchain.com/investors and ir.marathondh.com
As seen above, Marathon has been operating at a small fraction of deployed capacity due to the reliability of their power source in Hardin, MT. Both recurrent mechanical issues and a recent storm have kept the facility offline. The company has made plans to exit Hardin, though details of those plans appeared in flux on this week’s conference call. Some mining equipment may be sold rather than relocated as was previously expected.
Also affecting Marathon, until this past month the Federal Energy Regulatory Commission had not confirmed the exempt status of the wind farm supplying the Compute North third party hosting facility in West Texas. There is purportedly already almost 4 EH/s of capacity installed and now set to be energized in the coming months at the location. Plus note there is an additional 2.8 EH/s capacity being developed/deployed for Marathon at this location as well.
Though not as drastically, Riot has also been operating below deployed capacity over the last two months due to extreme heat in Texas. July saw production at about 80% as the company voluntarily curtailed over 11,000 megawatt hours during peak demand on the ERCOT grid. Interestingly, Riot estimated that credits from curtailment totaled $9.5 million and easily outweighed the value of the lost production of bitcoins, see below.
riotblockchain.com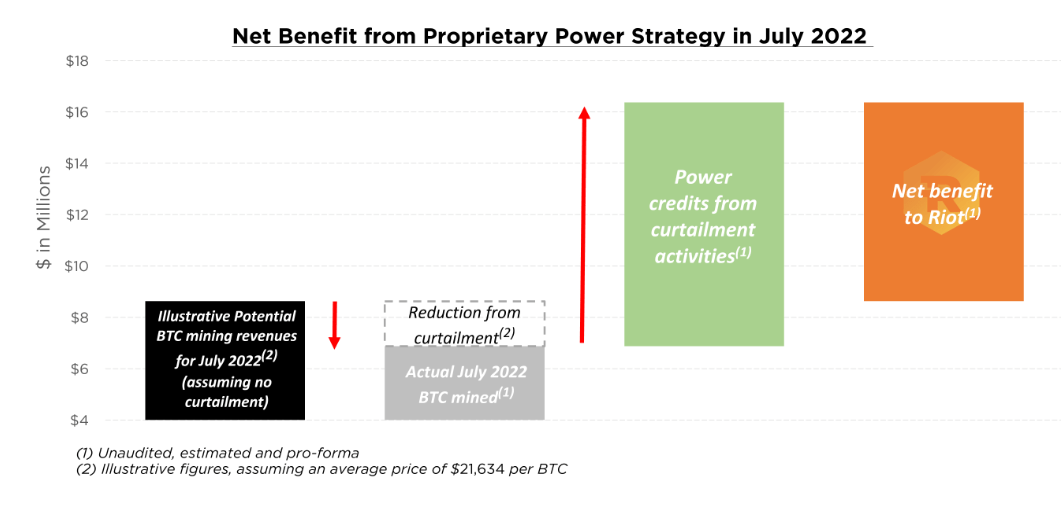
Riot forwards numerous “control” benefits from their strategy of vertical integration. Four of these closely relate to the production situation above.
- Supplier Risk – No reliance on third-party hosting providers, limiting counter-party risk
- Execution Risk – Control over infrastructure development timelines to match deployment schedule of miners
- Security Risk – 24/7 on-site monitoring of cyber and physical operations
- Financial Risk – If desired, infrastructure affords an alternative financing source with a substantially lower cost of capital than miner financing
Source: Riot Corporate Presentation, riotblockchain.com/investors, 6/16/22
When looking at supplier and execution risks, Riot has greater control of infrastructure development and likely continues to show an advantage over host dependent Marathon in meeting hash rate guidance and timelines. Marathon’s production woes may be reversing now that the tax issue is resolved in Texas and note the company is now projecting it reaches its 23 EH/s goal in the middle of next year. But from my perspective, there remains a high level of uncertainty, with the risks to the downside of this guidance for future operational hash rate.
For Riot’s part, they are estimating over 12 EH/s of hash rate by January. More interestingly, in April the company announced a large power supply expansion in Navarro County, Texas. The first phase is a 400 MW buildout capable of housing 16 EH/s of capacity if using the latest, high efficiency Bitmain S19XP equipment. Mining operations are estimated to begin in July of next year.
Riot has made necessary supplier acquisitions and has a track record of execution with the progress shown at the 400 MW expansion of their Whinstone facility in Rockdale, TX. Compared to Marathon’s likely hosting arrangements, Riot has the larger, more certain power capacity looking out over the next year. With power supply rather than rigs now being the primary gate to hash rate expansion, Riot deserves a higher valuation than Marathon in expected future hash rate to market cap models.
Costs and Rig Count Models Compared
On costs it is difficult to make apples to apples comparisons between Riot, Marathon and the other mining companies. Part of the difficulty relates to precisely placing what each company is and should be including in the various cost buckets. For this limited discussion, I am specifically considering the costs covered in the two models show in the introduction above, as well as the company reported “cost of revenues” for mining, exclusive of depreciation. Note for Riot the calculations will be after “eliminations”, which may be somewhat thorny.
Also of importance, both companies costs of revenues per coin are widely fluctuating because their operations are meaningfully growing and substantially changing in physical layout, power supply, and organization. For example, Marathon recognized unusual costs in the second quarter related to their accelerated exit from Hardin, MT. And Riot is moving out of New York to its Rockdale, Texas facility to reduce electricity costs and eliminate third-party hosting fees.
Note two final limitations to the discussion below. First, while SG&A and capital expenses are not directly attached to cost of revenues, the different strategies do impact these segments differently and a more full picture would require a look at indirect costs and balance sheet effects. Second, when looking at costs of revenues per coin mined in the coming year, bear in mind production yields and costs relative to hash rate will be highly sensitive to the mix shift in equipment to the quick, efficient Bitmain S19XP rigs.
Marathon’s Comparison Of Strategies
marathondh.com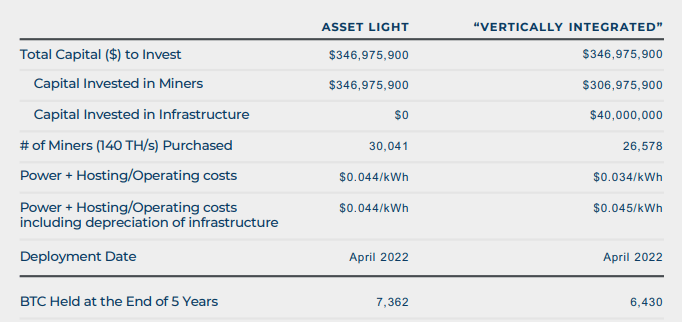
Marathon is represented in the Asset Light column above and Riot in the Vertically Integrated column. During Q1 Marathon was paying $0.042 per kWh for electricity and hosting combined. Cost of revenues per bitcoin mined came to $6,249 during the period. The Marathon model has approximately equivalent costs for both strategies. But importantly, note the asset light strategy could theoretically deploy a meaningful 15% more rigs with the same capital expenditure.
Riot’s Comparison Assumptions
riotblockchain.com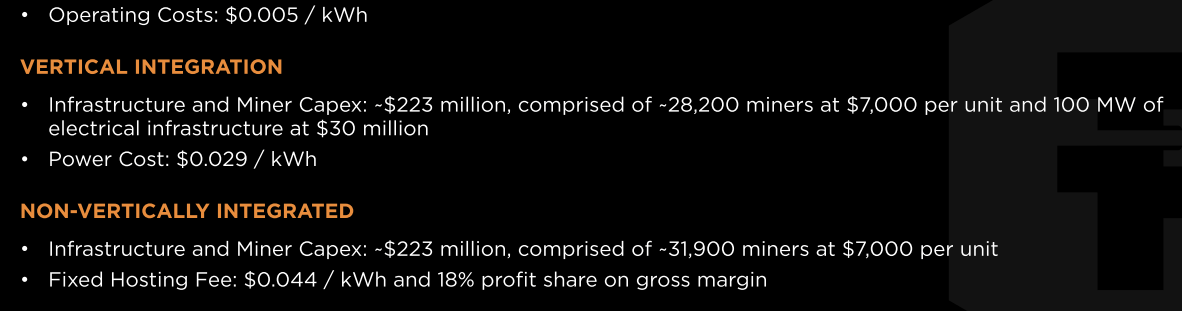
Riot’s calculation also has the “vertical integration” costs at $.034 per kWh. This breaks out to Riot’s $.029 per kWh in electricity costs and $.005 per kWh equivalent operating costs. In Q1 Riot’s cost of revenues per bitcoin mined came to $13,590. These relatively high costs were tied to the hosting fees at the NY facility from which Riot is now transitioning and are not indicative of costs going forward. In Riot’s calculation, the asset light model is able to deploy about 13% more rigs.
Differences Swing Outcomes
The Marathon model computes a marginally stronger ROA for the asset light model while the Riot calculation has a better IRR for the vertically integrated strategy. Differences in design and assumptions drive this divergence. Two larger assumption differences are:
- Marathon’s model includes infrastructure depreciation equivalent to $.011 per kWh. This is marginally unfair to Riot as no rig depreciation is included.
- The Marathon model does not include the 18% profit share incorporated in the Riot model under the asset light costs. Around the time the models were prepared, Marathon was profit sharing at 18% on at least a portion of their deployed equipment.
On Marathon’s recent conference call the company stated they had again renegotiated hosting costs and would no longer have a profit sharing component. The upshot being we should expect higher electricity costs, though the exact pricing has not been provided. And a last note, the models use $.005 per kWh equivalent operating costs under Riot’s vertically integrated strategy. This number may prove optimistic as other large, efficient mining companies face closer to $.01 per kWh equivalent operating costs.
Both companies are markedly changing their operations. Costs will settle in over the coming quarters, but for now a general takeaway points to similar costs for both models. For the same investment, Marathon can deploy a larger theoretical hash rate from a rig perspective. However, recall from the first section above that power supply is now the primary gate to hash rate expansion. From my perspective this somewhat reduces the asset light strategy benefit.
Ratings
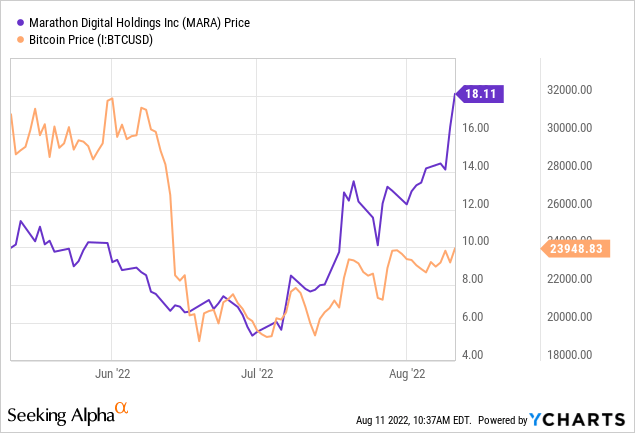
In May I rated Marathon Digital a buy on its coming production reversal and apparent overcorrection in valuation. The stock is now up 90% while BTC-USD is down 15%. So here I am shifting to a hold rating which is indicative of an expectation that the stock will market and industry perform.
I have not recently rated Riot Blockchain and here am providing a hold rating that is also indicative of an expectation that the stock will market and industry perform. Riot is definitely to be watched, especially as cost data is provided post the exit of their hosting arrangement in New York. Though Marathon was not my top pick among the miners, over the past year I have held a preference for it over Riot. This preference has changed as Riot’s vertical integration strategy with greater control is proving more effective than Marathon’s hosting dependent strategy.
My new marketplace service is coming soon! Complete Crypto Analytics is launching in the near future and will have an in-depth, dedicated Bitcoin miner comparison feature. Please keep reading my articles here for updates so you can reserve your spot as a Legacy Discount Member! There will be a generous introductory price for early subscribers. Thank you for following my work.
Be the first to comment