

SylvieBouchard
Thesis
Investors face two major risks: valuation risks (paying too much for a wonderful business) and quality risks (buying a horrible business even at a cheap price). Valuation risks dominated the market not that long ago (even at the beginning of 2022), and recent market corrections have normalized valuations. Take the payment sector as an example. The next chart shows that the leading stocks, Visa Inc (V), Mastercard (MA), and PayPal (NASDAQ:PYPL), have all suffered large corrections. V and MA prices suffered more than 18% of price declines in the past year. Combined with their earnings growth, their valuations in terms of FW P/E have contracted from the 40x+ (about 42x for V and 48x for MA) level a year ago to the current level of about 30x. Still not cheap, but a lot more reasonable.
Against this backdrop, PYPL, the main topic for today, has undergone an even more drastic swing. In less than a year, it has turned from a Wall Street darling that people are willing to pay ~80x+ P/E to get into an ugly duck that people are afraid to touch at 18x P/E now. Investors’ current fear, in a nutshell, boils down to five words: is it a value trap?
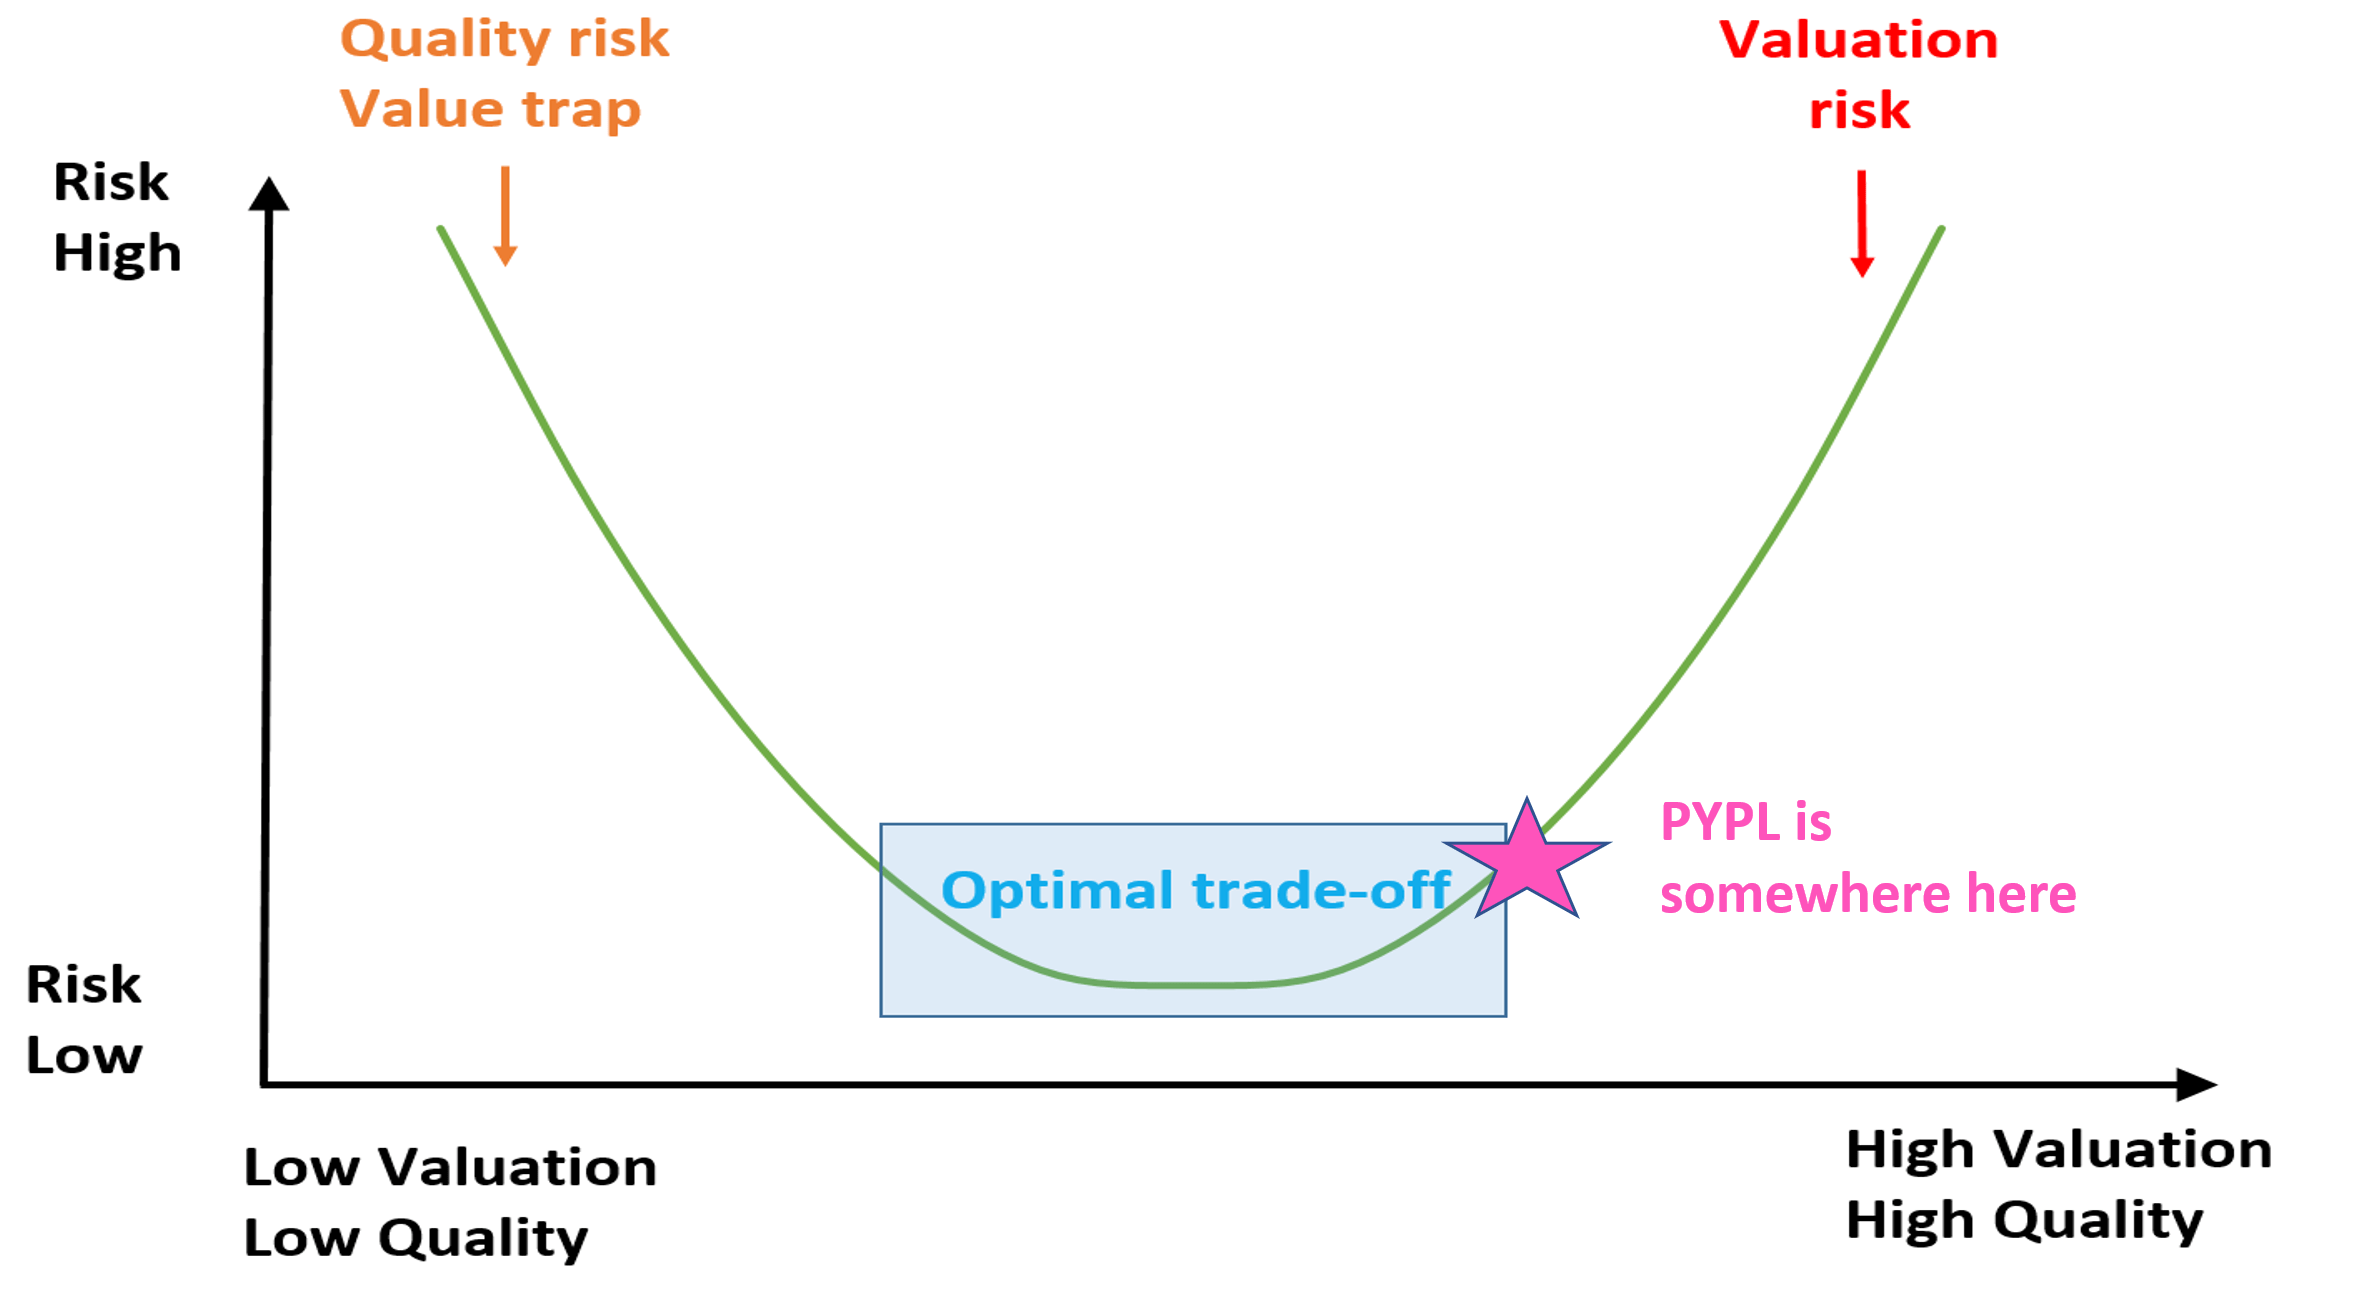
And the thesis of this article is to show why my answer is no. As shown in the second chart, my view is that it actually provides a quite optimal combination of value and profitability under the current conditions. And let’s dive in.
Seeking Alpha Author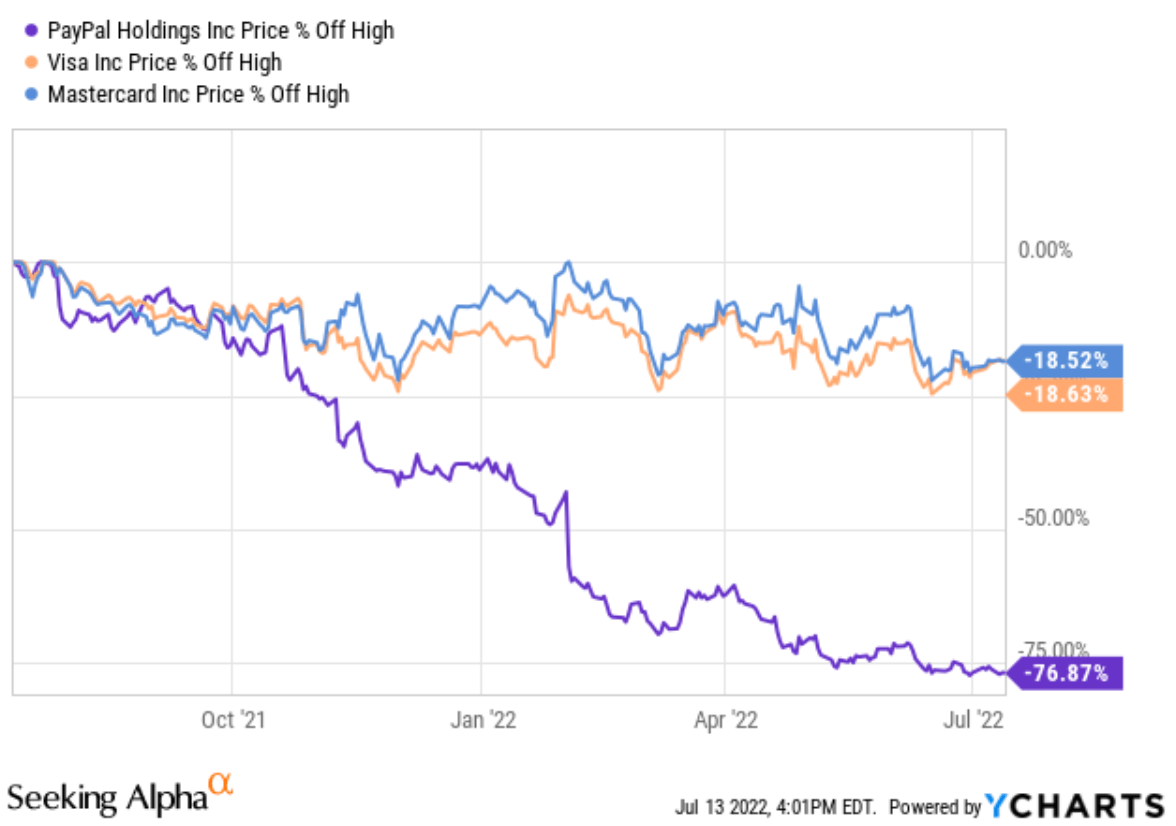
PYPL profitability examined by Fama French
We will take a more macroscopic approach here following the Fama French method. For readers interested in a more microscopic level discussion of its specifics, I’ve written a few articles in the past on its return on capital, competitive landscape, owners’ earnings, and also the implications of its loss of the eBay account.
The background of the Fama French has been provided in our earlier article on Apple here. A brief recap is provided here for ease of reference:
The method is named after Eugene Fama and Ken French. In 2013, Eugene Fama shared the Nobel Prize in economics with Lars Peter Hansen and Robert Shiller for their work on asset prices. The Fama French method is considered a significant improvement over the CAPM method because it adjusted for outperformance tendency.
The raw data used in this article were pulled from the Dartmouth Tuck Business School database. We then analyzed the raw data using a simplified version of the Fama French method.
The following two charts show two of PYPL’s factors (operation profitability and valuation) compared to the general market. Past results have shown that these two factors have truly held up over all time periods.
- The OP factor (Operating Profitability). The operating profitability factor in period t is defined as the operating income divided by the sum of book equity and minority interest for the last fiscal year ending in time period t-1.
- The P/E factor (the Price/Earnings ratio). The P/E factor is based on total earnings before extraordinary items, from Compustat.
PYPL’s scores on these two factors are shown below. The first chart shows the OP factor of PYPL compared against all the other stocks in the market by percentile. As you can see, PYPL is definitely a highly profitable business. Its average OP is around 17.6% since 2018, close to the 50th percentile of the general economy. But do not be under-impressed, as OP can be misleading. As argued in my free blog article, ROCE is a better and more universal metric than OP (which in essence is a variation of ROE). Measured by its ROCE (return on capital employed), its profitability is on average 58% since 2018, close to the top 10 percentile. The ROCE for the overall economies is about 20% on average in the long-run as shown by the green line in the chart. To provide an even more telling comparison, the average ROCE of the overachievers in the FAAMG pack is about 60%.
Author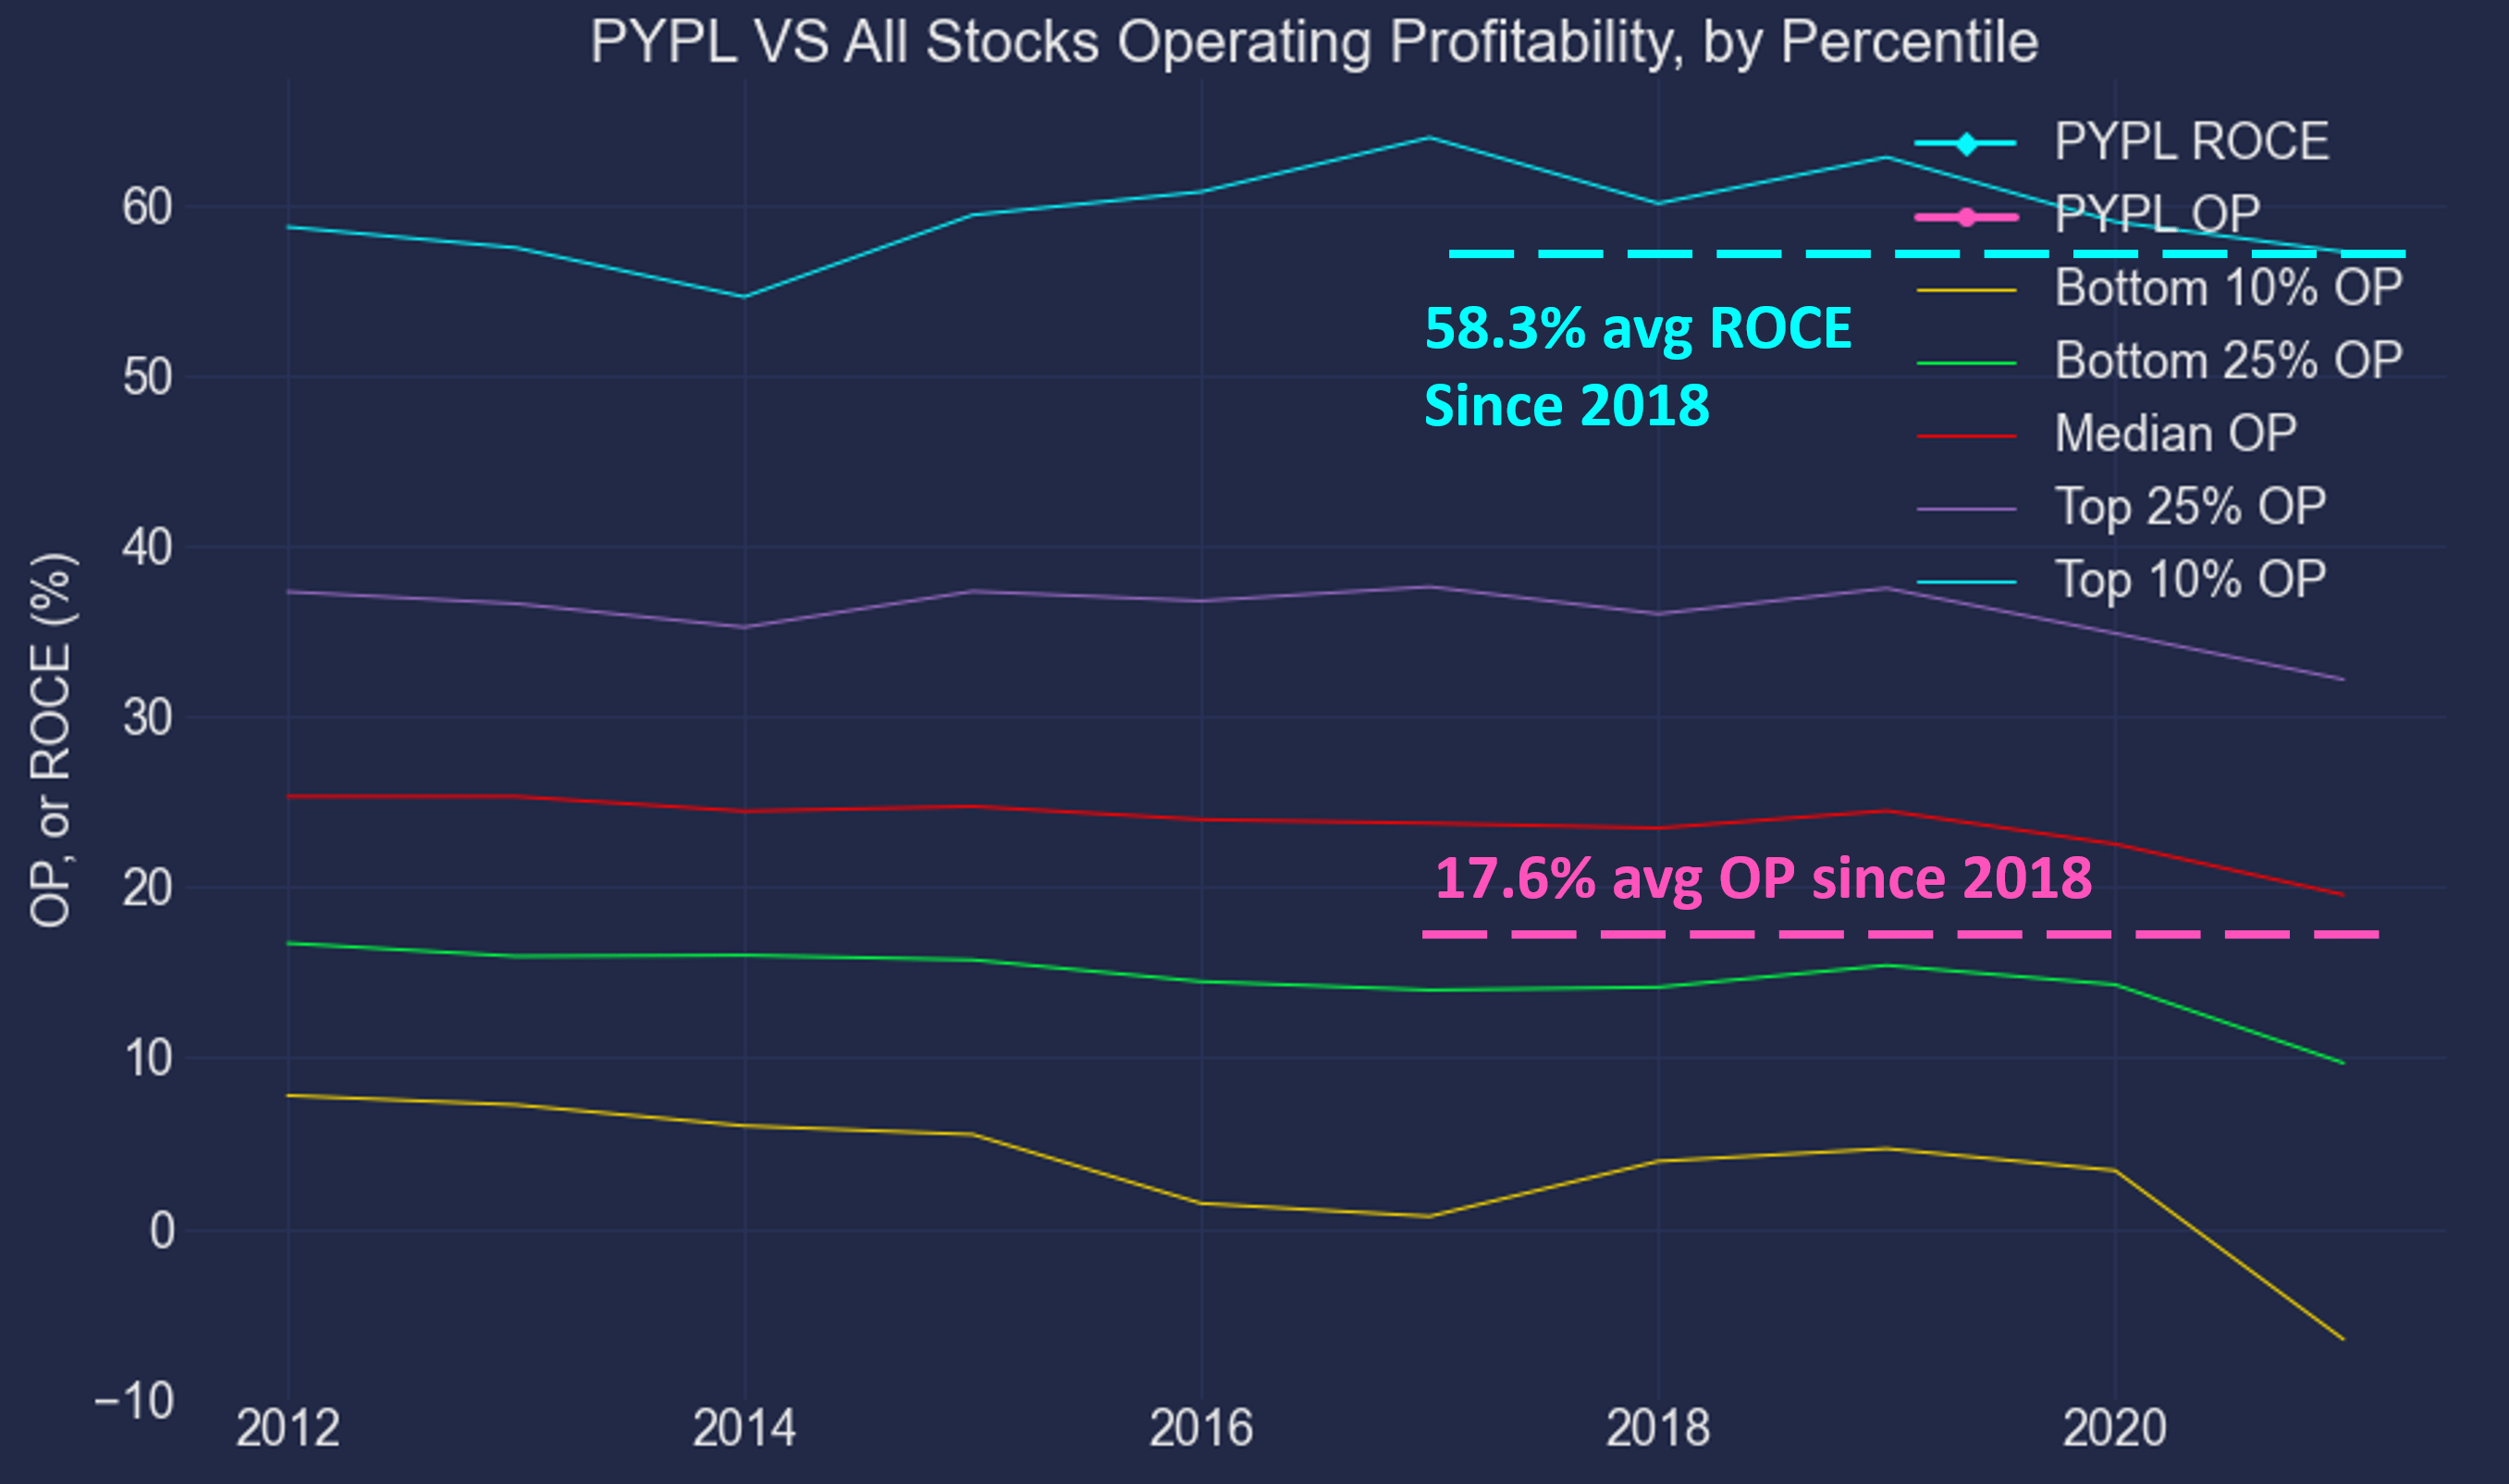
PYPL valuation examined by Fama French
Now moving on to the valuation factor, the next chart shows PYPL’s P/E factor compared to the overall market, again also in percentile.
To me, this chart really illustrates the power of having a bigger picture and following a top-down approach. Take its peak valuation during mid-2021 as an example. As you recall from the previous chart, its profitability is undoubtedly strong, close to the top 10 percentile as measured by ROCE. But its 88x P/E was just absolutely off the chart.
Now the sentiment pendulum has swung from the greed extreme to the fear extreme. Its current FW P/E is about 18x. And as you can see, it’s below the market median. Its valuation is actually near the mid between the 25 bottom percentile and the 50 bottom percentile, in stark contrast to its profitability (which is close to the top 10 percentile).
Author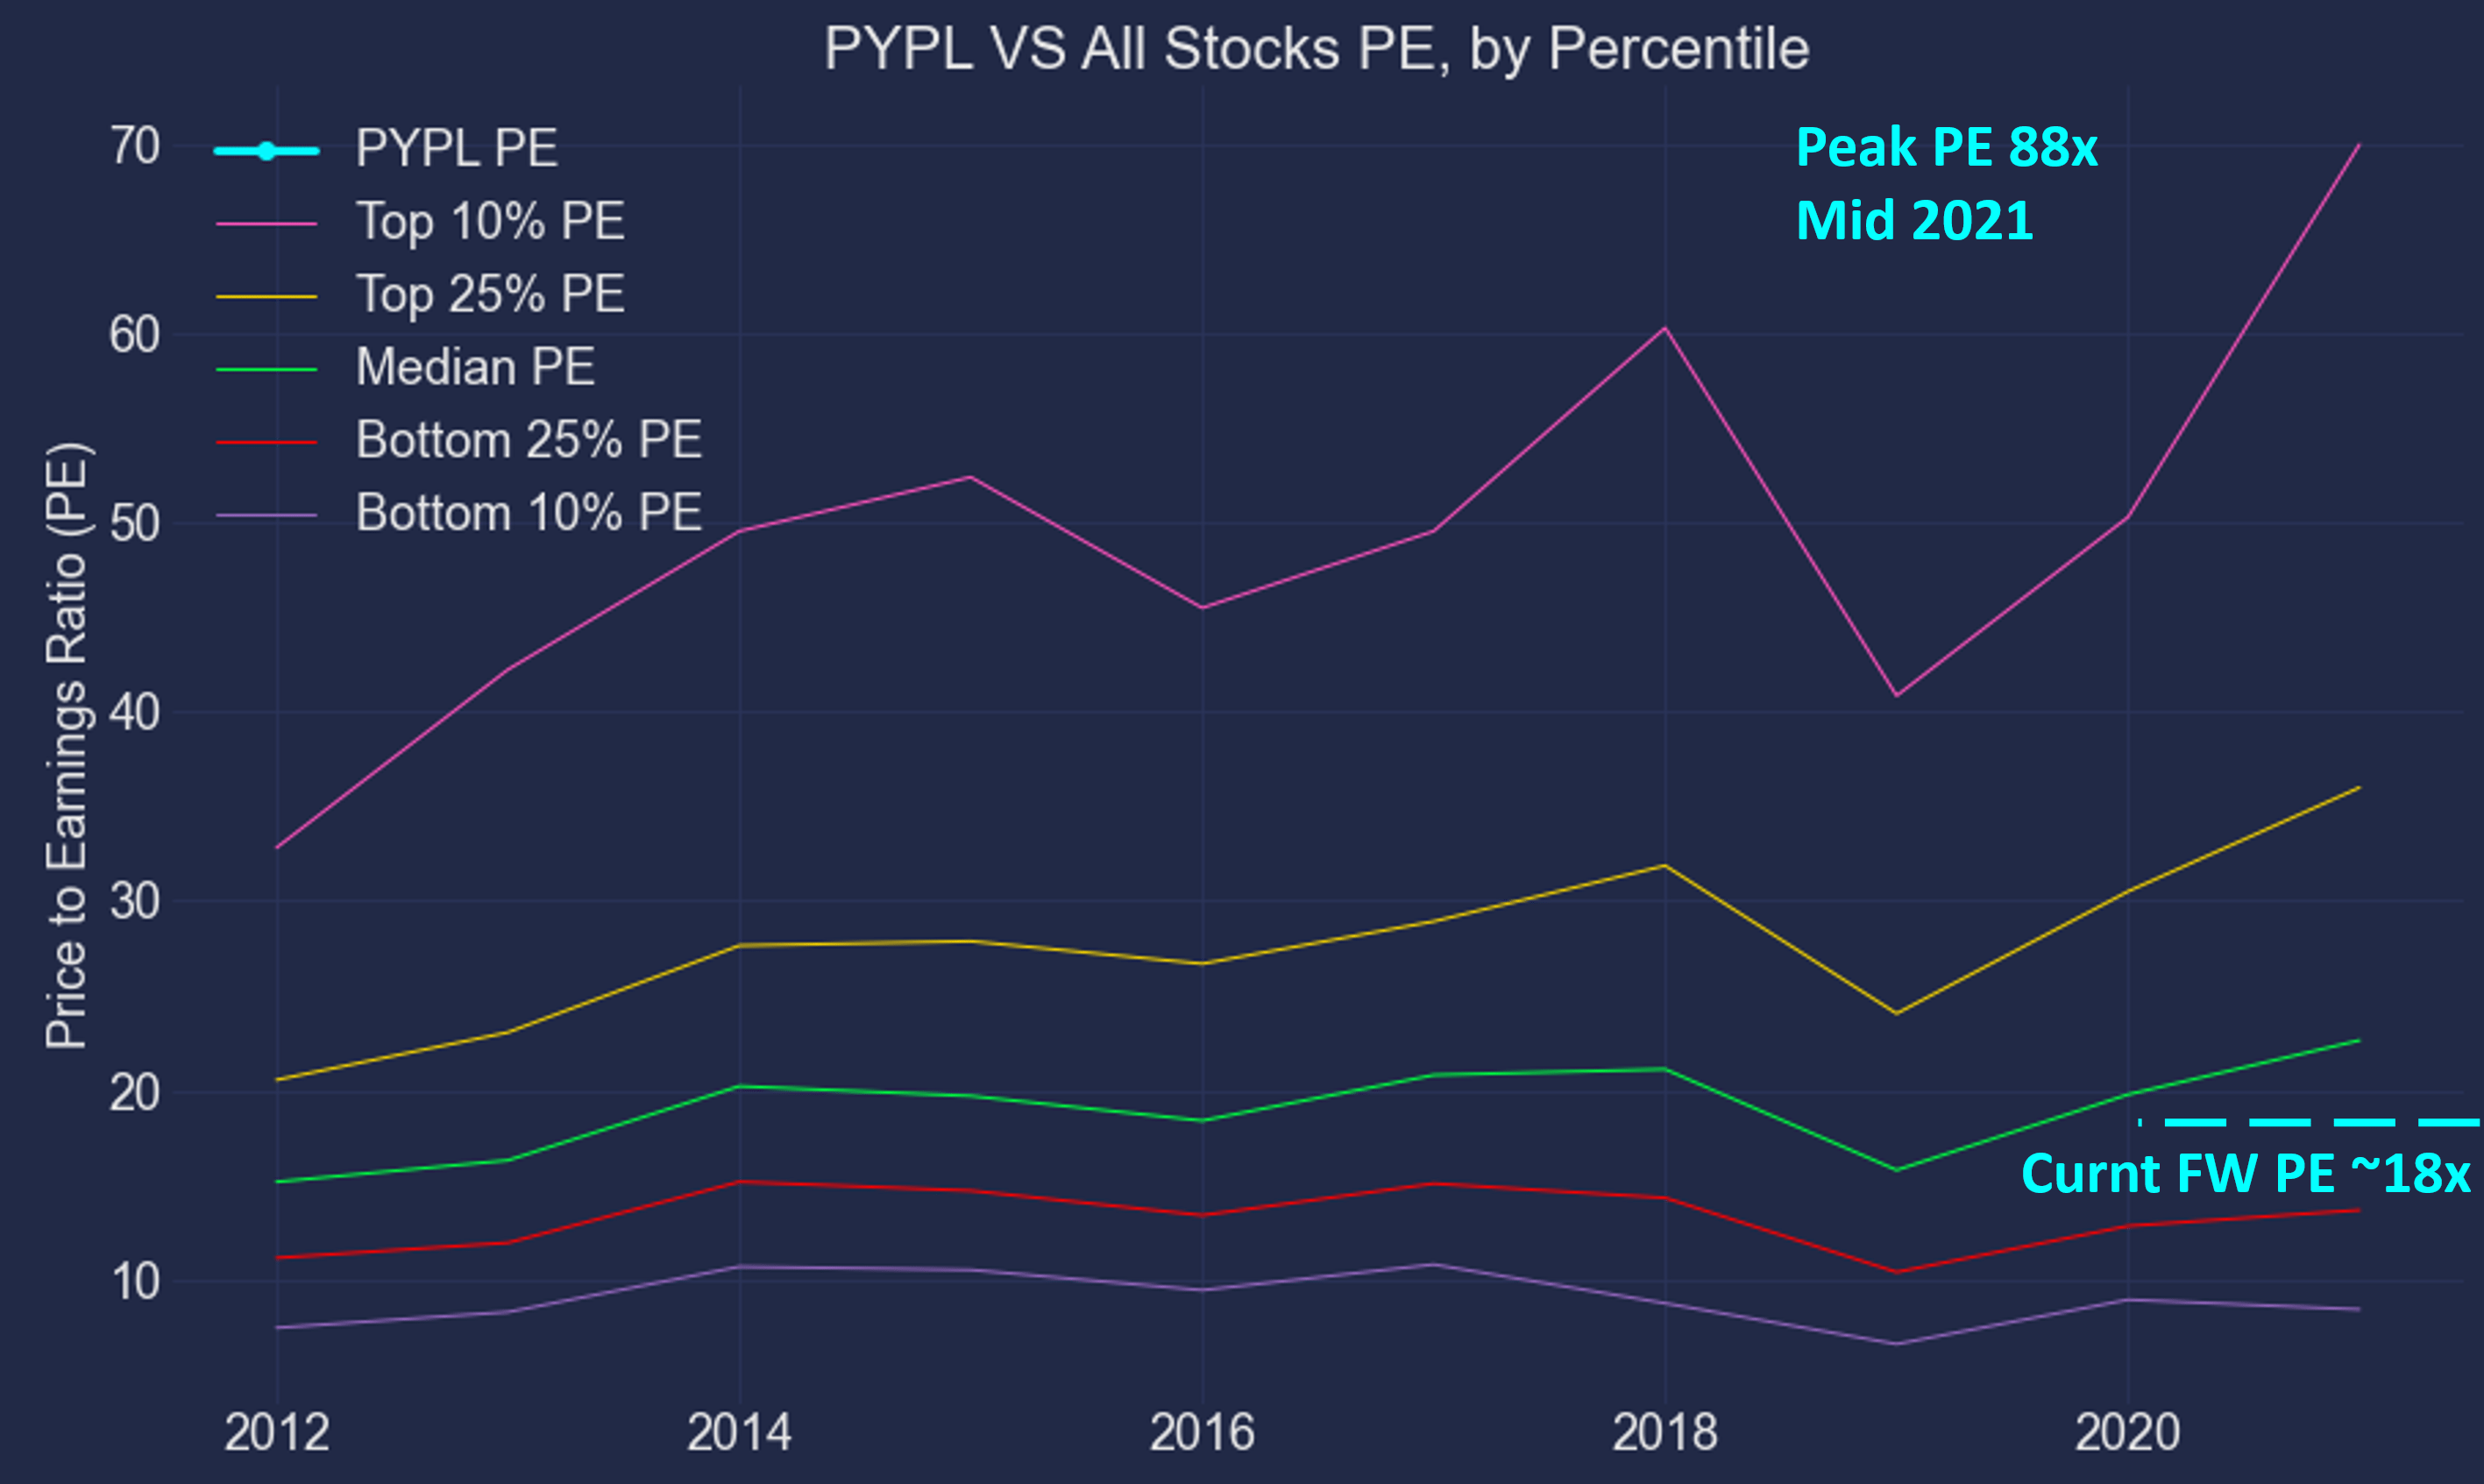
Business outlook
As such, I do not see PYPL as a value trap. What I see is a highly profitable business currently dominated by market fear. Its platform is still among the most popular payment methods, and users still love using PayPal (this author’s family is a good example). It just ended Q1-22 with 429 million active accounts, up 9% YoY. It added 2.4 million net new active accounts in that quarter, primarily driven by Venmo. The business is confident to keep adding new users and forecasting 10 million net new active accounts this year, as CEO Daniel Schulman commented (abridged and emphases added by me)
- The business is now forecasting 10 million net new active accounts this year for the year. We expect to add positive NNAs to our platform every quarter this year, with Q2 representing the low point.
- For the second quarter, we expect revenue growth of approximately 9% and non-GAAP EPS to be approximately $0.86.
- For the year, we now expect 11% to 13% revenue growth and non-GAAP EPS to be in the range of $3.81 to $3.93. Ex eBay, this represents revenue growth of approximately 15% to 17%.
PYPL earnings report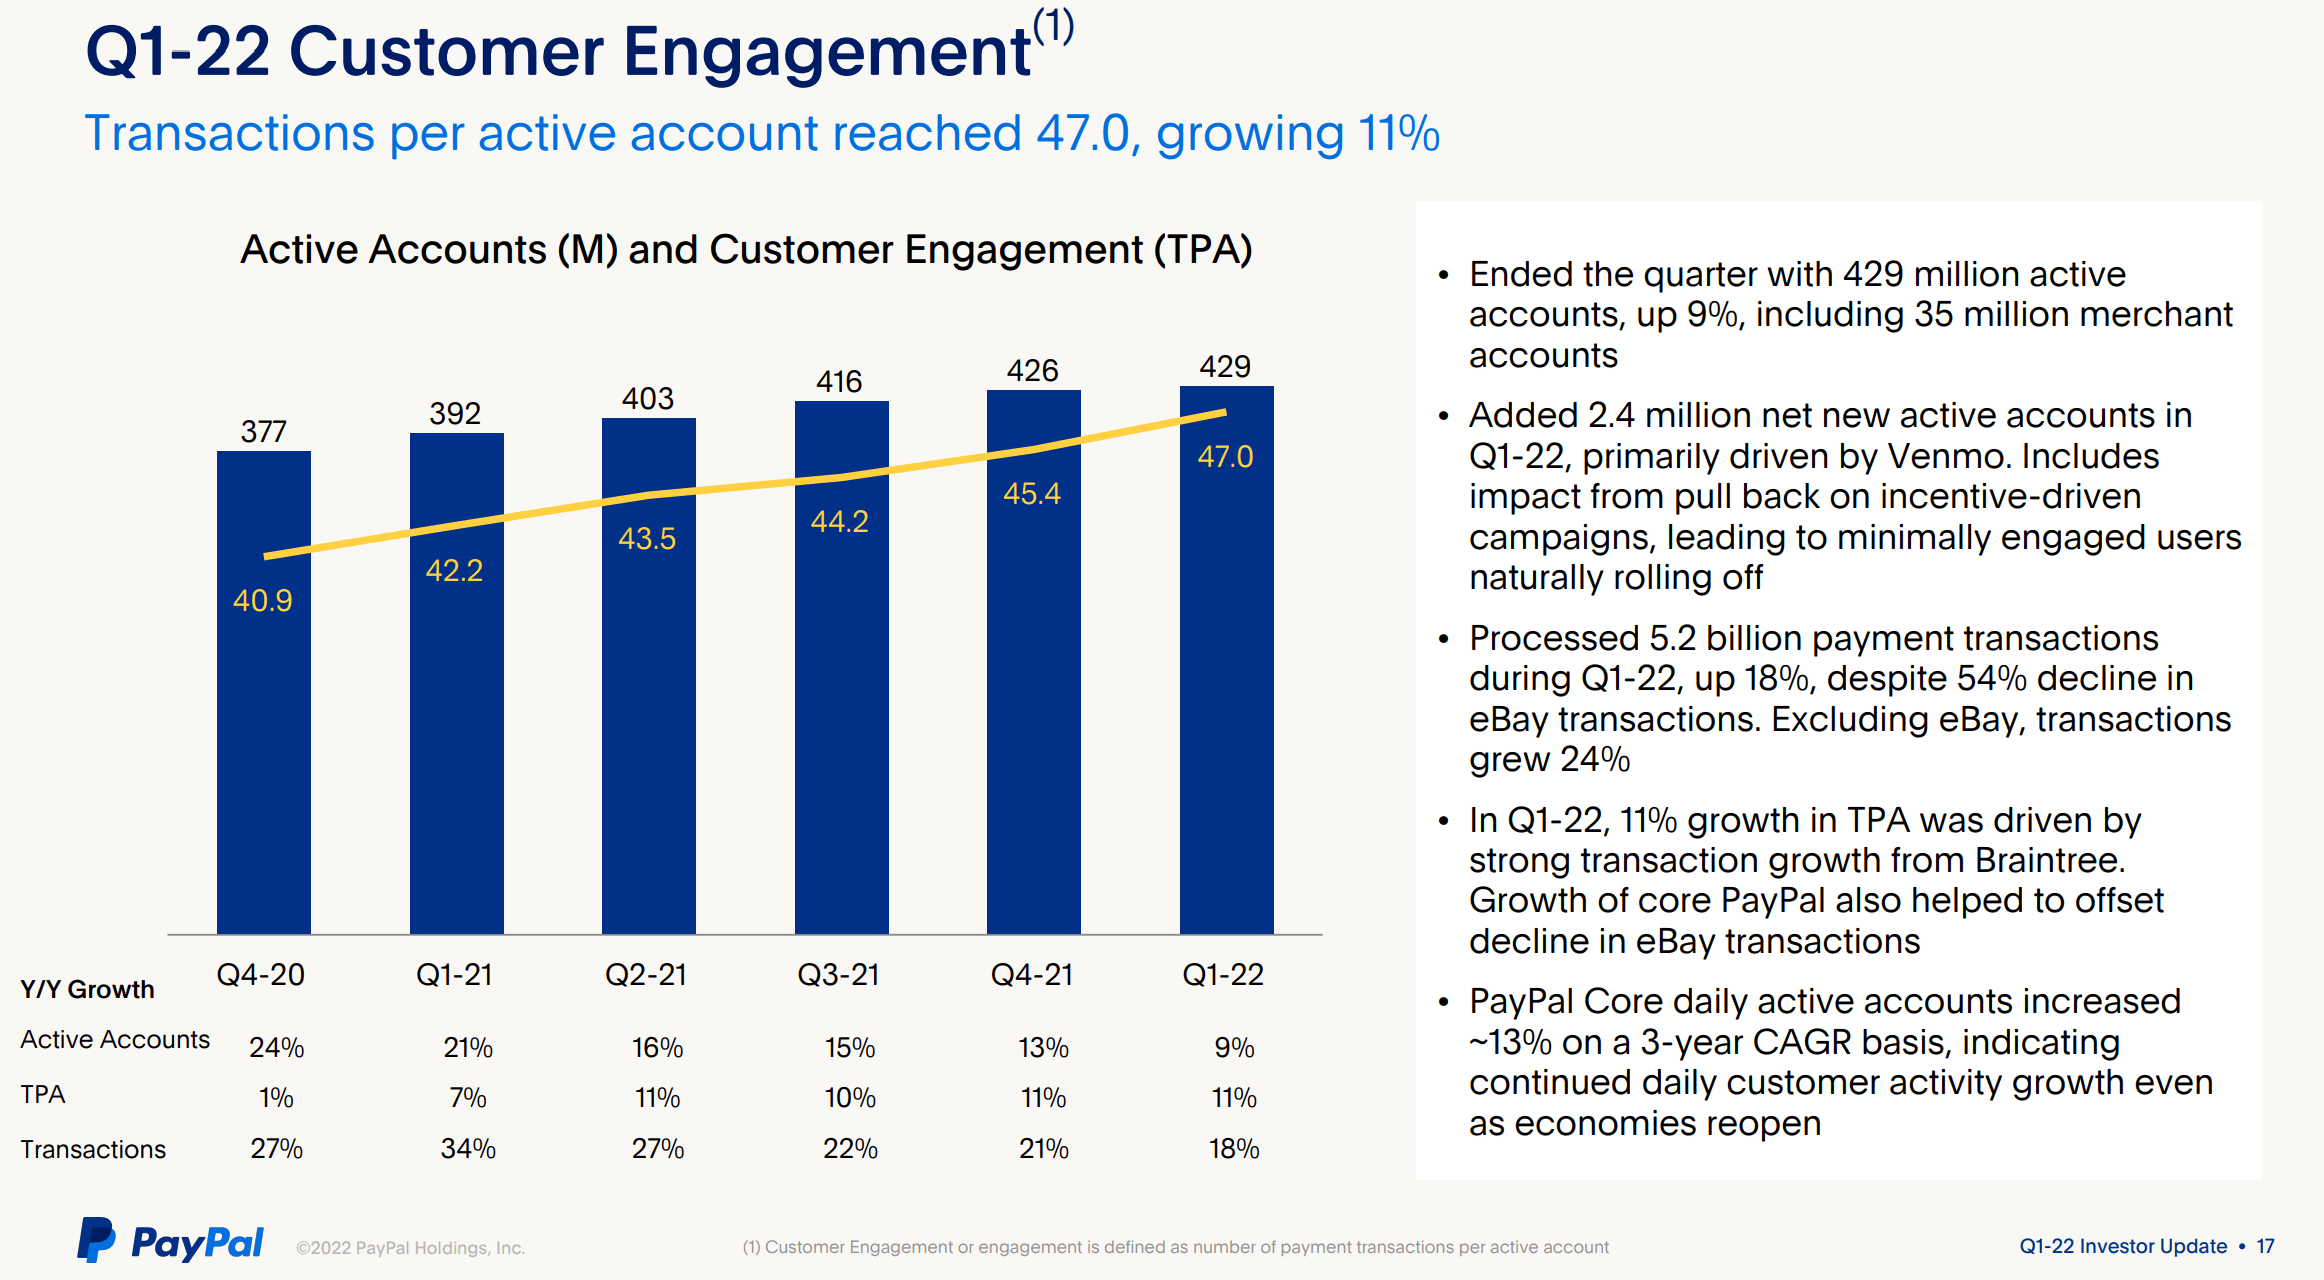
Final thoughts and risks
Air always rushes out of a bubble more rapidly than it goes in. In less than a year’s time, PYPL has turned from a darling that investors are willing to chase with 80+ P/E to an ugly duck that investors are afraid to touch even at 18x P/E now. However, I do not see a value trap here. What I see is a highly profitable stock (with its 58% ROCE rivaling the FAAMG pack) selling substantially below market average valuation because of market overaction.
Finally, risks. there are certainly risks both in the long term and short term. In the longer term, the FinTech evolution will keep providing unpredictable challenges and opportunities as detailed in my earlier articles. In the near term, the following comments from its CEO Daniel Schulman sum up the risks that have led to lower guidance for Q2 and 2022 full year (abridged and emphases added by me):
While we are pleased that we delivered Q1 with a beat on revenue and EPS, 2022 remains another challenging year to forecast… It is clear that relative to early February, the macro environment has deteriorated. Russia, Ukraine and China are contributing to increased global uncertainty and incremental inflationary and supply chain pressures. And more specific to PayPal, forecasting normalized consumer e-commerce spending, as we come out of the pandemic, is exceedingly complex. As a result, we believe it is prudent to lower our 2022 guidance and reevaluate our medium-term outlook.
Be the first to comment