


FrozenShutter
Introduction
Disney appears to be a company struggling with no consistent growth story. Fundamentals over the last five years have proven to be mixed, while the technical analysis shows negative stock price declines. Moreover, there appears to be no sign of reversal for recovery in stock price. Even though Disney is a well-diversified company, it seems to be challenged for quite some time.
Fundamental are mixed with no trend of growth
Ratios
Disney has shown some growth within its current ratio, where 2020 was its peak but since has been in decline. The recent pandemic must have been a factor in Disney World’s operations due to the lack of tourism. There are also similar patterns for quick ratio, with it peaking in 2020.
|
Metric |
2018 |
2019 |
2020 |
2021 |
2022 |
|
Period |
FY |
FY |
FY |
FY |
FY |
|
Current ratio |
0.942 |
0.897 |
1.324 |
1.083 |
1.001 |
|
Quick ratio |
0.755 |
0.667 |
1.150 |
0.944 |
0.835 |
|
Cash ratio |
0.232 |
0.173 |
0.673 |
0.514 |
0.400 |
Source: Financial Modelling Prep
Growth
Disney’s initial pandemic year had negative revenue growth but has become more robust this year. Weaker profit growth seems expected for 2022. All in all, it is quite a mixed story
|
Metric |
2018 |
2019 |
2020 |
2021 |
2022 |
|
Period |
FY |
FY |
FY |
FY |
FY |
|
Revenue growth |
0.078 |
0.171 |
-0.060 |
0.031 |
0.227 |
|
Gross profit growth |
0.076 |
0.032 |
-0.219 |
0.036 |
-1 |
|
EBIT growth |
0.069 |
-0.201 |
-0.680 |
-0.036 |
-0.029 |
|
Operating income growth |
0.069 |
-0.201 |
-0.680 |
-0.036 |
-0.029 |
|
Net income growth |
0.403 |
-0.123 |
-1.259 |
1.697 |
0.576 |
|
EPS growth |
0.466 |
-0.205 |
-1.237 |
1.696 |
0.564 |
Source: Financial Modelling Prep
Data
2022 has not been a great year for many stocks, including Disney. As the US primary market indices seemed to be recovering from a solid negative year, Disney still needs to show growth with its simple moving average over the last 20 to 200-day periods.
|
Metric |
Values |
|
SMA20 |
-4.54% |
|
SMA50 |
-6.32% |
|
SMA200 |
-16.80% |
Source: FinViz
Enterprise
Because of Disney’s poor stock performance, it is historically the lowest it has been over the last five years. Even market capitalization has shrunk somewhat compared to the previous year in 2021.
|
Metric |
2018 |
2019 |
2020 |
2021 |
2022 |
|
Symbol |
DIS |
DIS |
DIS |
DIS |
DIS |
|
Stock price |
114.760 |
130.530 |
120.130 |
170.190 |
106.540 |
|
Market capitalization |
172.025 B |
216.158 B |
217.195 B |
309.065 B |
194.649 B |
Source: Financial Modelling Prep
Estimate
One benefit of forward guidance is to see how confident a company can be as it predicts its future growth over the next five-plus years. Unfortunately, Disney has conservatively predicted small growth with flat-line earnings per share. As a result, Disney appears to be underperforming over the next few years compared to other high-performing stocks. This is especially true with only a 20% forecast in its revenue up to 2025. As you can see, there is no forecast for 2026 or 2027.
|
YEARLY ESTIMATES |
2022 |
2023 |
2024 |
2025 |
2026 |
2027 |
|
Revenue |
84,417 |
91,615 |
98,109 |
103,746 |
– |
– |
|
Dividend |
0.19 |
0.39 |
1.25 |
1.80 |
– |
– |
|
Dividend Yield (in %) |
0.21 % |
0.41 % |
1.33 % |
1.91 % |
1.74 % |
– |
|
EPS |
3.78 |
4.33 |
5.51 |
6.38 |
– |
– |
|
P/E Ratio |
24.91 |
21.77 |
17.12 |
14.77 |
11.49 |
– |
|
EBIT |
12,747 |
13,730 |
16,114 |
18,372 |
– |
– |
|
EBITDA |
15,100 |
16,154 |
18,961 |
21,466 |
– |
– |
|
Net Profit |
3,727 |
6,972 |
9,116 |
10,570 |
– |
– |
Source: BusinessInsider
Where is the Market Reversal in this Technical Analysis?
Fibonacci
Looking at this long-term Fibonacci red trend line, there appears to be no bottoming process. However, as we do know, based on fundamentals, the stock price of Disney should reverse at some point in the near term.
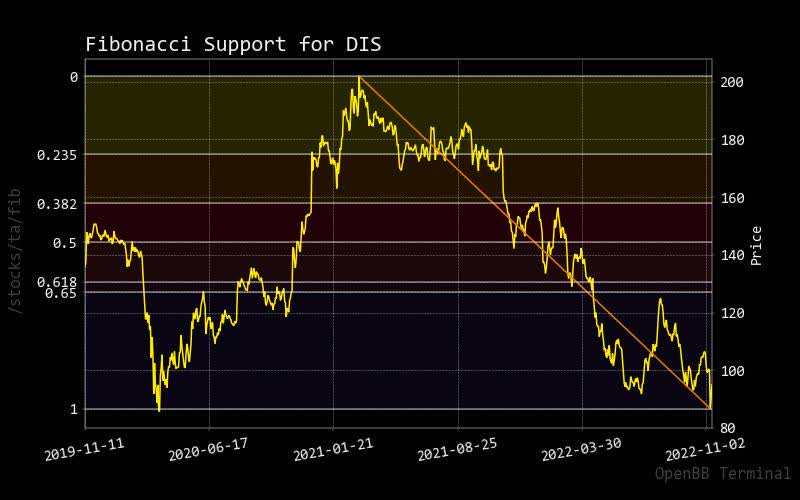
fibonacci disney (custom platform)
Bollinger Bonds
it seems that Disney stock price maintains downward pressure as it continues to move towards its bottom Bollinger band. It is encouraging to see a potential uptick in the upper guide for the stock price to increase eventually.
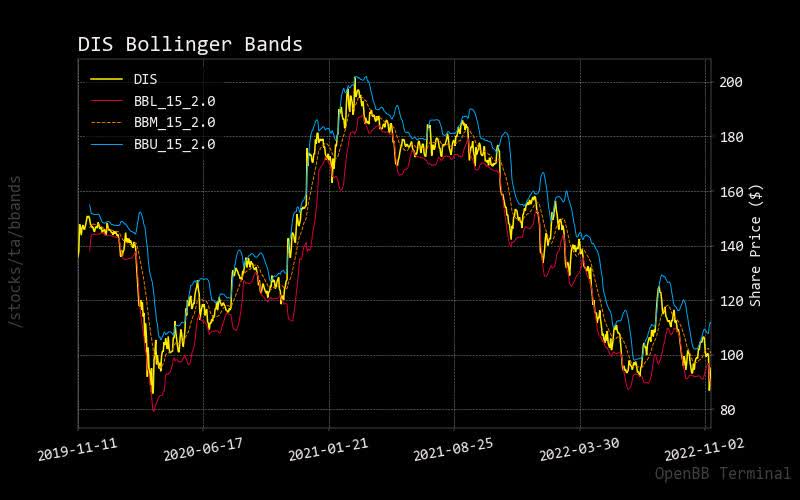
bollinger disney (custom platform)
MACD
If Disney’s stock price continues to fall, potentially past its 2020 low, investors may feel discouraged to hold onto this stock long-term. However, if market analysts see a buy recommendation, hanging on for that moment might be worthwhile. It might take a long time for stock price recovery, but there will be an opportunity cost for deploying capital to this underperformer.
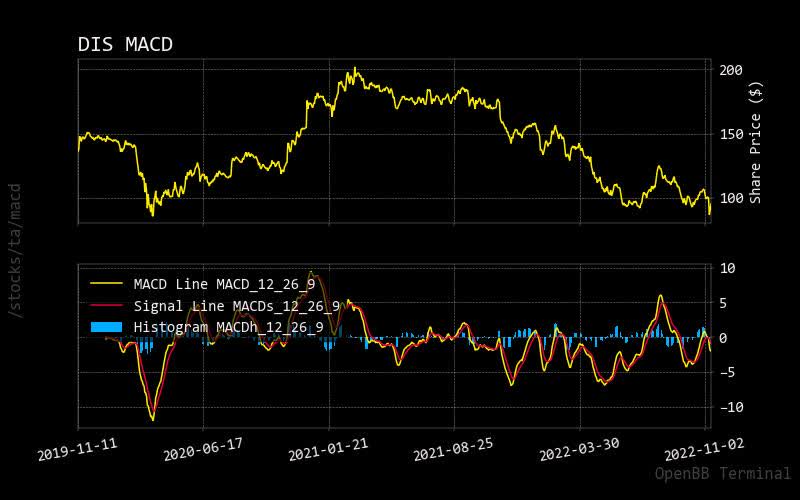
macd disney (custom platform)
RSI
Again it can be pretty discouraging to see the Disney stock price hit the undersold relative strength indicator condition. If the price continues to fall, one investor should assess whether they should sell or not.
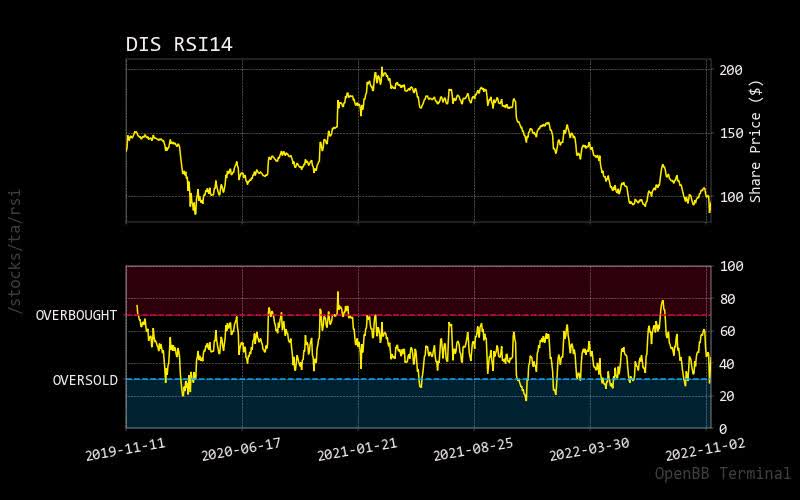
rsi disney (custom platform)
Prediction via Artificial Intelligence
Monte Carlo
This artificial intelligence investigation’s primary purpose is to confirm whether a stock price will move up or down with clarity. Disney’s stock price probability is upward and downward based on various predicted paths. However, when one overlays technical analyses and weaker fundamentals, it is safe to say one should not expect the stock price of Disney to move up.
The normalized distribution shows a similar assessment as the Monte Carlo Simulation. However, with a higher concentration of expected lower stock price for Disney, it is safe to say investors should not expect miracles in the short term.
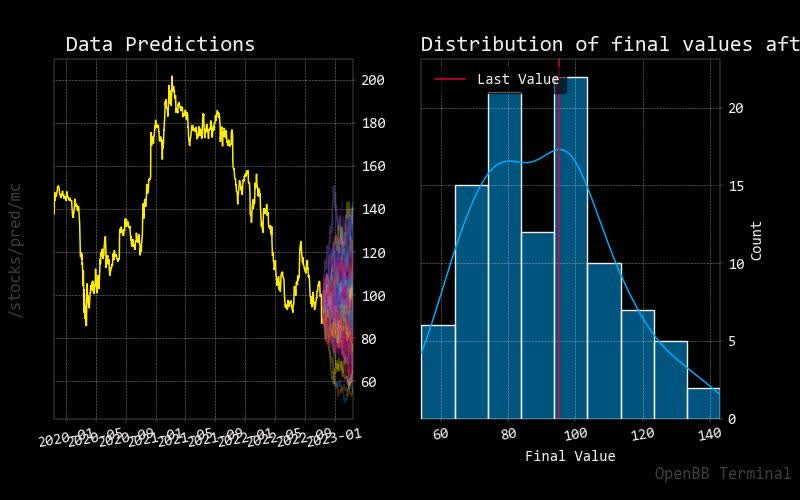
monte carlo disney (custom platform)
Regression
Despite the potential negative stock price expectation for Disney, this forecasted 30-day red regression line says otherwise. this contradicts, which means more emphasis needs to be placed on the fundamentals, potentially confirming upward stock price momentum for Disney.
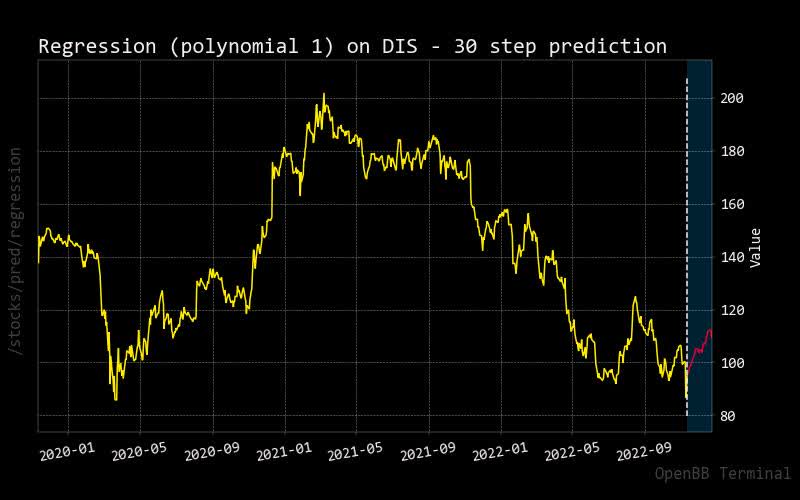
regression disney (custom platform)
Price vs. Short Volume
Although there was a slight uptick in short trading with Disney recently, it appears to decline as the stock price has reached some upswing. Nevertheless, this can be an encouraging sign, meaning investors believe this company may have sustainable stock price growth.
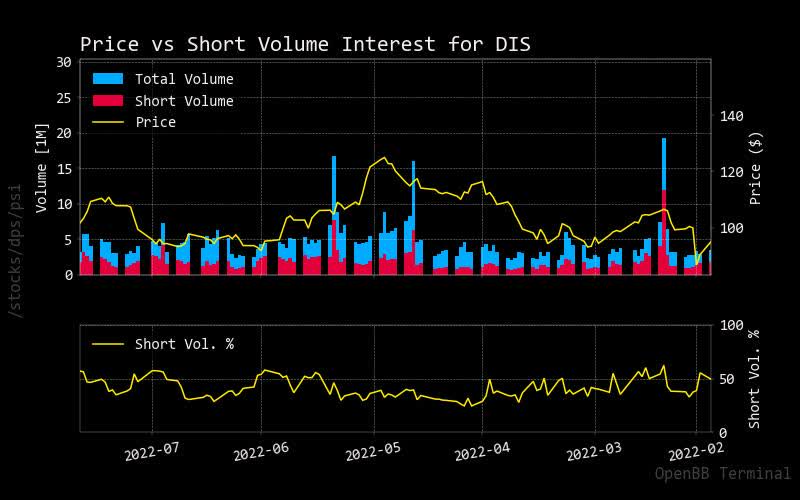
shorting disney (custom platform)
Source: StockGrid
Recommendation
With weaker fundamentals and technical analysis, it is surprising that market analysts recommend this is a buy. However, this could be very short-lived as stock price expectations may be more subdued than other high performers.
|
Interval |
RECOMMENDATION |
BUY |
SELL |
NEUTRAL |
|
One month |
SELL |
5 |
11 |
10 |
|
One week |
BUY |
13 |
4 |
9 |
|
One day |
BUY |
12 |
5 |
9 |
Source: Trading View
Sustainability
Considering Disney promotes itself as a social justice company, one may be surprised to see its underperforming rating when it comes to sustainability. Although this is maybe not a significant factor for investors, it could be for long-term activist pension holders.
|
Metric |
Value |
|
Social score |
7.92 |
|
Peer count |
37 |
|
Governance score |
6.9 |
|
Total esg |
14.88 |
|
Highest controversy |
2 |
|
ESG performance |
UNDER_PERF |
|
Percentile |
9.94 |
|
Environment score |
0.06 |
Source: Yahoo Finance
Conclusion
Over the last few years, Disney appears to have been underperforming compared to other significant stocks. With mixed fundamentals and no optimal technical analysis results, Disney should be reconsidered for long-term investment. As a result, this company should be recommended as a sell rating to preserve gains from healthier companies.
Be the first to comment