

Daria Nipot/iStock Editorial via Getty Images
Introduction
Since peaking in November 2021, Amazon (NASDAQ:AMZN) stock has been on a veritable downtrend; in fact, this year alone, it has underperformed the broader markets by roughly 3x.
YCharts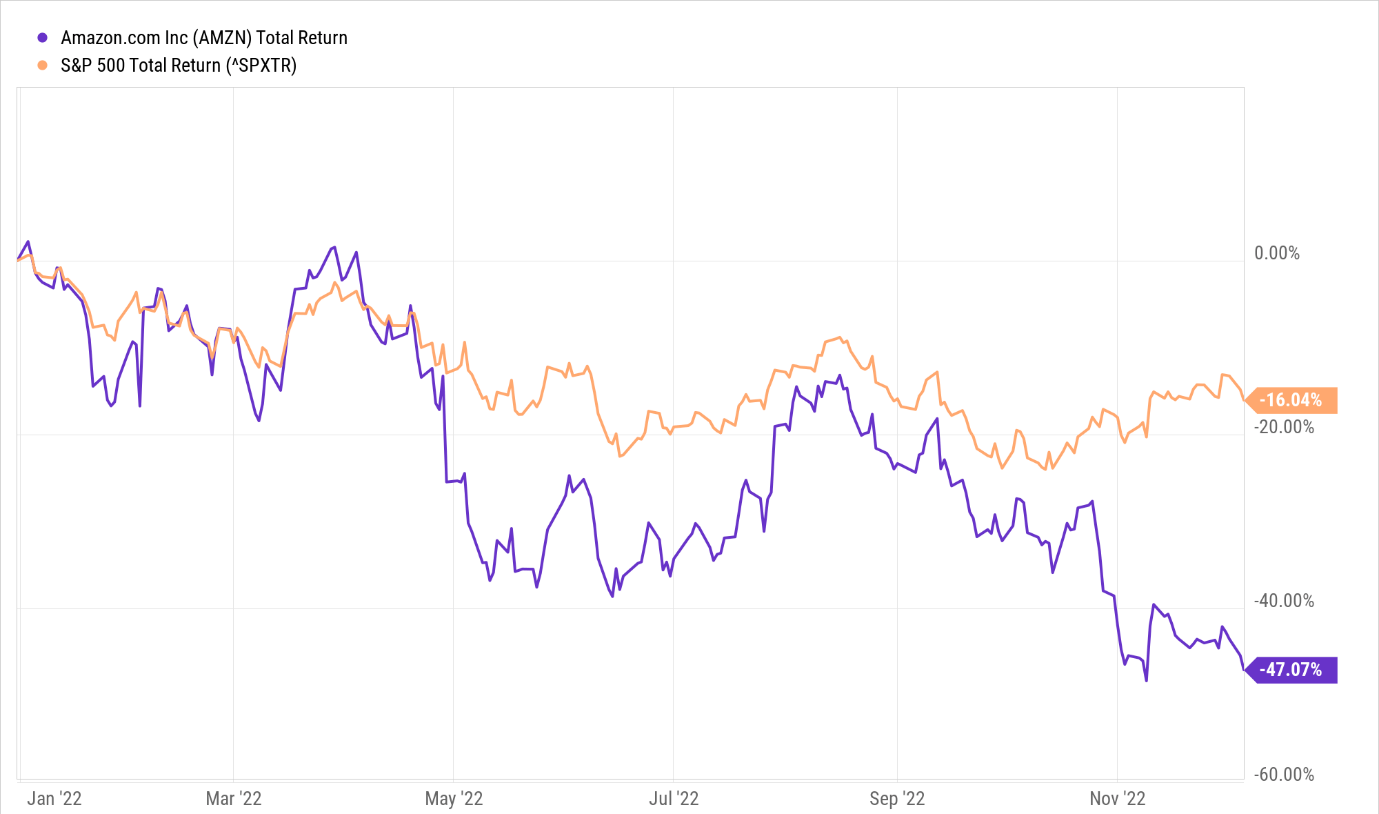
Could we see a different script in 2023? Well, here are some fundamental and technical considerations for your perusal.
What’s Gone Wrong?
You can slice and dice Amazon’s challenges in different ways, but I suspect if investors are to regain confidence in this story, it’s paramount that the company first starts exhibiting its erstwhile qualities as a cash compounder.
YCharts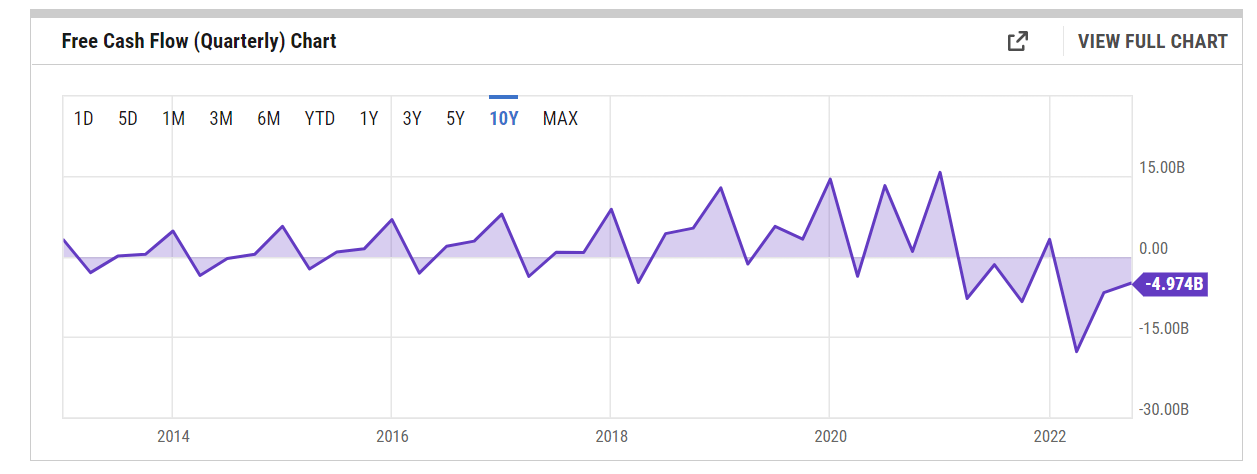
As you can see from the image above, for much of the last 10 years, the company was able to generate ample positive FCF per quarter (once even breaching the $15bn mark!), but recently, with the exception of Q4-21, FCF has largely been negative.
Compounding the issue, you also have another troubling sub-plot where the company has become even more financially geared with the financial debt to EBITDA ratio at its highest level in a decade!
YCharts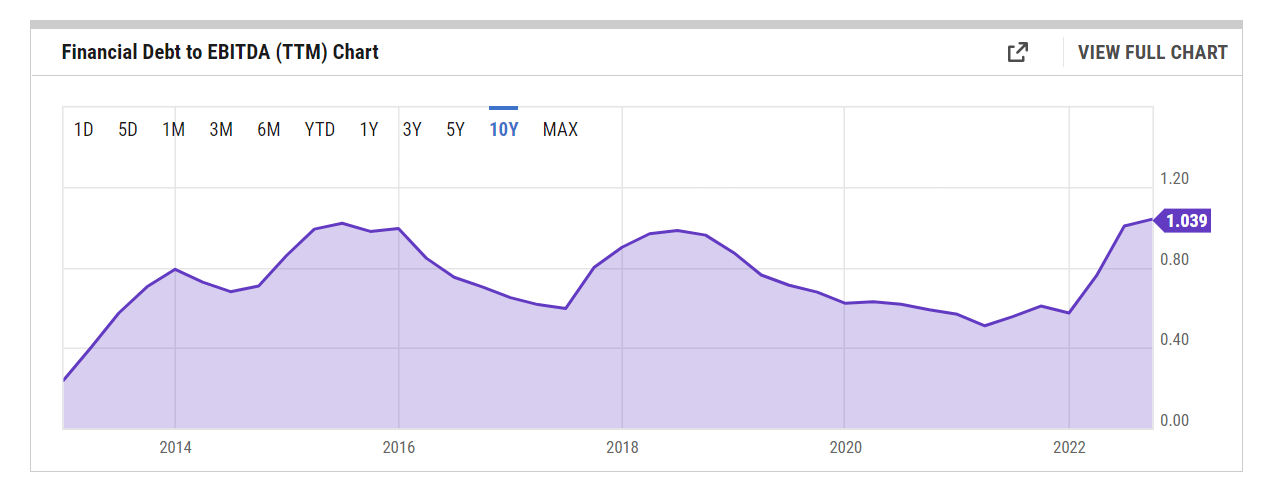
In a risk-averse environment when you have a business with negative cash flows and increased gearing, investors will think twice about paying the sort of elevated valuation multiples that Amazon stock demands. Besides, it’s not as though this is a business that pays a compensatory dividend which could help mitigate the painful drawdowns.
Nonetheless, coming back to the cash flow, there are a few levers to consider. Firstly, conversion from sales to the operating cash flow level has slumped in recent periods. Historically, these conversions used to average around the double-digit levels, but lately, it has dropped to its lowest point in 5 years.
YCharts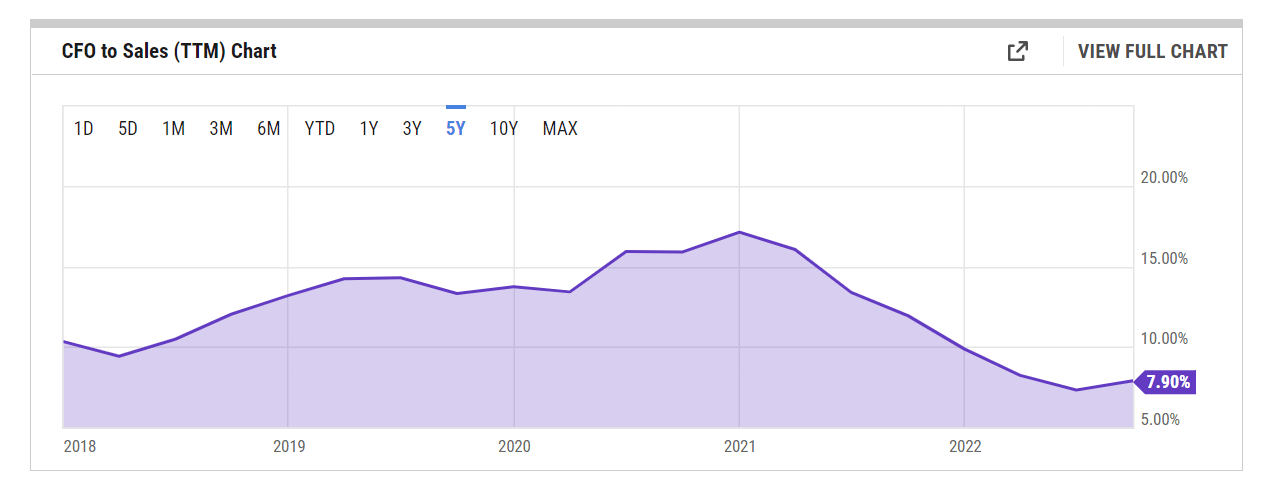
What’s causing this? Well, as a starting point, I don’t believe they’ve done a great job in controlling their variable costs on a per unit basis, yet at the same time, you’ve seen a surge in fixed costs, and not enough revenue momentum to adequately compensate the investments in fixed costs. In effect, operating margins which used to average around 5% per quarter are currently lower than 2%.
YCharts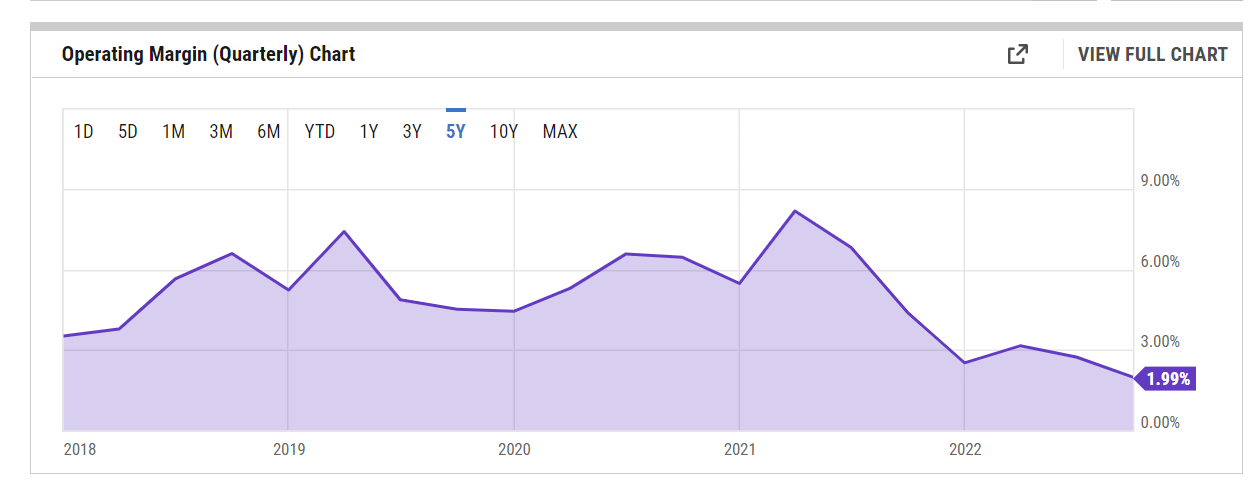
On top of weaker operating profit generation, the recent working capital dynamics haven’t been great. Historically, Amazon has been well placed in this regard, with working capital tied up with its receivables and inventories coming in at a lower pace relative to its payables. Whilst Amazon still benefits from a negative cash conversion cycle, recently that number has pulled away from the long-term average.
YCharts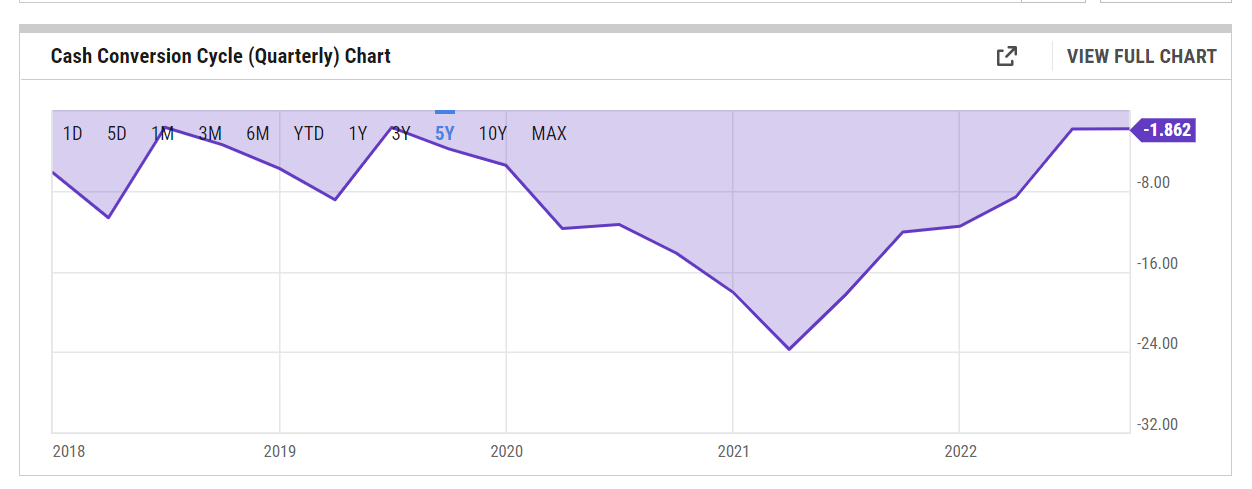
The FCF dynamics have also been hampered by some over-investment on the network infrastructure front. Post the pandemic, I think AMZN management misjudged the underlying appetite of the market and made overwhelming investments in their networks which incidentally doubled in recent years. In effect, the fixed asset turnover ratio which was closer to 4x before the pandemic has now halved to a little over 2x!
YCharts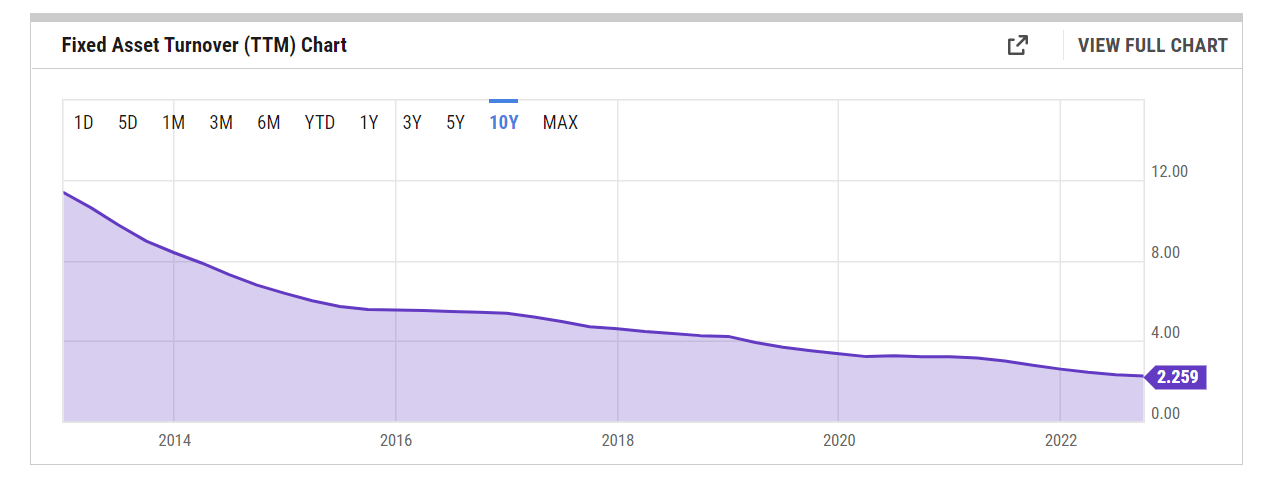
What’s The Outlook?
Clearly mistakes have been made, but it appears as though the company recognizes that, and is looking to right the wrongs.
Firstly, total CAPEX estimates for the year have been trimmed by a third, relative to what was originally planned. Investments in avenues such as the fulfillment network and transportation are now poised to dip by $10bn. While investments in AWS could still put some pressure on cash flow, the overall CAPEX number in FY23 looks poised to ease off, even as the company focuses on leveraging its elevated fixed cost base and engendering greater utilization.
The CFO also spoke about getting the “cost structure back to pre-pandemic levels”, and if this comes to fruition, you’d think operating margins would be well-placed to coalesce toward the long-term average. In mid-Nov, there was talk about cutting Amazon’s workforce by 10,000 employees, but recent reports suggest this number could be closer to 20,000 which should improve per employee metrics, as this could account for over 10% of corporate staff. Also note that in Q3, Amazon was already driving through productivity improvements and cost efficiencies in their network to the tune of $1bn; that will continue to improve as the management stated that they “expect to see further improvement in the quarters ahead” and “they came in 0.5bn short”. Put another way, AMZN thinks it could generate another $1.5bn worth of productivity improvements relative to what was seen in Q2 and Q3.
Then working capital too is likely to make a more positive contribution to operating cash flows as the company is now well stocked with inventories and doesn’t really need to add a great deal there. As the cash conversion cycle reverts back to historical levels, OCF generation should ramp up.
Technical Considerations
The recent price imprints on AMZN’s standalone weekly chart don’t make for great reading but don’t write off the potential for some green shoots to emerge soon enough. For some perspective, let’s look back and consider the landscape since 2019.
Investing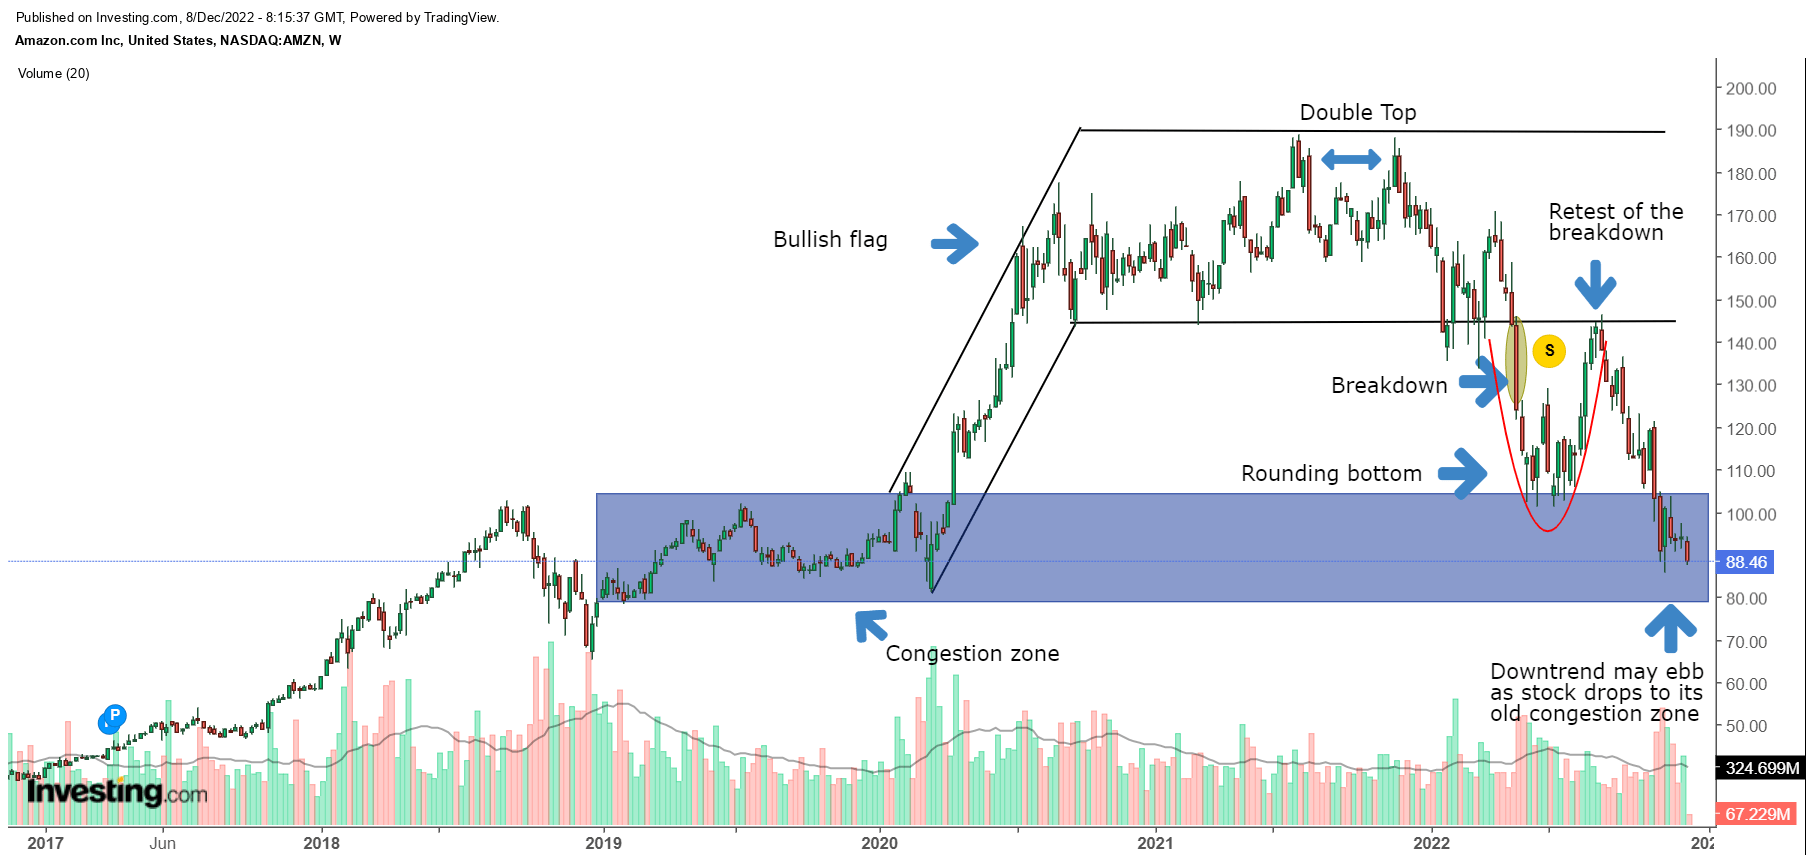
Between 2019-2020 the stock spent a long time consolidating around the $80-$100 levels. We then saw a breakout post-pandemic which coalesced into a bullish flag. The stock then made two separate attempts to break out of this bullish flag in July 2021, and November 2021, but eventually ended up making a bearish double-top around the $188 levels.
Since then, we’ve seen a downtrend with the flag pattern being negated in April this year. The stock then made an encouraging rounding bottom and looked like it would make up for the breakdown below the $150 levels, but this failed to sustain. After that, we’ve seen another prolonged leg down.
Given around 17 weeks of mainly large-shaped red-bodied candles, the current move does feel a bit unidimensional. We may see some abatement of the selling, and some consolidation within the old 2019 congestion zone of $80-$100.
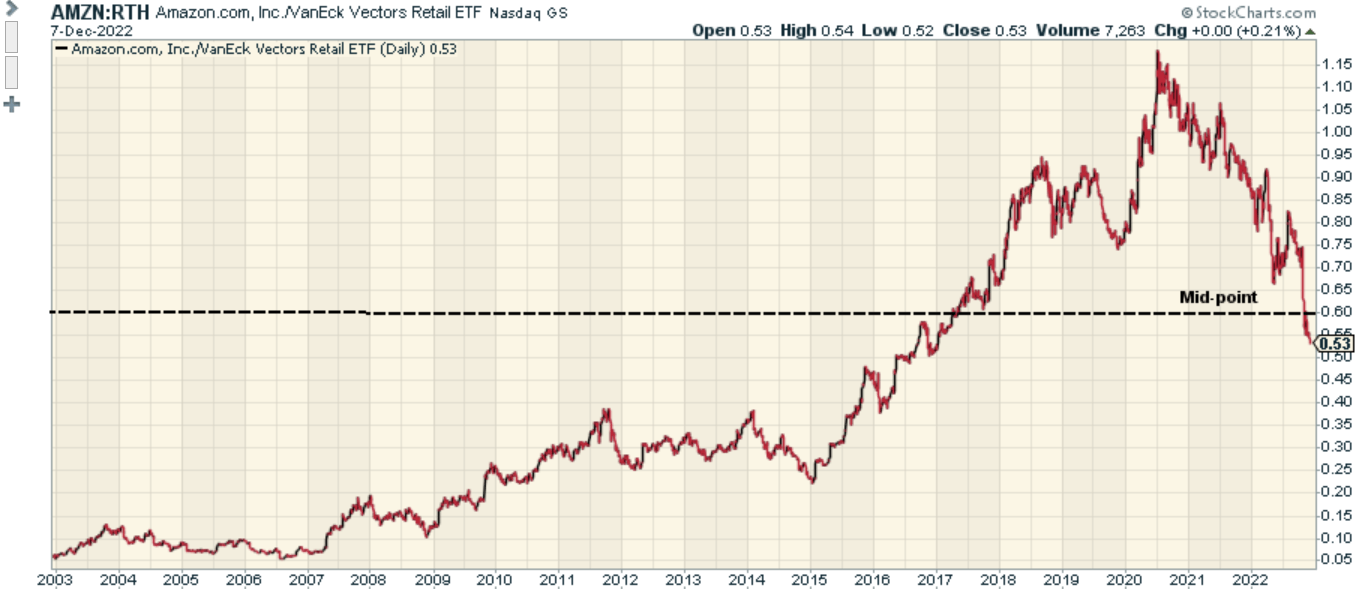
What enhances the case for a potential bottom is that relative to its peers from the Nasdaq, and the retail industry, the stock no longer looks overextended to the upside. That mean-reversion to the downside theme has played out in recent months (something that was unthinkable a few years back), with the stock now trading slightly below the mid-point of its long-term range, relative to both the Nasdaq (QQQ), and the VanEck Vectors Retail ETF (RTH)
Stockcharts Stockcharts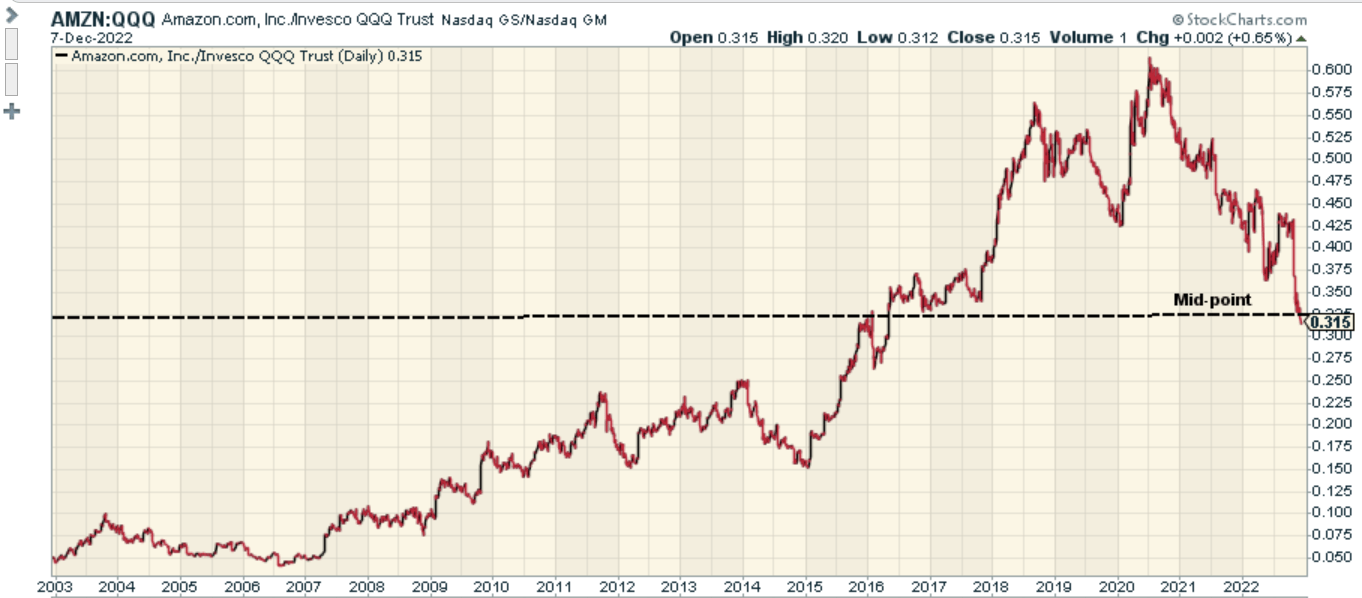
Closing Thoughts- Is AMZN Stock, a Buy, Sell, or Hold?
Granted, fundamentally, Amazon still has some work to do to get its house in order, but at this price point, you also have to wonder if a lot of the risks are baked in?
Note that the FY23 consensus numbers have already seen some pretty aggressive cuts; to expand on this, do consider that over the last 3 months, the Dec 2023 EPS forecast has been slashed by 25% from previous estimates, whilst revenue forecasts for the same year have been trimmed by 6% from previous forecasts.
Given the elevated cuts on the denominator, you’d expect forward P/E valuations to be relatively pricey, but such has been the ferocity of selling that the P/E looks very attractive. To clarify, the stock’s current forward P/E (based on FY23 numbers) is hardly a breath away from the lower end of its 5-year forward P/E range of 49.86-98.63 and is available at a ~32% discount to its 5-year forward P/E average of 74.61x.
YCharts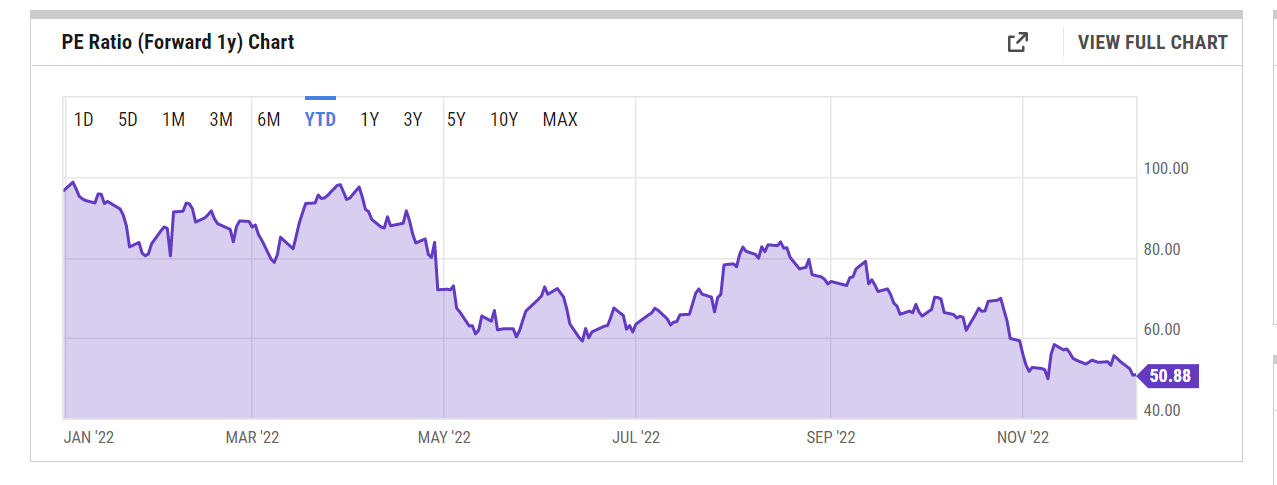
In conclusion, I don’t believe that the downside risks are as pronounced as a few months ago, and the stock may build a base around the current zone which could open up some interesting opportunities to build a position in Amazon. Besides, forward valuations are already cheap relative to the historical average. The AMZN stock is a BUY.
Be the first to comment