

Australian Dollar, Chinese Economic Data, AUD/USD, Iron Ore, Copper – Talking Points
- High-impact central bank decisions likely to affect global sentiment this week
- Chinese home prices, industrial production and retail sales in focus for Monday
- AUD/USD may rise on higher iron ore prices if Chinese data impresses analysts
Discover what kind of forex trader you are
Asia-Pacific markets may be set for a neutral open on Monday as investors prepare for a busy week ahead. The DailyFX Economic Calendar points to several hard-hitting economic events slated to cross the wires this week, as well as interest rate announcements from the Federal Reserve, the Bank of England, and the Bank of Japan. The release of US retail sales data will be the first major US event, with analysts expecting a 0.5% month-over-month drop in February.
A more focused view has Chinese home prices, fixed asset investment, industrial production and retail sales on tap. Analysts expect big numbers on an annual basis, with industrial production slated to rise 30% on a year-over-year basis. However, these lofty expectations are due to the base for comparison being the woeful results amid the initial onset of the Covid-19 outbreak, which virtually shut down China’s economy early last year.
DailyFX Economic Calendar
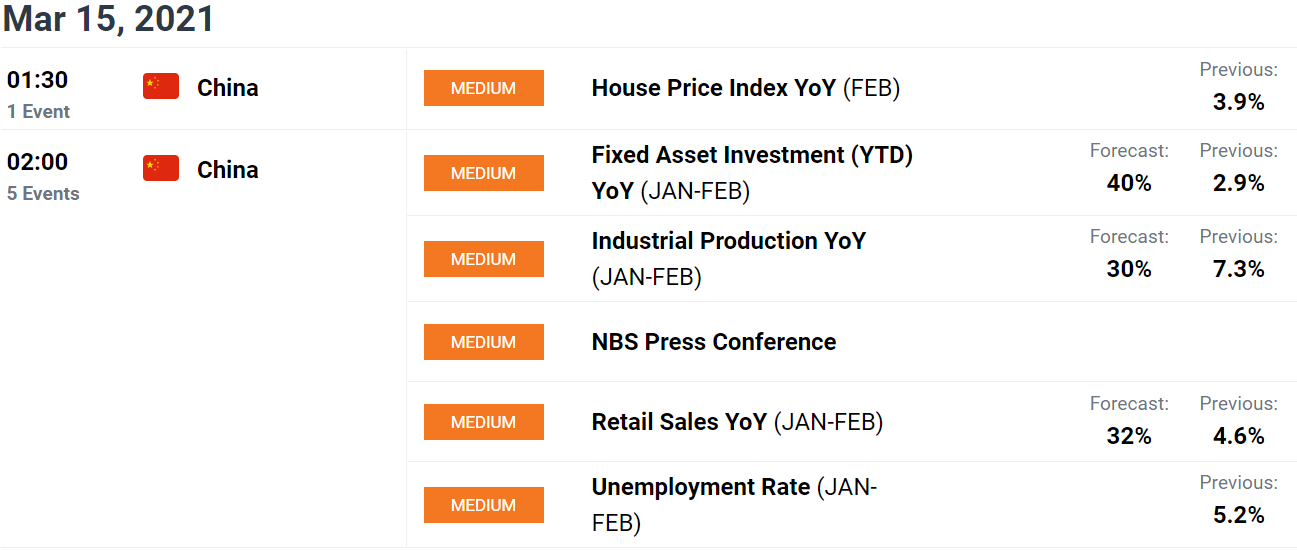
Nonetheless, this morning’s data may steer market sentiment over the next 24 hours. A beat on industrial production or home prices may lift iron ore and copper, as the Chinese economy heavily relies on industrial metals to fuel economic growth. The Australian Dollar may see a positive spillover effect considering its home country is a key iron ore exporter. Indonesia and India are also set to release balance of trade data for February.
AUD/USD versus Iron Ore (Solid Gray Line) – 6 Hour Chart
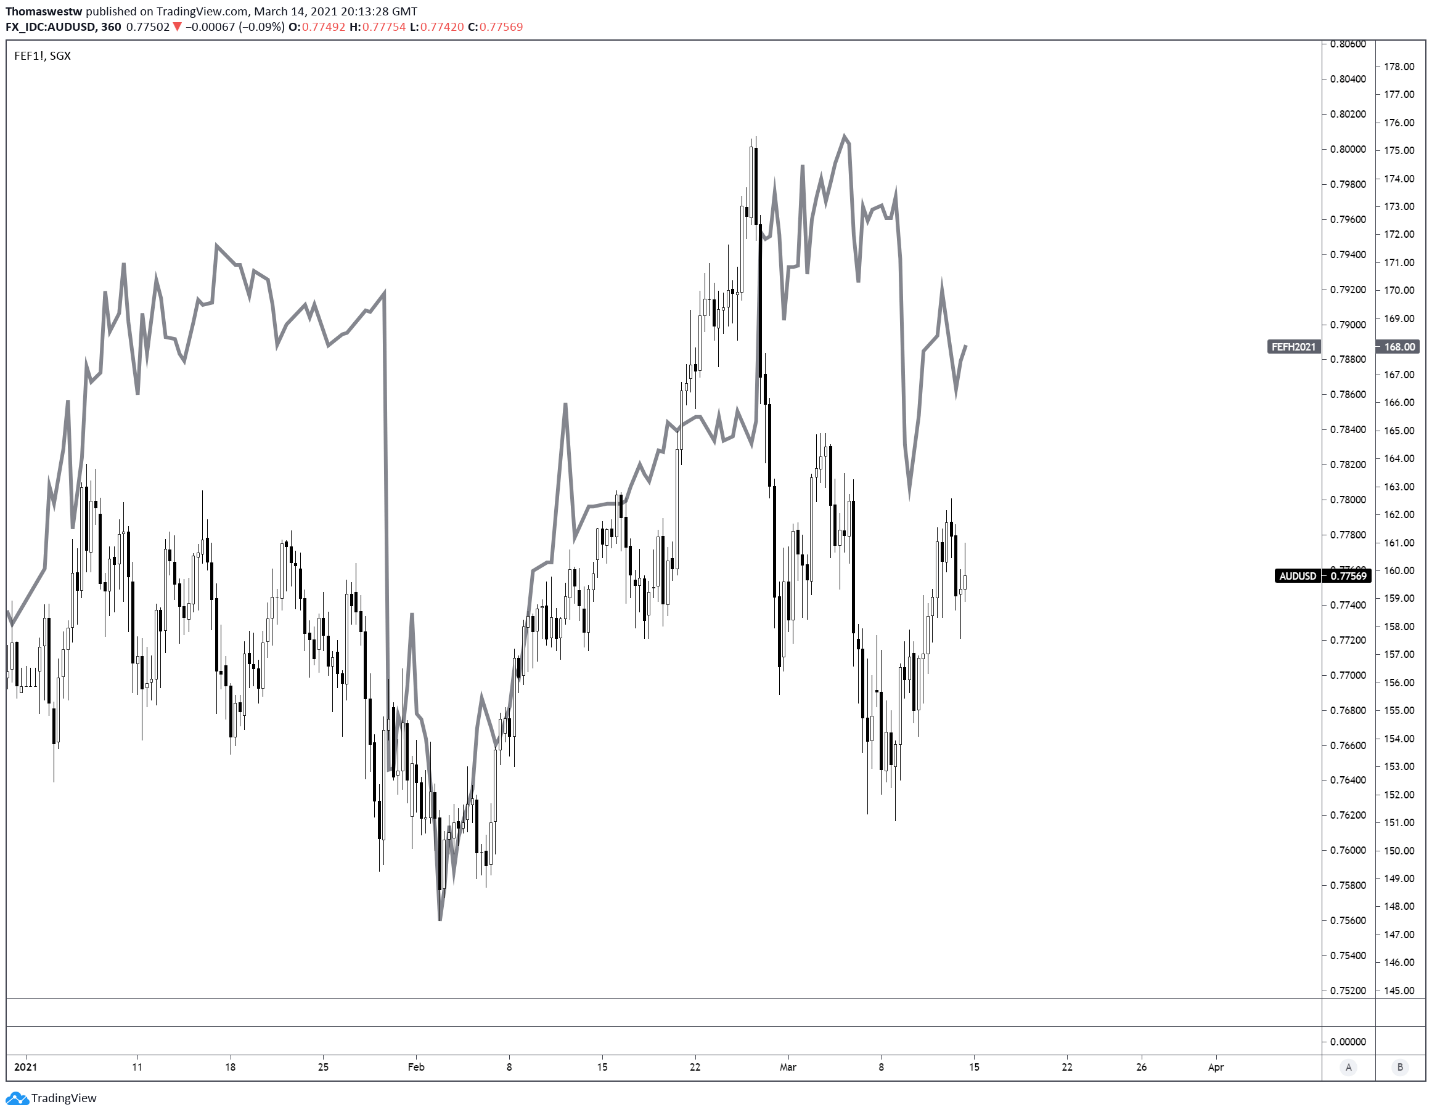
Chart created with TradingView

Recommended by Thomas Westwater
Learn how to become a more consistent forex trader
AUD/USD Technical Outlook
The Australian Dollar gained just over 1% last week versus the US Dollar. AUD/USD is currently trading between its 20- and 50-day Simple Moving Averages (SMA). The pair’s technical posture is rather neutral, with MACD and the Relative Strength Index (RSI) moving along their respective midpoints. To the downside, the 50-day SMA and 61.8% Fibonacci retracement level may be the most likely support zone. Alternatively, resistance from a trendline formed off the November swing low will likely present a challenge to Aussie-Dollar bulls.
AUD/USD Daily Chart
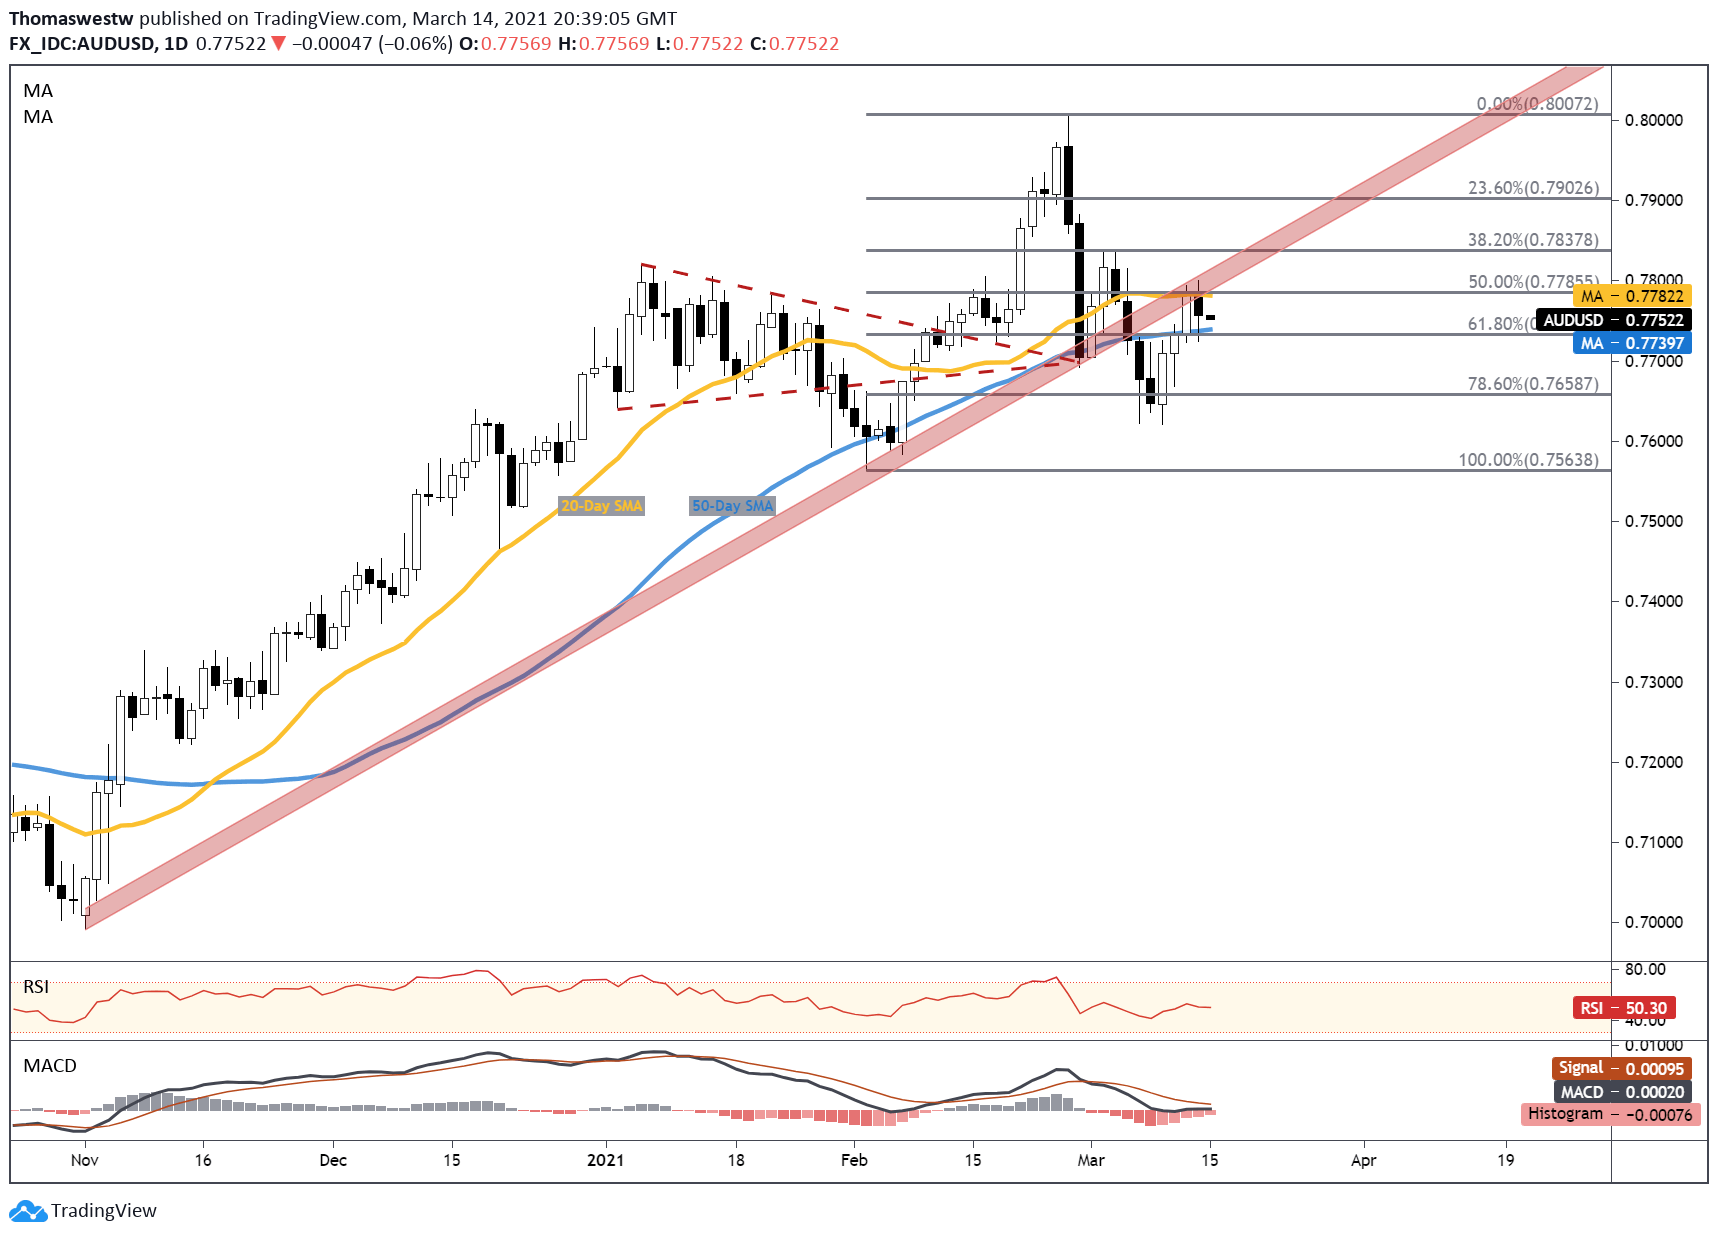
Chart created with TradingView
AUD/USD TRADING RESOURCES
— Written by Thomas Westwater, Analyst for DailyFX.com
To contact Thomas, use the comments section below or @FxWestwateron Twitter
Be the first to comment