

Chaay_Tee/iStock via Getty Images
A Quick Take On QuantaSing Group Limited
QuantaSing Group Limited (QSG) has filed to raise $40.6 million in an IPO of its American Depositary Shares representing underlying Class A ordinary shares, according to an amended F-1 registration statement.
The firm provides online learning services to adults in China.
QSG has produced decreasing revenue and increased operating losses in its most recent three-month reporting period.
Given the unpredictable nature of Chinese regulators in the education industry and the company’s dropping revenues in the most recent three-month period, I’m on Hold for the QuantaSing Group Limited IPO.
QuantaSing Overview
Beijing, China-based QuantaSing Group Limited was founded to develop a range of online courses geared to adults in China seeking to continue their personal development.
Management is headed by founder, Chairman and CEO Peng Li, who has been with the firm since its inception and was previously founder and CEO of Beijing Renjuren Network Technology Co. and prior to that was strategic cooperation manager of Baidu.com.
The company’s primary online offerings include:
-
Financial literacy
-
Other personal interest topics
-
Enterprise customer offerings.
As of September 30, 2022, QuantaSing has booked fair market value investment of $94.7 million from investors, including Even Par Holding, K2 Entities, DCM, GGV, PAC entities, Qiming Ventures and VM EDU Fund I.
QuantaSing – Customer Acquisition
The firm markets its multi-branded services online to consumers and instructors. In addition, the company targets enterprises via direct sales and marketing efforts.
QSG also provides customer leads of its financial literacy learner list to securities brokerage firms in return for referral fees.
As of November 30, 2022, the firm counted approximately 59.7 million registered users.
Sales and Marketing expenses as a percentage of total revenue have trended higher as revenues have decreased, as the figures below indicate:
|
Sales and Marketing |
Expenses vs. Revenue |
|
Period |
Percentage |
|
Three Mos. Ended September 30, 2022 |
88.1% |
|
FYE June 30, 2022 |
78.6% |
|
FYE June 30, 2021 |
96.3% |
(Source – SEC.)
The Sales and Marketing efficiency multiple, defined as how many dollars of additional new revenue are generated by each dollar of Sales and Marketing spend, was negative (0.2x) in the most recent reporting period, as shown in the table below:
|
Sales and Marketing |
Efficiency Rate |
|
Period |
Multiple |
|
Three Mos. Ended September 30, 2022 |
-0.2 |
|
FYE June 30, 2022 |
0.5 |
(Source – SEC.)
Management did not disclose any customer or revenue retention rate metrics.
QuantaSing’s Market & Competition
According to a 2019 market research report by iResearch, China’s online education market was valued at about $9.9 billion in 2012, reached $35.2 billion in 2018 and is expected to exceed $76 billion by 2025.
The number of China’s online education paying users reached an estimated 135.4 million in 2018, an increase of 23.3% year-over-year, as shown by the chart below:
China Online Education (iResearch)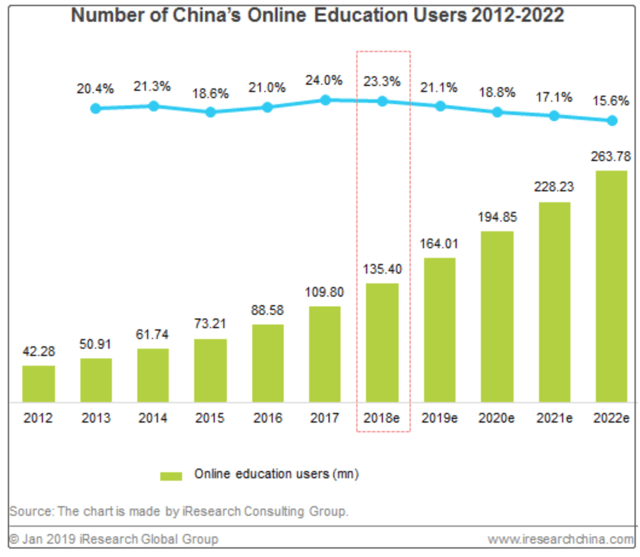
The main factors driving forecast market growth include the increasing acceptance of online education among users, improving online service payment willingness and enhancements in online learning experience and effectiveness.
Major competitive or other industry participants include:
-
Tencent
-
NetEase
-
Kaikeba
-
Sanjieke
-
ForChange
-
MOOC China
-
iMOOC
-
Others.
QuantaSing Group Limited Financial Performance
The company’s recent financial results can be summarized as follows:
-
Dropping topline revenue
-
Reduced gross profit and variable gross margin
-
Increasing operating losses
-
Lowered cash flow from operations.
Below are relevant financial results derived from the firm’s registration statement:
|
Total Revenue |
||
|
Period |
Total Revenue |
% Variance vs. Prior |
|
Three Mos. Ended September 30, 2022 |
$ 92,692,000 |
-12.8% |
|
FYE June 30, 2022 |
$ 403,173,000 |
60.4% |
|
FYE June 30, 2021 |
$ 251,420,000 |
|
|
Gross Profit (Loss) |
||
|
Period |
Gross Profit (Loss) |
% Variance vs. Prior |
|
Three Mos. Ended September 30, 2022 |
$ 82,140,000 |
-12.6% |
|
FYE June 30, 2022 |
$ 345,711,000 |
53.1% |
|
FYE June 30, 2021 |
$ 225,859,000 |
|
|
Gross Margin |
||
|
Period |
Gross Margin |
|
|
Three Mos. Ended September 30, 2022 |
88.62% |
|
|
FYE June 30, 2022 |
85.75% |
|
|
FYE June 30, 2021 |
89.83% |
|
|
Operating Profit (Loss) |
||
|
Period |
Operating Profit (Loss) |
Operating Margin |
|
Three Mos. Ended September 30, 2022 |
$ (13,150,000) |
-14.2% |
|
FYE June 30, 2022 |
$ (33,089,000) |
-8.2% |
|
FYE June 30, 2021 |
$ (47,219,143) |
-18.8% |
|
Comprehensive Income (Loss) |
||
|
Period |
Comprehensive Income (Loss) |
Net Margin |
|
Three Mos. Ended September 30, 2022 |
$ (13,674,000) |
-14.8% |
|
FYE June 30, 2022 |
$ (32,557,000) |
-35.1% |
|
FYE June 30, 2021 |
$ (45,148,143) |
-48.7% |
|
Cash Flow From Operations |
||
|
Period |
Cash Flow From Operations |
|
|
Three Mos. Ended September 30, 2022 |
$ 4,001,000 |
|
|
FYE June 30, 2022 |
$ 38,325,000 |
|
|
FYE June 30, 2021 |
$ 11,346,429 |
|
(Source – SEC.)
As of September 30, 2022, QuantaSing had $63.3 million in cash and $115 million in total liabilities.
Free cash flow during the twelve months ended September 30, 2022, was $30.5 million.
QuantaSing’s IPO Details
QuantaSing Group Limited intends to sell 3.25 million American Depositary Shares [ADSs] representing underlying common stock at a proposed midpoint price of $12.50 per ADS for gross proceeds of approximately $40.625 million, not including the sale of customary underwriter options.
Certain existing and potentially new shareholders have indicated an interest (non-binding) in purchasing shares of up to $15.0 million in the aggregate of the offering.
Assuming a successful IPO at the midpoint of the proposed price range, the company’s enterprise value at IPO (excluding underwriter options) would approximate $590 million.
The float to outstanding shares ratio (excluding underwriter options) will be approximately 5.9%. A figure under 10% is generally considered a ‘low float’ stock which can be subject to significant price volatility.
Per the firm’s most recent regulatory filing, it plans to use the net proceeds as follows:
approximately 30%, or US$10.7 million, for improving the learning experience of our learners and our content development capability;
approximately 20%, or US$7.1 million, for broadening our service offerings and expanding our services oversea;
approximately 20%, or US$7.1 million, for improving our technology infrastructures;
approximately 20%, or US$7.1 million, for marketing and brand promotion;
approximately 10%, or US$3.6 million, for general corporate purposes and working capital.
(Source – SEC.)
QuantaSing Group Limited management’s presentation of the company roadshow is not available.
Regarding outstanding legal proceedings, management says the firm is not currently the subject of legal proceedings that would have a material adverse effect on its financial condition or operations.
The listed bookrunners of the IPO are Citigroup, CICC, Tiger Brokers, CLSA and Univest Securities.
Valuation Metrics For QuantaSing
Below is a table of the firm’s relevant capitalization and valuation metrics at IPO, excluding the effects of underwriter options:
|
Measure [TTM] |
Amount |
|
Market Capitalization at IPO |
$688,484,454 |
|
Enterprise Value |
$589,491,454 |
|
Price / Sales |
1.77 |
|
EV / Revenue |
1.51 |
|
EV / EBITDA |
-17.25 |
|
Earnings Per Share |
-$0.63 |
|
Operating Margin |
-8.77% |
|
Net Margin |
-9.01% |
|
Float To Outstanding Shares Ratio |
5.90% |
|
Proposed IPO Midpoint Price per Share |
$12.50 |
|
Net Free Cash Flow |
$30,528,857 |
|
Free Cash Flow Yield Per Share |
4.43% |
|
CapEx Ratio |
67.35 |
|
Revenue Growth Rate |
-12.79% |
(Source – SEC.)
The Rule of 40 is a software industry rule of thumb that says that as long as the combined revenue growth rate and EBITDA percentage rate equal or exceed 40%, the firm is on an acceptable growth/EBITDA trajectory.
QSG’s most recent Rule of 40 calculation was negative (27%) as of Q3 2022, so the firm has performed poorly in this regard, per the table below:
|
Rule of 40 |
Calculation |
|
Recent Rev. Growth % |
-13% |
|
EBITDA % |
-14% |
|
Total |
-27% |
(Source – SEC.)
Commentary About QuantaSing
QSG is seeking U.S. public capital market investment for a variety of corporate growth initiatives and working capital needs.
The company’s financials have shown decreasing topline revenue, lowered gross profit and fluctuating gross margin, higher operating losses but reduced cash flow from operations.
Free cash flow for the twelve months ended September 30, 2022, was $30.5 million.
Sales and Marketing expenses as a percentage of total revenue have trended higher even as revenue has decreased; its Sales and Marketing efficiency multiple was negative (0.2x) in the most recent reporting period.
The firm currently plans to pay no dividends and to retain future earnings to reinvest back into the firm’s expansion initiatives.
QuantaSing hasn’t spent much on capital expenditures as a percentage of its operating cash flow in the trailing twelve-month period. I wonder if this is just window dressing before the IPO.
The company’s Rule of 40 results have been poor, with a combination of revenue contraction and operating losses contributing to a negative figure for this metric.
The market opportunity for providing online education to adults in China is large but subject to arbitrary regulatory actions, as the K-12 sector has seen in recent years.
Like other Chinese firms seeking to tap U.S. markets, QuantaSing Group Limited operates within a VIE structure or Variable Interest Entity. U.S. investors would only have an interest in an offshore firm with contractual rights to the firm’s operational results but would not own the underlying assets.
This is a legal gray area that brings the risk of management changing the terms of the contractual agreement or the Chinese government altering the legality of such arrangements. Prospective investors in the IPO would need to factor in this important structural uncertainty.
Additionally, the Chinese government’s crackdown on IPO company candidates combined with added reporting requirements from the U.S. side has put a serious damper on Chinese IPOs and their post-IPO performance.
A significant risk to the company’s outlook is the uncertain future status of Chinese company stocks in relation to the U.S. HFCA act, which requires delisting if the firm’s auditors do not make their working papers available for audit for three years by the PCAOB.
Additionally, post-IPO communications from the management of smaller Chinese companies that have become public in the U.S. has been spotty and perfunctory, indicating a lack of interest in shareholder communication, only providing the bare minimum required by the SEC and representing a very different approach to keeping shareholders up-to-date about management’s priorities.
Citigroup is the lead underwriter, and there is no performance data on IPOs led by the firm over the last 12-month period.
A risk to the company’s outlook as a public company includes the recent history of the Chinese government making large and unpredictable changes to education markets within China.
Previous Chinese education firms have performed poorly after listing on U.S. markets.
As for valuation, management is asking IPO investors to pay an Enterprise Value / Revenue multiple of around 1.5x.
It is notable that the IPO has existing and new institutional investor interest (non-binding), but given the unpredictable nature of Chinese regulators in the education industry and the company’s dropping revenues in the most recent three-month period, I’m on Hold for the QuantaSing Group Limited IPO.
Expected IPO Pricing Date: January 19, 2023.
Be the first to comment