

Thinkhubstudio/iStock via Getty Images
A Quick Take On IMMRSIV
IMMRSIV (IMSV) has filed proposed terms to raise $10.8 million in gross proceeds from the sale of its Class A common stock in an IPO, according to an amended registration statement.
The firm produces immersive software for a variety of consumer applications.
IMSV has produced a severe revenue reduction on tiny sales.
Given management’s excessive valuation expectations, the firm’s small revenue and customer base and sharply contracting revenue, I’ll pass on the IPO.
IMMRSIV Overview
Singapore-based IMMRSIV was founded to develop software for augmented/virtual reality applications such as
-
Education
-
Training
-
Tourism
Management is headed by founder, Chairman and CEO Mr. Png Bee Hin, who has been with the firm since its inception in 2008 and was previously vice president of Info-Soft systems, ST Electronics.
The company’s primary offerings include:
As of June 30, 2022, IMMRSIV has booked fair market value investment of $2.5 million from investors including Png Bee Hin, Siddharth Jain and Lim Yau Boon.
IMMRSIV – Customer Acquisition
The company seeks to develop business relationships via a subscription-based business model.
Management says the firm has developed eLearning courseware for more than 120 schools and training institutions in Singapore.
Advertisement & Promotion expenses as a percentage of total revenue have risen as revenues have varied, as the figures below indicate:
|
Advertisement & Promotion |
Expenses vs. Revenue |
|
Period |
Percentage |
|
Six Mos. Ended June 30, 2022 |
16.0% |
|
2021 |
1.0% |
|
2020 |
0.0% |
(Source – SEC)
The Advertisement & Promotion efficiency multiple, defined as how many dollars of additional new revenue are generated by each dollar of Advertisement & Promotion spend, fell sharply to negative (42.9x) in the most recent reporting period, as shown in the table below:
|
Advertisement & Promotion |
Efficiency Rate |
|
Period |
Multiple |
|
Six Mos. Ended June 30, 2022 |
-42.9 |
|
2021 |
33.5 |
(Source – SEC)
IMMRSIV’s Market & Competition
The term “metaverse” was first coined by Neal Stephenson in his science fiction novel Snow Crash.
Strictly speaking, the metaverse is a digital universe that is powered by blockchain technology and is home to decentralized applications.
It is a decentralized, persistent and secure online space where users can create avatars, buy virtual assets, and act in a digital space.
According to a 2022 market research report by Grand View Research, the global metaverse market was an estimated $38.9 billion market in 2021 and is forecast to reach $772 billion by 2030.
This represents a stunning expected CAGR of 39.4% from 2022 to 2030.
The main drivers for this expected growth are an increasing focus on the use of the internet to integrate digital and physical worlds, the growth of mixed reality hardware and software and the outbreak of the global pandemic.
As the COVID-19 pandemic has disrupted traditional methods of doing business, working, and socializing, there is an increasing demand for digital platforms that can provide realistic and immersive experiences.
The pandemic has also created a need for social distancing, which has led to the popularity of online games and virtual reality [VR] as alternatives to real-life social interactions.
This has all contributed to the metaverse lately becoming one of the hottest trends in tech and business.
Also, below is the global metaverse market breakdown by end use in 2021:
Global Metaverse Market (Grand View Research)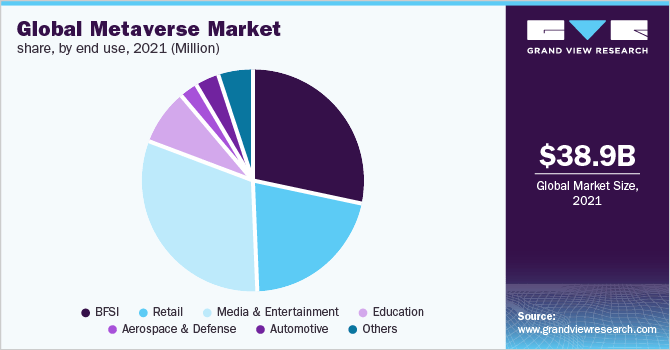
Major competitive or other industry participants include:
-
BaseFX
-
SVHQ Media
-
International media developers & providers
IMMRSIV Financial Performance
The company’s recent financial results can be summarized as follows:
-
Sharply contracting topline revenue
-
Reduced gross profit but higher gross margin
-
A swing to operating loss
-
Positive cash flow from operations
Below are relevant financial results derived from the firm’s registration statement:
|
Total Revenue |
||
|
Period |
Total Revenue |
% Variance vs. Prior |
|
Six Mos. Ended June 30, 2022 |
$ 178,965 |
-87.3% |
|
2021 |
$ 2,858,830 |
48.7% |
|
2020 |
$ 1,922,687 |
|
|
Gross Profit (Loss) |
||
|
Period |
Gross Profit (Loss) |
% Variance vs. Prior |
|
Six Mos. Ended June 30, 2022 |
$ 144,797 |
-80.8% |
|
2021 |
$ 1,583,071 |
121.8% |
|
2020 |
$ 713,760 |
|
|
Gross Margin |
||
|
Period |
Gross Margin |
|
|
Six Mos. Ended June 30, 2022 |
80.91% |
|
|
2021 |
55.37% |
|
|
2020 |
37.12% |
|
|
Operating Profit (Loss) |
||
|
Period |
Operating Profit (Loss) |
Operating Margin |
|
Six Mos. Ended June 30, 2022 |
$ (362,999) |
-202.8% |
|
2021 |
$ 610,942 |
21.4% |
|
2020 |
$ (10,291) |
-0.5% |
|
Comprehensive Income (Loss) |
||
|
Period |
Comprehensive Income (Loss) |
Net Margin |
|
Six Mos. Ended June 30, 2022 |
$ (458,081) |
-256.0% |
|
2021 |
$ 446,489 |
249.5% |
|
2020 |
$ (114,022) |
-63.7% |
|
Cash Flow From Operations |
||
|
Period |
Cash Flow From Operations |
|
|
Six Mos. Ended June 30, 2022 |
$ 1,024,701 |
|
|
2021 |
$ 635,675 |
|
|
2020 |
$ 172,848 |
|
(Source – SEC)
As of June 30, 2022, IMMRSIV had $1.3 million in cash and $2.3 million in total liabilities.
Free cash flow during the twelve months ending June 30, 2022, was $866,106.
IMMRSIV IPO Details
IMSV intends to sell 2.4 million shares of Class A ordinary shares at a proposed midpoint price of $4.50 per share for gross proceeds of approximately $10.8 million, not including the sale of customary underwriter options.
Class A ordinary shareholders will be entitled to one vote per share and Class B shareholders will receive twenty votes per share.
The S&P 500 Index no longer admits firms with multiple classes of stock into its index.
No existing shareholders have indicated an interest in purchasing shares at the IPO price.
The company is also registering for sale 1.36 million Class A ordinary shares owned by selling shareholders, potentially to be offered for sale after the closing of the IPO transaction.
Assuming a successful IPO at the midpoint of the proposed price range, the company’s enterprise value at IPO (excluding underwriter options) would approximate $67.9 million.
The float to outstanding shares ratio (excluding underwriter options) will be approximately 13.8%. A figure under 10% is generally considered a ‘low float’ stock which can be subject to significant price volatility.
Per the firm’s most recent regulatory filing, it plans to use the net proceeds as follows:
for development of technology and acquisition;
for talent acquisition;
for marketing;
for corporate loan repayment, including:
a government-assisted COVID-19 loan of US$427,193 remaining principal as of the date of the prospectus, with an interest rate of 2.5% and a term of five years for our working capital purposes, and
an unlimited-term shareholder loan of US$327,735 with an interest rate of 5.0% for our working capital purposes;
the remainder for working capital and other general corporate purposes.
(Source – SEC)
Management’s presentation of the company roadshow is not available.
Regarding outstanding legal proceedings, management says the firm is not involved in any legal proceedings that would have a material adverse effect on its financial condition or operations.
The sole listed bookrunner of the IPO is Prime Number Capital.
Valuation Metrics For IMMRSIV
Below is a table of the firm’s relevant capitalization and valuation metrics at IPO, excluding the effects of underwriter options:
|
Measure [TTM] |
Amount |
|
Market Capitalization at IPO |
$78,300,000 |
|
Enterprise Value |
$67,907,251 |
|
Price / Sales |
48.00 |
|
EV / Revenue |
41.63 |
|
EV / EBITDA |
-1640.07 |
|
Earnings Per Share |
-$0.01 |
|
Operating Margin |
-2.54% |
|
Net Margin |
-14.35% |
|
Float To Outstanding Shares Ratio |
13.79% |
|
Proposed IPO Midpoint Price per Share |
$4.50 |
|
Net Free Cash Flow |
$866,106 |
|
Free Cash Flow Yield Per Share |
1.11% |
|
Debt / EBITDA Multiple |
-16.63 |
|
CapEx Ratio |
3.18 |
|
Revenue Growth Rate |
-87.28% |
(Source – SEC)
Commentary About IMMRSIV
IMSV is seeking public capital market investment to pay down debt and for its general corporate working capital requirements.
The company’s financials have generated contracting topline revenue, lowered gross profit but higher gross margin, a swing to operating loss and increasing cash flow from operations.
Free cash flow for the twelve months ended June 30, 2022, was $866,106.
Advertisement & Promotion expenses as a percentage of total revenue have risen as revenue has fluctuated; its Advertisement & Promotion efficiency multiple fell sharply to negative (42.9x) in the most recent reporting period.
The firm currently plans to pay no dividends and to reinvest any future earnings back into the business.
The market opportunity for providing metaverse and virtual reality-based training and education technologies is large and expected to grow substantially in the coming years, so the firm enjoys positive industry growth dynamics in its favor.
Like other firms with Asian country operations seeking to tap U.S. markets, the proposed listing entity operates as a Cayman Islands corporation that owns interests in its other country operations.
U.S. investors would only have an interest in an offshore firm with interests in or only agreements with operating subsidiaries (i.e., potentially no equity interests), some of which may be located in or have substantial operations in China or other Asian countries with restrictions or unpredictable regulatory environments regarding those interests.
Additionally, restrictions on the transfer of funds between subsidiaries within China or other Asian countries may exist.
Prospective investors would be well advised to consider the potential implications of specific laws regarding earnings repatriation and changing or unpredictable regulatory rulings that may affect such companies and their U.S. stock listings.
Additionally, post-IPO communications from the management of smaller Asian companies that have become public in the U.S. has been spotty and perfunctory, indicating a lack of interest in shareholder communication, only providing the bare minimum required by the SEC and a generally inadequate approach to keeping shareholders up-to-date about management’s priorities.
Prime Number Capital is the sole underwriter and IPOs led by the firm over the last 12-month period have generated an average return of negative (31.9%) since their IPO. This is a bottom-tier performance for all major underwriters during the period.
Risks to the company’s outlook as a public company include its tiny size and thin capitalization.
As for valuation expectations, management is asking IPO investors to pay an Enterprise Value / Revenue multiple of 41.6x despite sharply declining revenue from a tiny base.
Given management’s excessive valuation expectations, the firm’s small revenue and customer base and sharply contracting revenue, I’ll pass on the IPO.
Expected IPO Pricing Date: To be announced
Be the first to comment