

sarawuth702
By Jay Jacobs
Senate’s deal targets clean energy and electric vehicle
After almost a year of intraparty negotiations, Senate Democrats struck a deal to approve approximately $370 billion of new investment in several areas including clean energy, electric vehicles and other related areas as part of The Inflation Reduction Act of 2022. While there are a number of outstanding steps to the bill becoming law, if it does, we see this investment potentially accelerating the structural growth trends behind these technologies.
According to Alastair Bishop, portfolio manager on the BlackRock Future Climate and Sustainable Economy ETF (BECO): “The announcement that the Democrats have reached a compromise has been positive news for clean power and other themes. If finalized, it could further drive investment in solar, wind, electric vehicles, and hydrogen.”
The bill, if it also passes the House and is signed by the president, would advance an additional prong of the Biden administration’s economic agenda, building on last year’s Infrastructure Investment and Jobs Act (IIJA), which drove historic spending in U.S. infrastructure and included tens of billions for clean energy, electric vehicles and other related technologies. If successful, we anticipate that this spending has the potential to translate to significant revenues for clean energy companies and electric vehicle firms for years to come.
Investors have long paid attention to the potential for a multifaceted package that could support clean energy and lay the groundwork for greater EV adoption. From late 2020 through early 2021 (8/31/20 – 2/28/21), when markets anticipated similarly historic spending in this area, we saw $14 billion flow into clean energy and electric vehicle ETFs while the S&P Global Clean Energy Index and the NYSE FactSet Global Autonomous Driving and Electric Vehicle Index were up 51% and 32%, respectively.1,2 Some of those gains were then given back when support fell apart for the package. Markets are already responding — the S&P Global Clean Energy Index and the NYSE FactSet Global Autonomous Driving Electric Vehicle Index gained 8% and 4%, respectively, the week following the bill’s announcement (7/27/22 – 8/2/22).3
What’s in the bill
Paid in full
Amid volatile energy costs, the Inflation Reduction Act of 2022’s energy-related provisions have the potential to strengthen domestic energy security and support domestic electric vehicle production. To achieve this, it plans on investing roughly $370 billion across:4
Clean energy production — Production tax credits for clean electricity generation and investment tax credits for new clean energy projects across wind, solar, geothermal, bioenergy, hydropower, energy storage, and clean hydrogen, as well as approximately $30 billion in grants and loans to modernize utilities’ and states’ electric infrastructure.
Electric vehicles — Offers consumers $4,000 – $7,500 tax credits for EV purchases and manufacturer tax credits for producing EVs, EV batteries, and building new EV manufacturing facilities. It also offers up to $20 billion in loans and $2 billion in grants for new and existing EV facilities, as well as $3 billion to procure zero-emission vehicles for public transit and the federal fleet.
Clean technology manufacturing — Production and investment tax credits of $30 billion for manufacturing solar panels, wind turbines, heat pumps, EVs, batteries, and critical minerals; $10 billion for facilities to produce them; and $6 billion (including grants) for carbon capture. Direct spending includes $7.5 billion for clean technology products and $29 billion in breakthrough energy research.
Adoption of enabling technologies — Significant tax credits, $9 billion in rebates, and a $1 billion grant program to fund residential electrification and energy efficiency technologies, including heat pumps, rooftop solar, electric HVAC, water heaters, and home appliances.
It is also critical to note that the bill includes a range of features in areas with broad bipartisan consensus — specifically nuclear power and natural gas. And, though funding was a primary sticking point leading up to the recent deal, negotiations yielded agreement on provisions that could raise on the order of $700 billion of new revenue and reduce the national deficit by over $300 billion, fighting inflation and addressing several hot button issues across taxation and healthcare.5
Accelerating clean energy production
Tax incentives further reduce costs
Tax credits from the 2000s and 2010s helped accelerate the scaling of wind and solar power in the U.S., bringing down costs, and ultimately making clean power more affordable than fossil fuels.6
Clean energy production and investment tax credits have historically driven significant clean energy capacity additions in the US
US Department of the Treasury Annual Tax Expenditure Releases, 2011 – 2021; BP, Statistical Review of World Energy, 2022/2021 Editions.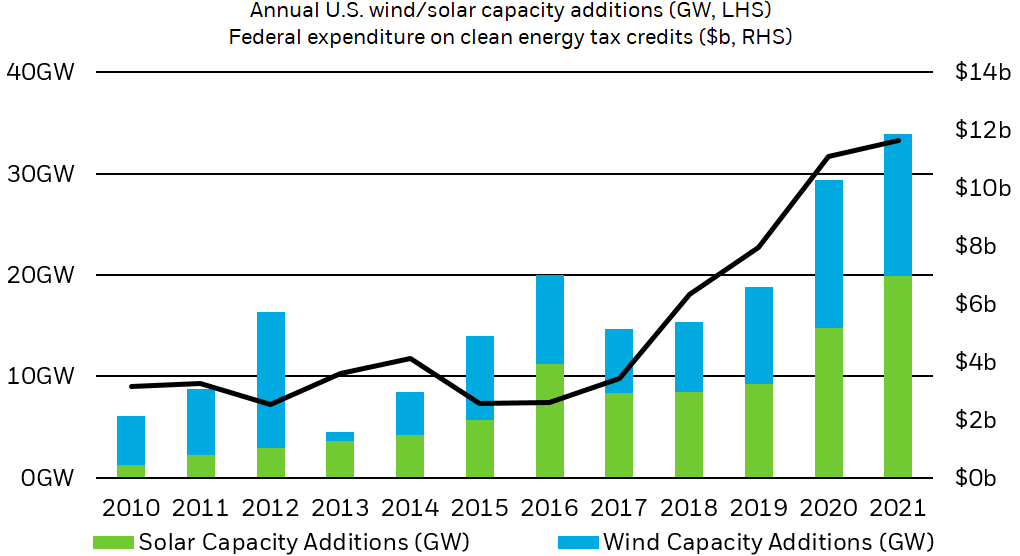
Note: Tax credit expenditure reflects budget estimate from nearest fiscal year total tax expenditure release (FY2011 – 2021). Represents sum of production and investment tax credits for clean energy sources.
Chart description: Combined stacked column and line chart with columns showing the annual wind and solar power generation capacity gains and with the line showing the annual total federal expenditure on production and investment tax credits. The chart shows how increased federal spending on tax credits historically contributed to new clean energy generation capacity.
This new round of potential tax incentives could further accelerate the growth of clean energy production through subsidizing additional projects to achieve greater scale and increasing the profitability of producers.
Projections show the importance of extending federal clean energy tax credits for growing US clean power generation
US Energy Information Administration, July 2022.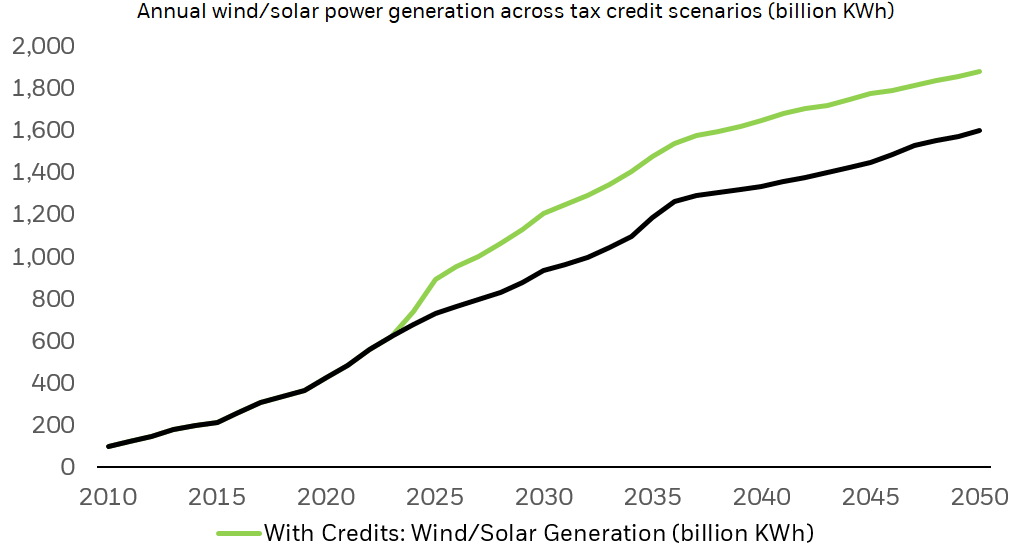
Note: Case with credits assumes extension of tax credits through 2050; without assumes 2023 expiration.
Chart description: Line chart showing combined annual wind and solar power generation in the US across two scenarios: with investment/production tax credits and without. The chart shows how tax credits can contribute to increased power generation over time.
Manufacturers of clean energy technologies could realize similar benefits. Production and investment tax credits for manufacturing could make producing key clean energy components, like solar panels and wind turbines, more profitable. They could also make building new manufacturing facilities less costly. This could accelerate the production of these technologies and drive further gains in manufacturing capacity in the U.S.
Investors seeking to capture this theme may want to consider ETFs that offer exposure not to any one clean power source, such as solar or wind, but the full range of producer types and the many enablers of these technologies, including solar panels, wind and tidal turbines as well as energy transmission tech.
Benefits to the electric vehicle theme
Back in the fast lane
Should the legislation become law, traditional and incumbent EV automakers are likely to see higher demand driven by consumer tax credits. The lifetime ownership cost of EVs is already lower than that of internal combustion engine (ICE) vehicles, and while the average sticker price of EVs is still higher, they are rapidly approaching parity.7,8, The Inflation Reduction Act could seal the deal. The potential $7,500 tax credit offered for purchases of new EVs could lead consumers to switch from traditional autos.
Consumer tax credits were essential to driving US EV demand. Similar initiatives and more affordable EVs could have even greater effect
US Department of the Treasury Annual Tax Expenditure Releases, 2012 – 2021; IEA, 2022.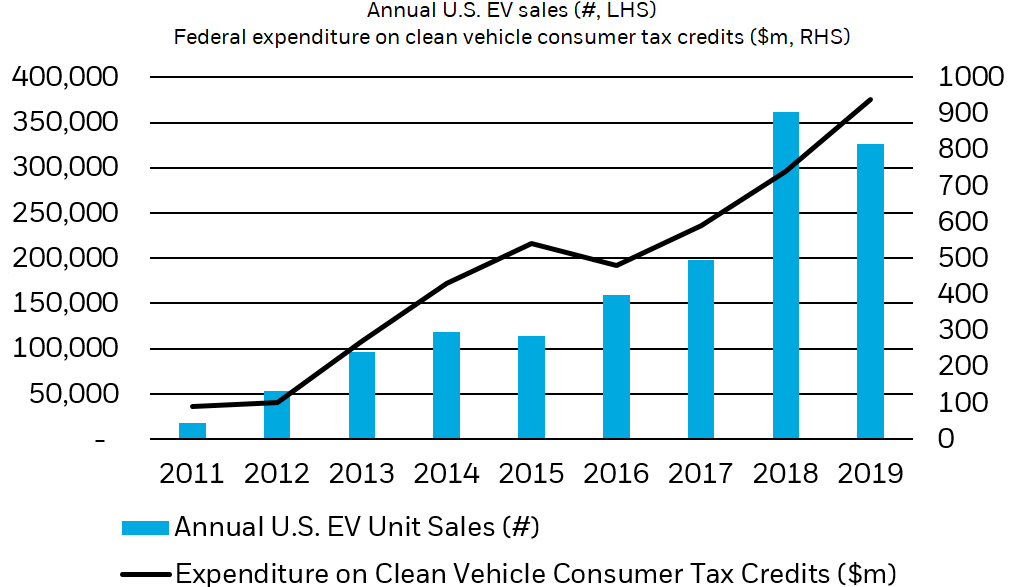
Note: Tax credit expenditures reflect federal budget estimates from nearest fiscal year total tax expenditure release.
Chart description: Combined column and line chart, with columns showing annual EV unit sales in the US and the line showing annual federal expenditures on clean vehicle tax credits. The chart shows how increased spending on clean vehicle tax credits contributed to increased EV sales.
Manufacturers of electric vehicles and related components could realize similar benefits from tax credits, favorable loans and direct investments that could drive increased manufacturing capacity in the U.S. For automakers, this would be particularly meaningful, as the impending costs of shifting to electric vehicles have been daunting. And with global supply chain pressures still hampering manufacturers’ ability to meet demand, the focus on domestic production should make the U.S. transition to EVs more seamless. Moreover, new capacity to produce batteries should help drive the economies of scale needed to bring EVs to cost parity with their ICE counterparts.
Investors anticipating the EV growth potential that could result from this bill becoming law may want to consider ETFs that invest in companies with significant revenue exposure across the full EV supply chain, including manufacturers, battery producers, battery material suppliers and tech enablers.
Conclusion
We believe the Inflation Reduction Act of 2022, if it becomes law, would directly benefit companies from several themes including clean energy as well as electric vehicles. The indirect impacts could be equally immense. Legislation in these fields could have profound implications for both the global clean energy and electric vehicle industries, potentially offering additional near- and long-term boosts. In many ways, the legislation that has passed the senate could serve as a catalyst for clean energy and EVs, which we have long seen as megatrend themes that may be poised for long-term structural growth (see Three reasons why clean energy is at a tipping point and Is it the right time to buy electric vehicle (EV) stocks?).
In our view, investors looking to capitalize on a potential period of acceleration in the clean energy and electric vehicle spaces, may want to consider ETFs that invest holistically across these two Megatrend themes.
——
© 2022 BlackRock, Inc. All rights reserved.
1 ETF flow data provided by Bloomberg, 8/31/20 – 2/28/21; clean energy and electric vehicle ETF classifications provided by BlackRock Global Business Intelligence, with aggregate flows representing the sum of flows for ETFs classified as such.
2 Morningstar, 8/31/2020 – 2/28/2021. Index returns are for illustrative purposes only. Index performance returns do not reflect any management fees, transaction costs or expenses. Indexes are unmanaged and one cannot invest directly in an index. Past performance does not guarantee future results.
3 Morningstar, as of 8/3/2022. See above note, Index returns are for illustrative purposes only.
4 US Senate, “Summary of the Energy Security and Climate Change Investments in the Inflation Reduction Act of 2022,” July 2022.
5 US Senate, “Summary: The Inflation Reduction Act of 2022,” July 2022.
6 Utility Drive, “US wind, solar finance alternatives rise as sector rushes against looming tax credit expiration,” October 2019.
7 CNBC, “Here’s whether it’s actually cheaper to switch to an electric vehicle or not — and how the costs break down,” December 29, 2021.
8 Consumer Reports, “Electric Vehicle Ownership Costs: Today’s Electric Vehicles Offer Big Savings for Consumers,” October 2020.
Carefully consider the Funds’ investment objectives, risk factors, and charges and expenses before investing. This and other information can be found in the Funds’ prospectuses or, if available, the summary prospectuses, which may be obtained by visiting the iShares Fund and BlackRock Fund prospectus pages. Read the prospectus carefully before investing.
Investing involves risk, including possible loss of principal.
Funds that concentrate investments in specific industries, sectors, markets or asset classes may underperform or be more volatile than other industries, sectors, markets or asset classes and than the general securities market.
Technology companies may be subject to severe competition and product obsolescence.
International investing involves risks, including risks related to foreign currency, limited liquidity, less government regulation and the possibility of substantial volatility due to adverse political, economic or other developments. These risks often are heightened for investments in emerging/ developing markets or in concentrations of single countries.
This material represents an assessment of the market environment as of the date indicated; is subject to change; and is not intended to be a forecast of future events or a guarantee of future results. This information should not be relied upon by the reader as research or investment advice regarding the funds or any issuer or security in particular.
The strategies discussed are strictly for illustrative and educational purposes and are not a recommendation, offer or solicitation to buy or sell any securities or to adopt any investment strategy. There is no guarantee that any strategies discussed will be effective.
The information presented does not take into consideration commissions, tax implications, or other transactions costs, which may significantly affect the economic consequences of a given strategy or investment decision.
This material contains general information only and does not take into account an individual’s financial circumstances. This information should not be relied upon as a primary basis for an investment decision. Rather, an assessment should be made as to whether the information is appropriate in individual circumstances and consideration should be given to talking to a financial professional before making an investment decision.
The information provided is not intended to be tax advice. Investors should be urged to consult their tax professionals or financial professionals for more information regarding their specific tax situations.
The Funds are distributed by BlackRock Investments, LLC (together with its affiliates, “BlackRock”).
The iShares Funds are not sponsored, endorsed, issued, sold or promoted by Bloomberg, BlackRock Index Services, LLC, Cohen & Steers, European Public Real Estate Association (“EPRA®”), FTSE International Limited (“FTSE”), ICE Data Indices, LLC, NSE Indices Ltd, JPMorgan, JPX Group, London Stock Exchange Group (“LSEG”), MSCI Inc., Markit Indices Limited, Morningstar, Inc., Nasdaq, Inc., National Association of Real Estate Investment Trusts (“NAREIT”), Nikkei, Inc., Russell or S&P Dow Jones Indices LLC or STOXX Ltd. None of these companies make any representation regarding the advisability of investing in the Funds. With the exception of BlackRock Index Services, LLC, which is an affiliate, BlackRock Investments, LLC is not affiliated with the companies listed above.
Neither FTSE, LSEG, nor NAREIT makes any warranty regarding the FTSE Nareit Equity REITS Index, FTSE Nareit All Residential Capped Index or FTSE Nareit All Mortgage Capped Index. Neither FTSE, EPRA, LSEG, nor NAREIT makes any warranty regarding the FTSE EPRA Nareit Developed ex-U.S. Index or FTSE EPRA Nareit Global REITs Index. “FTSE®” is a trademark of London Stock Exchange Group companies and is used by FTSE under license.
© 2022 BlackRock, Inc. All rights reserved. BLACKROCK, BLACKROCK SOLUTIONS, BUILD ON BLACKROCK, ALADDIN, iSHARES, iBONDS, FACTORSELECT, iTHINKING, iSHARES CONNECT, FUND FRENZY, LIFEPATH, SO WHAT DO I DO WITH MY MONEY, INVESTING FOR A NEW WORLD, BUILT FOR THESE TIMES, the iShares Core Graphic, CoRI and the CoRI logo are trademarks of BlackRock, Inc., or its subsidiaries in the United States and elsewhere. All other marks are the property of their respective owners.
iCRMH0822U/S-2335482
This post originally appeared on the iShares Market Insights.
Editor’s Note: The summary bullets for this article were chosen by Seeking Alpha editors.
Be the first to comment