

bombermoon
Energy Demand
The quantity of energy demanded globally is steadily growing, driven by numerous factors. As the world population grows, agrarian economies become more industrialized, and the average standard of living continues to improve, the demand for energy will increase as will the strain on our resources and environment. Without getting into the details of climate change and its effects on the habitability of Earth for humans, it is reasonable to seek out more efficient and renewable sources of energy to meet our needs.
The growth in renewable energy sources is not a new trend, but one that has recently accelerated and is expected to continue in the years and decades to come, driven by widespread adoption of electric vehicles, growing industrial and agricultural production, and construction, among other factors.
The pie chart below illustrates the sources of carbon emissions globally. The energy required by transportation, industry, and buildings represents nearly 60% of the whole, the result of burning fossil fuels.
J.P. Morgan Guide to Alternatives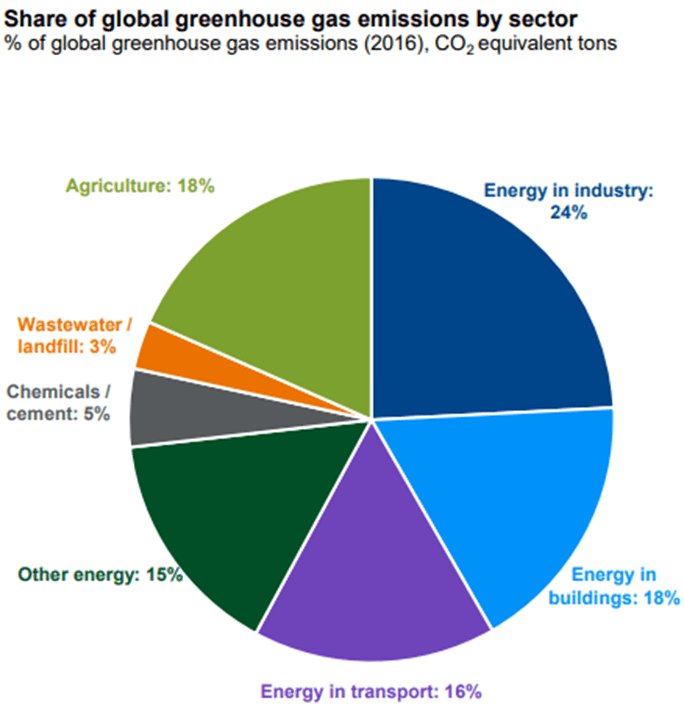
This growing demand is being met with increasing investments in not only renewable power generation, but also storage and other related functions. The graph below from JPMorgan (JPM) illustrates the growth in global energy transition investments. Since about 2014, the investments in storage, electrification, and carbon capture have grown exponentially and now represent approximately half of all energy transition investments.
J.P. Morgan Guide to the Markets
These investments have been instrumental in driving down generation costs across most renewable sources, except for nuclear. Wind and solar are not only competitive, but actually lower cost energy sources than coal, natural gas, and nuclear in most markets.
J.P. Morgan Guide to the Markets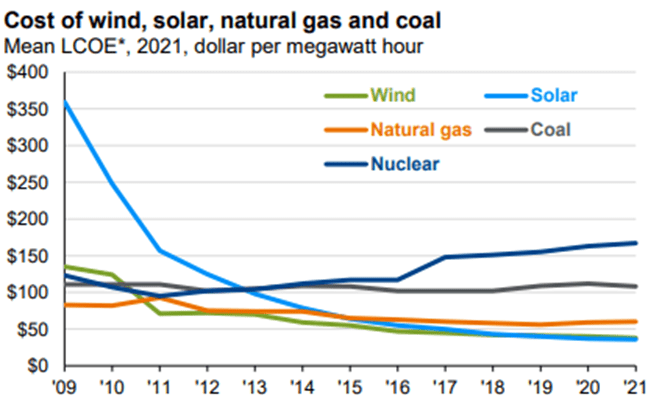
Growth in power demand will be met in large part by the growth of renewable energy generation. Combined, renewable energy sources now generate more electricity than nuclear and coal in the U.S. The growth in renewable generation sources is expected to overtake natural gas around 2030. To accomplish this, significant investments in wind and solar will be necessary, and to a lesser extent hydro (which is unfortunate given the low commodity and resources inputs required for hydro power.)
J.P. Morgan Guide to Alternatives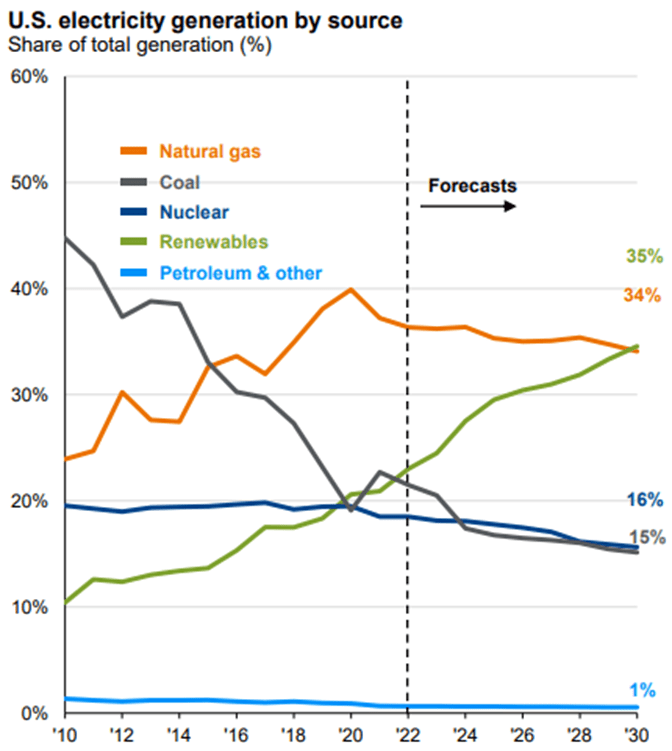
Beneficiaries of the Multi-Decade Trend
The companies positioned to benefit from this long-term trend, which is compounding exponentially, are those focused on mostly wind and solar, as well as those that can deliver that power to households and businesses. Other beneficiaries will include those companies that are able to provide the raw materials used in the generation and transmission of electricity.
Companies directly involved in the generation of renewable energy, primarily solar, include Enphase Energy (ENPH), SolarEdge Technologies (SEDG), and First Solar (FSLR). Enphase offers a system to homeowners and businesses that allows them to generate electricity from solar and store what is not used/needed in a battery for use during lulls in generation or a grid outage. The system can be monitored and managed by customers through the company’s proprietary software and app. The company recently reported record second quarter revenue of over $530 million (20% YoY increase) and gross margin of over 41%.
SolarEdge, headquartered in Israel, provides similar products and services as Enphase. SolarEdge operates in about 34 countries around the world and has grown revenue at a compounded rate in excess of 26% over the last five years while maintaining a gross margin near 30%. Unlike Enphase and SolarEdge, First Solar focuses on large-scale solar projects that are connected to local grids around the world. Also unlike the companies mentioned above, First Solar’s revenue and net profitability have been more volatile, posting a first quarter loss of $0.41 compared to a profit of $1.23/share in the fourth quarter 2021. Because of this volatility within First Solar and other potential idiosyncratic risks these companies face, I suggest taking a more diversified approach rather than trying to bet on individual names.
Diversified Exposure
There are numerous ETFs in the clean and renewable energy space with significant overlap in underlying holdings. For that reason, I will focus on two that are well diversified within the industry and have lower expense ratios.
The iShares Global Clean Energy ETF (ICLN) is one of the more established clean energy funds with trading that started in 2008. The fund is globally diversified with about 45% of value invested in the U.S. and 55% in the rest of the world. The largest exposures outside of the U.S. are in China, Denmark, and Spain, combined representing more than 27% of the portfolio. The fund is invested across about 97 companies, with Enphase Energy and SolarEdge Technologies the two largest individual positions. This ETF is one of least expensive available with an expense ratio of 0.42%.
The SPDR Kensho Clean Power ETF (CNRG) is a newer fund that started trading in 2018. Unlike the iShares fund, CNRG has greater U.S. exposure at about 76% of portfolio value and the remaining 24% invested internationally. Outside the U.S., the largest geographic exposures are to Canada, China, and Brazil, combined representing nearly 18% of the portfolio. The portfolio consists of more than 45 positions including Enphase Energy and First Solar, as well as a 3% position in Tesla (TSLA). This fund is slightly more expensive with an expense ratio of 0.45%.
3-year Performance (Morningstar)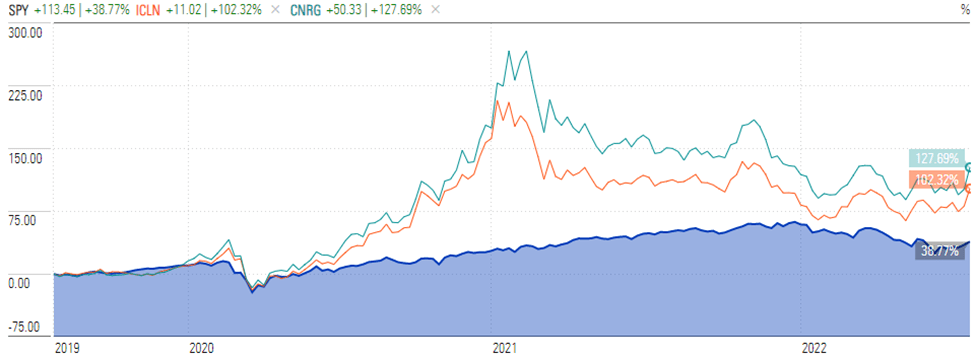
Traditional Utilities
Traditional utility companies will be the largest players in the transmission of electricity from renewable sources. These companies own and operate the infrastructure already in place and are making investments in new infrastructure to increase connectivity and improve grid security and reliability. Utilities also have the advantage of selling a product with very low price elasticity of demand. In other words, demand is not greatly impacted by increasing rates or economic slowdowns. This inelastic demand allows utilities to maintain top-line growth and bottom-line margins. Although not normally an exciting segment of the market, given the economic uncertainty and possibility of a recession, the stability of earnings and dividends, as well as potential growth opportunities driven by new infrastructure spending make this sector attractive.
The Utilities Select Sector SPDR ETF (XLU) remains my preferred method of gaining exposure to the utility sector. The fund is inexpensive with expense ratio of 0.10% and boasts a current yield of about 2.9%. With 29 positions, the portfolio provides broad sector exposure, although its three largest positions, NextEra Energy (NEE), Duke Energy (DUK), and Southern Co (SO), represent over 30% of the portfolio value.
YTD Performance (Morningstar)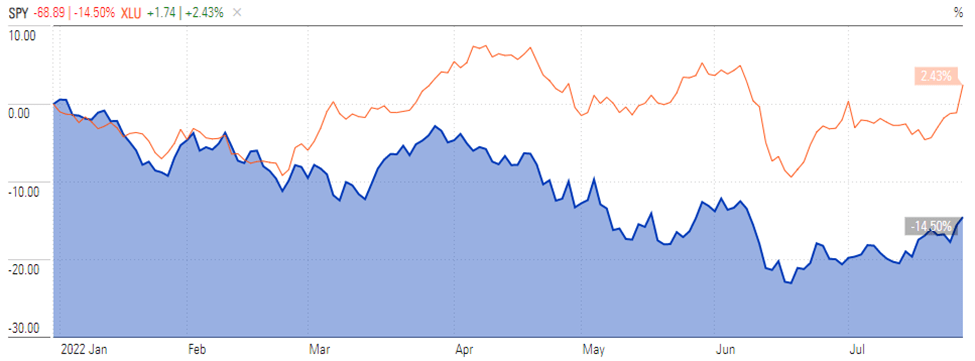
Raw Materials
The table below from J.P. Morgan shows the relative importance of commodities in the generation of various renewable energy sources, as well as in energy storage and transmission networks. As mentioned above, hydro power requires a low level of commodity inputs compared to wind and solar, but hasn’t experienced the same growth in new capacity in recent years.
J.P. Morgan Guide to Alternatives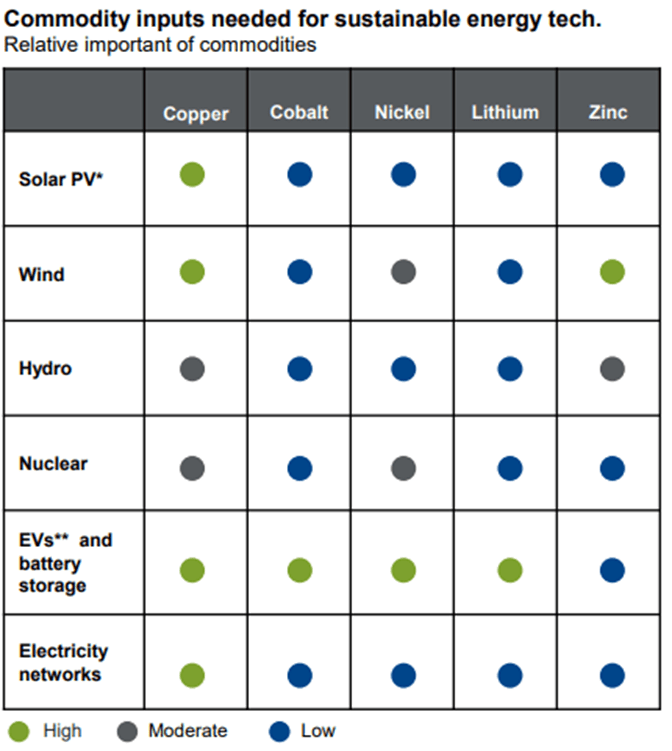
Copper is the most used commodity in renewable energy generation, storage, and transmission. It is heavily used in all current forms of generation except for hydro and nuclear. As the demand for power increases, while at the same time generation is transitioned to wind and solar, the demand for copper will increase and stay elevated for an indefinite period of time. Copper producers, as well as miners of other metals and hard commodities will benefit from this trend.
The world’s largest copper miner by volume, Codelco, is a state-owned enterprise based in Santiago, Chile, and is therefore not investable. Other large copper miners, including Freeport-McMoRan (FCX), BHP Group (BHP), and Rio Tinto (RIO) are traded on the NYSE. Typically, I suggest avoiding picking individual names to invest in a theme as that exposes investors to avoidable idiosyncratic risks. However, there are limited options for diversified funds within the copper mining industry. For that reason, it may make sense for some investors to invest across a basket of market leaders within the copper mining industry, including the ones listed above as well as others operating both in the U.S. and abroad.
While there are several funds that track the price of copper directly or indirectly through an ETN structure or using futures contracts, that is not exactly where we want to be. While I would expect the price of copper to be strong, the rollover of contracts and other exogenous factors may limit the upside to this exposure. Instead, I suggest investing in the miners who benefit from both the price and volume of the commodity demanded.
The one ETF I found that invests in a portfolio of copper miners is the Global X Copper Miners ETF (COPX). With an expense ratio of 0.65%, it is more expensive than I would prefer, but it also has a dividend yield of about 3%. The fund is invested across more than 40 miners, with 90% of the positions by value located outside the U.S. and the remaining 9-10% U.S.-based. The three largest geographic exposures by country are Canada, Australia, and China. The U.S. and Japan round out the top five. The fund has exhibited greater volatility compared to global equity markets with a beta of 1.75 relative to the MSCI ACWI over the last five years.
3-year Performance (Morningstar)
Final Thoughts
The transition to renewable and clean sources of energy will be an investable trend for years and decades into the future, regardless of macroeconomic conditions. The need to reduce carbon emissions is not tied to business or economic cycles, but to the need to maintain a habitable planet in the face of continuously growing energy demand. Businesses operating in the renewable energy space will benefit both from transitioning current generation as well as greenfield projects needed to meet future demand. Furthermore, those projects and associated infrastructure will require certain raw materials and inputs that will drive higher commodity prices and the profitability of the businesses providing them.
The suggestions I am making in this article are intended to be satellite positions added to a core portfolio of highly diversified equity and bond exposure. Because of this, positions should be sized in alignment with investor risk tolerance and preferences, while adhering to any constraints. I look forward to your feedback in the comment section below.
Be the first to comment