

takasuu
It is the start of a new year in mid-January 2023 and the debates between the bulls and the bears continue to rage regarding the outlook for the stock and bond markets. Back in June of 2022, Jamie Dimon, CEO of JPMorgan Chase (JPM), warned that an economic hurricane was on the horizon and warned investors to “brace themselves”. Now in January 2023, he has changed his tune and backed off that warning, currently suggesting that it could be nothing, or it could be bad, but the US has been hit by a bit of a storm already so maybe it won’t be as bad as he previously thought.
Ironically, I received an email message in my Inbox this week from JPM Private Bank encouraging me to read their latest white paper titled, Outlook 2023: See the Potential, with a subtitle that states, “Weaker growth, stronger markets”. The foreword of the discussion in the white paper poses this teaser:
To prepare for the year ahead, we rely on our world-class Global Investment Strategy Group to help us identify both the risks and opportunities that investors may face. Despite the headwinds to growth, they see the potential for stronger markets in 2023 and beyond.
Encouraged by the language used, I decided to dig a little deeper to try to understand where they see “stronger markets” specifically in 2023 and beyond. The highlights of the white paper include these tidbits of investment observations and advice.
- Best entry point in over a decade for stocks and bonds due to a dramatic reset in valuations.
- Bad news is good news. A recession is likely (according to JPM) so central banks will stop hiking rates and inflation will fall.
- Bonds are back. Fixed income offers potential for protection, price appreciation, and yield.
- Reversal of fortunes – small and mid-cap stocks will outperform while mega-caps (e.g., Apple, Amazon, Google) will underperform.
- The era of underinvestment in the real economy is over. (The devil is in the details, so I will let readers of this article read the entire JPM white paper to understand this point better).
Bonds are back
I am a visual person and there are lots of charts and diagrams in the white paper backing up their assertions. There is one chart in particular that I really liked that brings home the point about Bonds being back. The following excerpt explains what they mean about bonds being investable again.
Current yields in many parts of the fixed income complex are now equivalent to historical equity returns. This could give investors an opportunity to reach their goals while taking less risk. As interest rates fall in a recession, longer-duration core fixed income (e.g., investment-grade corporates or municipal bonds) could provide potential total returns well into the teens.
JP Morgan Private Bank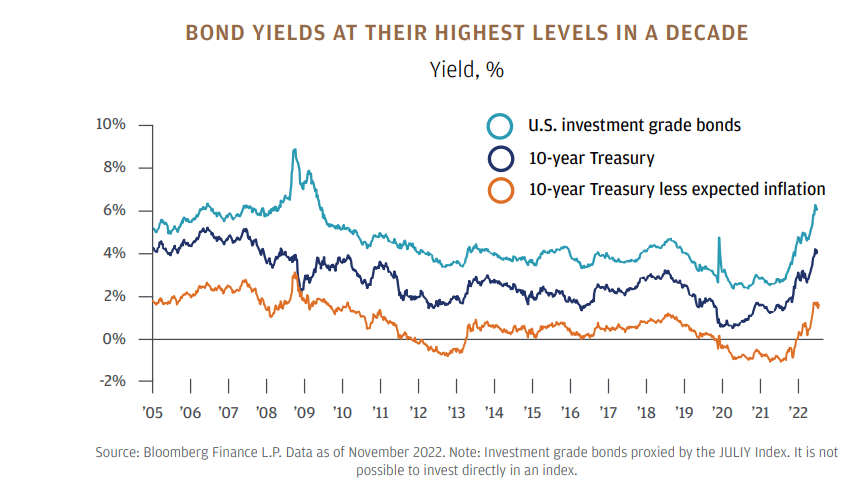
Along these lines, PIMCO offers a similarly encouraging view of the bond market in 2023. In fact, I have to wonder if JPM stole the phrase from this January 11 MarketWatch article with the headline, ‘Bonds are back,’ PIMCO says, as stock market becomes less attractive.
“We continue to see a strong case for investing in bonds, after yields reset higher in 2022 and with an economic downturn looking likely in 2023,” wrote Tiffany Wilding, PIMCO’s North American economist, and Andrew Balls, chief investment officer for global fixed income, in the money manager’s 6-to-12-month outlook.
What this means for me as an income-oriented investor preparing for retirement, is that my asset allocation is leaning more heavily towards fixed income lately. I hope to benefit from the relatively high yielding equity-like returns of fixed income without the risk involved in equity investments such as individual stocks or funds that hold stocks and rely on capital gains for income. While the future is unknowable, this approach can help to provide a flow of income even during bear markets as I discussed in my January 2 article on my Income Compounding approach to investing.
In my November article that discussed the 2022 review of my No Guts No Glory portfolio, I described how my investing style has changed from one of building total returns to grow my portfolio (accumulation phase) to one that focuses on income generation and compounding of income by reinvesting distributions in preparation for taking that monthly income in retirement (decumulation phase). In a bear market, that reinvesting and compounding approach works by adding more, lower cost shares to existing holdings due to the beatdown of just about every asset class including bonds and fixed income funds. So as the distributions hit my account, I reinvest the majority of that income to continue building the future income generation via compounding.
When I decide in the future that I need the income to live off of, or to pay RMDs (in about 10 years) then I can take part of the distributions each month as cash and continue to reinvest some percentage (25%, 50%, or whatever makes sense at the time) to continue growing my income stream.
My 2023 Income Portfolio Holdings
In June of 2022 it was one of my wisest decisions as an investor to take an in-service rollover from my employer-matched 401k account. I am still employed and receiving a regular paycheck and I continue to make contributions taking advantage of the 3% match on my contributions. However, I wanted to capture the gains from the past 12 years of investing into that 401k and put the cash to work in my IRA using funds that I choose, rather than rely on the limited set of mutual funds that are available in the 401k.
It turns out that June was a good time to deploy a lot of that rollover cash and I managed to adjust my portfolio holdings to essentially triple the value of my IRA while minimizing losses to my 401k account balance. Now, six months later I have just completed a second rollover and increased my IRA account balance again. The total portfolio value of my IRA, including about $35k in cash yet to be deployed, now sits at roughly $200k.
My focus in this IRA portfolio is high yield (greater than 8%+), mostly monthly paying stocks and funds including several BDCs, CEFs, ETFs, and REIT preferred stock shares. I have a total of 37 different holdings, approaching the rule of 42 as described in a recent article from Rida Morwa and his HDO team that I commented on here. The idea behind the rule of 42 is that each holding should represent no more than about 2.5% of the total portfolio value on average to spread the risk of a loss in any single holding and to also diversify the assets in the portfolio to further minimize risk and take advantage of opportunities.
My specific holdings are shown in the table below that is a copy of a spreadsheet that I created from a snapshot of my account, including the unrealized gains and losses based on current market values as of 1/18/23. As you can see in the spreadsheet, the average yield of my holdings is approaching 12%. Given these parameters, I should expect to receive about $24,000 in annual income from my $200k portfolio.
Before anyone begins to criticize or attack me for taking outrageous risks for my retirement, readers need to understand that this IRA account is one of 3 sources of my future income in retirement. The other two include a guaranteed monthly annuity from my employer’s pension plan, and Social Security whenever I decide to start taking it. That is why I refer to it as No Guts No Glory, because I am willing to take the risk to generate the high yield income and continue to increase that income even more by compounding over time.
During the bear market of 2022 and as JPM and PIMCO explain in their 2023 market outlooks, fixed income has been and continues to be the place to park your investment dollars. Recently, I have selected several floating rate funds that benefit from rising interest rates. I have written about some of those funds including PHD and JRO. I also recently reviewed ARDC, which just raised the dividend this month. My most recent article discusses an income fund that “responsible investors” may be interested in. That fund is NPCT and is a relatively new fund from Nuveen that invests in companies that meet certain ESG (environmental, social, and governance) criteria. It offers a yield of 11% and has potential for capital appreciation as well.
My choices are based on my own unique investment objectives, risk tolerance, and reflect my internal values. I am a scientist and information systems manager by occupation, and I have a love of water, the environment, and a desire for a peaceful coexistence with my fellow human beings. I also want to have more control of my personal financial freedom and provide for my family.
The No Guts No Glory portfolio holdings as of January 18, 2023, are shown in this table.
|
Wed Jan 18 2023 10:59:33 pm ET |
||||||
|
Symbol |
Qty |
Cost/share |
Price |
Gain ($) |
Gain (%) |
Yield (%) |
|
AIF |
330 |
12.28312 |
12.78 |
163.97 |
4.05% |
11.47 |
|
AIO |
350.884 |
21.2271 |
17.08 |
-1,455.15 |
-19.54% |
10.44 |
|
ARDC |
460 |
12.88946 |
12.29 |
-275.75 |
-4.65% |
10.58 |
|
BSTZ |
150 |
17.2399 |
17.09 |
-22.48 |
-0.87% |
13.42 |
|
CION |
350 |
10.52525 |
10.62 |
33.16 |
0.90% |
11.59 |
|
CLM |
764.765 |
8.58179 |
7.65 |
-712.6 |
-10.86% |
18.92 |
|
CPZ |
283.659 |
18.40925 |
16.18 |
-632.35 |
-12.11% |
10.34 |
|
CRF |
751.719 |
8.070665 |
7.43 |
-481.6 |
-7.94% |
18.62 |
|
CSWC |
200 |
18.191918 |
18.44 |
49.62 |
1.36% |
11.21 |
|
ECC |
634.61 |
12.04833 |
10.64 |
-893.74 |
-11.69% |
15.73 |
|
EIC |
360 |
14.5305 |
14.13 |
-144.18 |
-2.76% |
13.62 |
|
FTRI |
200 |
14.4199 |
14.33 |
-17.98 |
-0.62% |
7.95 |
|
IGR |
643.601 |
7.12062 |
6.42 |
-450.92 |
-9.84% |
11.08 |
|
JEPI |
117.161 |
55.70847 |
54.93 |
-91.21 |
-1.40% |
11.45 |
|
JRO |
450 |
8.23267 |
8.3 |
30.3 |
0.82% |
10.69 |
|
KREF-A |
160 |
16.68456 |
18.86 |
347.67 |
13.02% |
8.62 |
|
KYN |
450 |
8.922389 |
8.93 |
3.42 |
0.09% |
8.77 |
|
MEGI |
200 |
13.86025 |
14.82 |
191.95 |
6.92% |
8.68 |
|
NPCT |
402.414 |
11.66823 |
11.18 |
-196.47 |
-4.18% |
11.1 |
|
NYMTZ |
170 |
15.36318 |
17.8 |
414.26 |
15.86% |
9.93 |
|
OPP |
590.792 |
9.96664 |
8.85 |
-659.7 |
-11.20% |
13.91 |
|
OXLC |
1,252.84 |
6.25869 |
5.6 |
-825.23 |
-10.52% |
15.99 |
|
PAXS |
300 |
16.61587 |
15.65 |
-289.76 |
-5.81% |
11.4 |
|
PDI |
218.193 |
22.05139 |
20.04 |
-438.87 |
-9.12% |
13.21 |
|
PDO |
381.537 |
14.21136 |
13.72 |
-187.47 |
-3.46% |
11.08 |
|
PHD |
500 |
8.6536 |
8.93 |
138.2 |
3.19% |
11.37 |
|
PMT-C |
160 |
17.55037 |
19.15 |
256.26 |
9.13% |
8.89 |
|
QYLD |
280 |
16.32914 |
16.55 |
61.84 |
1.35% |
13.2 |
|
RA |
250 |
17.2442 |
17.1 |
-36.05 |
-0.84% |
14.02 |
|
RITM-C |
160 |
17.39369 |
19.24 |
295.41 |
10.61% |
8.32 |
|
SJT |
340 |
11.31376 |
10.45 |
-293.68 |
-7.63% |
15.59 |
|
TEAF |
221.255 |
13.56973 |
13.47 |
-22.07 |
-0.73% |
7.96 |
|
TRIN |
200 |
12.121422 |
12.69 |
113.72 |
4.69% |
14.48 |
|
VVR |
1,340 |
3.87299 |
3.85 |
-30.81 |
-0.59% |
9.9 |
|
WDI |
397.105 |
13.47029 |
14.05 |
230.21 |
4.30% |
10.93 |
|
XFLT |
1,028.79 |
7.03825 |
6.71 |
-337.7 |
-4.66% |
13.07 |
|
ZTR |
755.591 |
7.65242 |
6.85 |
-606.3 |
-10.49% |
13.97 |
|
$ (6,772.08) |
11.93 |
|||||
Please provide your comments in the comments section if you found anything that interests you, or if you have suggestions or additional information to offer. I value the opportunity to write for Seeking Alpha and the platform has enabled me to learn a whole new investing approach, partly due to contributions from fellow contributors such as Steven Bavaria who introduced me to his Income Factory approach. If you have not yet read any of his material, I highly recommend this one from a year ago that offers a refresher on his approach. I also really appreciate the contributions from Nick Ackerman who writes about income oriented CEFs/ETFs, many of which I purchased after reading his articles.
There are many other contributors, as well as readers who offer good advice and make excellent comments, and the editors on the SA staff who keep me honest by doing thorough reviews of my articles, often catching minor mistakes or incorrect info. As a writer I am not perfect and as an investor I am always learning, so take what I write with a grain of salt and please do your own due diligence before spending your own investment money on anything that I might recommend.
Good luck to all with your investing future, and I wish you well in 2023 and beyond.
Editor’s Note: This article covers one or more microcap stocks. Please be aware of the risks associated with these stocks.
Be the first to comment