

bloodua
The Chart of the Day belongs to the petroleum tanker company International Seaways (INSW). I found the stock by sorting the Russell 3000 Index stocks first by the most frequent number of new highs in the last month and having a Trend Spotter buy signal, then used the Flipchart feature to review the charts for consistent price appreciation. Since the Trend Spotter first signaled a buy on 10/12, the stock gained 26.42%.
INSW Price vs Daily Moving Averages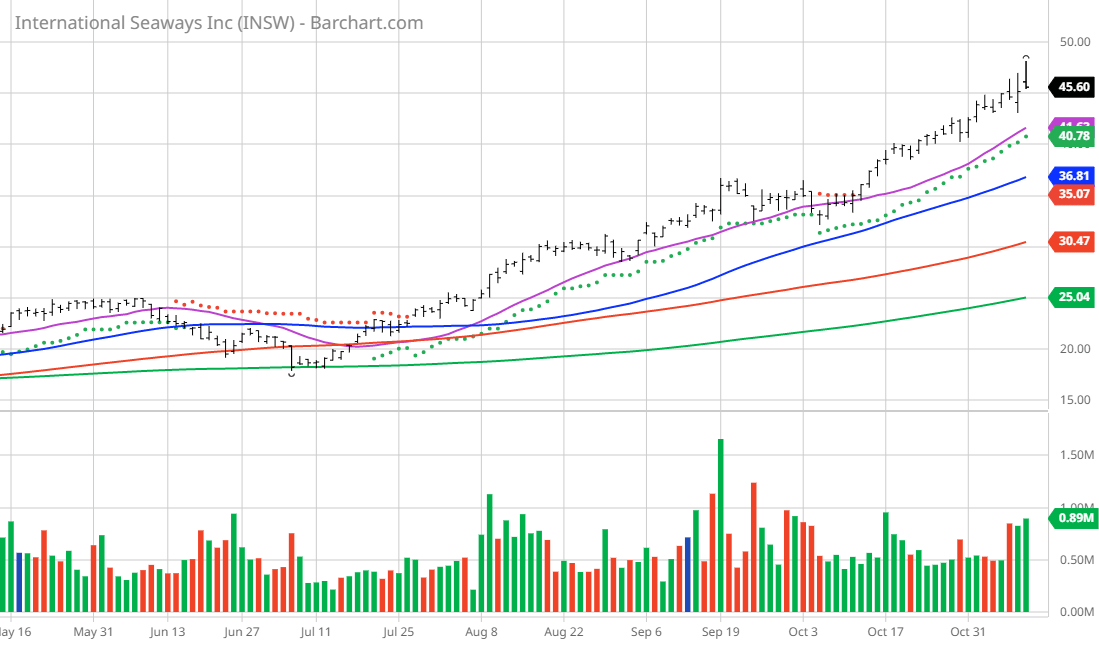
International Seaways, Inc. owns and operates a fleet of oceangoing vessels for the transportation of crude oil and petroleum products in the international flag trade. It operates in two segments, Crude Tankers and Product Carriers. As of December 31, 2021, the company owned and operated a fleet of 83 vessels, which include 12 chartered-in vessels, as well as had ownership interests in two floating storage and offloading service vessels. It serves independent and state-owned oil companies, oil traders, refinery operators, and international government entities. The company was formerly known as OSG International, Inc. and changed its name to International Seaways, Inc. in October 2016. International Seaways, Inc. was incorporated in 1999 and is headquartered in New York, New York.
Barchart’s Opinion Trading systems are listed below. Please note that the Barchart Opinion indicators are updated live during the session every 20 minutes and can therefore change during the day as the market fluctuates. The indicator numbers shown below therefore may not match what you see live on the Barchart.com website when you read this report.
Barchart Technical Indicators:
- 100% technical buy signals
- 203.10+ Weighted Alpha
- 145.16% gain in the last year
- Trend Spotter buy signal
- Above its 20-, 50- and 100-day moving averages
- 19 new highs and up 33.10% in the last month
- Relative Strength Index 77.19%
- Technical support level at 44.67
- Recently traded at $45.60 with 50-day moving average of $36.81
Fundamental factors:
- Market Cap $2.25 billion
- Dividend yield 1.06%
- Revenue expected to grow 196.10% this year and another 4.30% next year
- Earnings estimated to increase 285.90% this year and increase an additional 5.70% next year
Analysts and Investor Sentiment — I don’t buy stocks because everyone else is buying but I do realize that if major firms and investors are dumping a stock it’s hard to make money swimming against the tide:
- Wall Street analysts have 6 strong buy and 1 buy opinions in place on this stock
- Analysts have price targets from $30.00 to $60.00 with an average of $46.14
- 4,660 investors are monitoring this stock on Seeking Alpha
Ratings Summary
Factor Grades
Quant Ranking
Sector
Industry
Oil and Gas Storage and Transportation
Ranked Overall
Ranked in Sector
Ranked in Industry
Quant ratings beat the market »
Dividend Grades
Be the first to comment