

Justin Sullivan
Intel Corporation’s (NASDAQ:INTC) Mobileye segment only represented 1.8% of its total revenue in 2021. Notwithstanding, the segment is Intel’s second fastest growing segment with a 5-year average growth rate of 26.4%, behind its Intel Foundry Services segment with an average 2-year growth rate of 32.5%. In this analysis of Intel, we covered the company following its Mobileye IPO in October 2022 as we are now able to analyze the company more deeply with the additional information that is now available and to determine whether the IPO benefitted Intel and whether Mobileye could continue to benefit Intel, the largest US-based semicon company by revenue, going forward. Moreover, we then analyzed how Mobileye could help Intel continue to reap the AV market growth. Finally, we examined Mobileye’s tech stack and product portfolio to determine whether it has an advantage over competitors. For our conclusion, we updated our forecast for Intel factoring in Mobileye and estimating its contribution to Intel post-IPO and then valued the company based on a DCF analysis to obtain a new price target going into 2023.
Intel, Khaveen Investments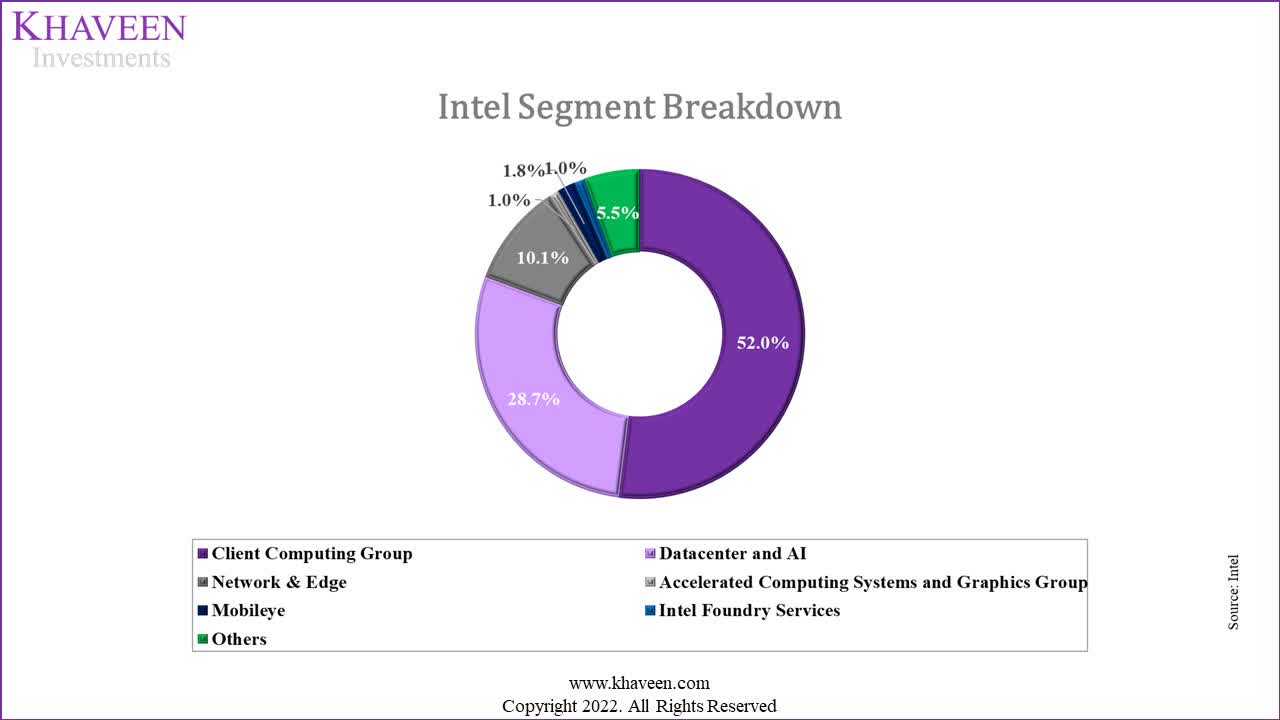
|
Intel Segments |
Revenue ($ mln) |
5-year Growth Rate |
|
Client Computing Group |
41.067 |
4.3% |
|
Datacenter and AI |
22.691 |
8.7% |
|
Network & Edge |
7.976 |
10.2% |
|
Accelerated Computing Systems and Graphics Group* |
0.774 |
13.2% |
|
Mobileye |
1.386 |
26.4% |
|
Intel Foundry Services* |
0.786 |
32.5% |
|
Others |
4.344 |
– |
|
Total |
79.024 |
5.97% |
*2-year average
Source: Intel, Khaveen Investments
Mobileye To Continue as a Strategic Partner Post-IPO
Intel acquired Mobileye in 2017 for $15.3 bln. According to Intel, the company did an IPO for Mobileye because it…
provides the best opportunity to build on Mobileye’s track record for innovation and unlock value for shareholders.
Intel initially targeted the Mobileye IPO for a valuation of $50 bln but reduced it to $16 bln. According to Intel, the company sold 41 mln shares for the IPO for $21 per share. Based on the shares outstanding of Mobileye of 801.9 mln, this translates to a reduction of Intel’s stake in Mobileye by 5.11%. Furthermore, the company offered a 30-day option for underwriters to buy additional shares of 6.15 mln as well as a private placement of 4.76 mln shares. Thus, following the IPO, Intel’s ownership in Mobileye had reduced by a total of 6.47% and still retains 93.53% ownership in Mobileye based on SimplyWallSt.
To determine whether Intel benefitted from the IPO, we compared the company’s acquisition cost of its stake that it had let go of in the IPO with our estimated valuation of Mobileye based on a P/S valuation. We also compared its acquisition cost with its actual proceeds raised from the IPO.
Mobileye, Khaveen Investments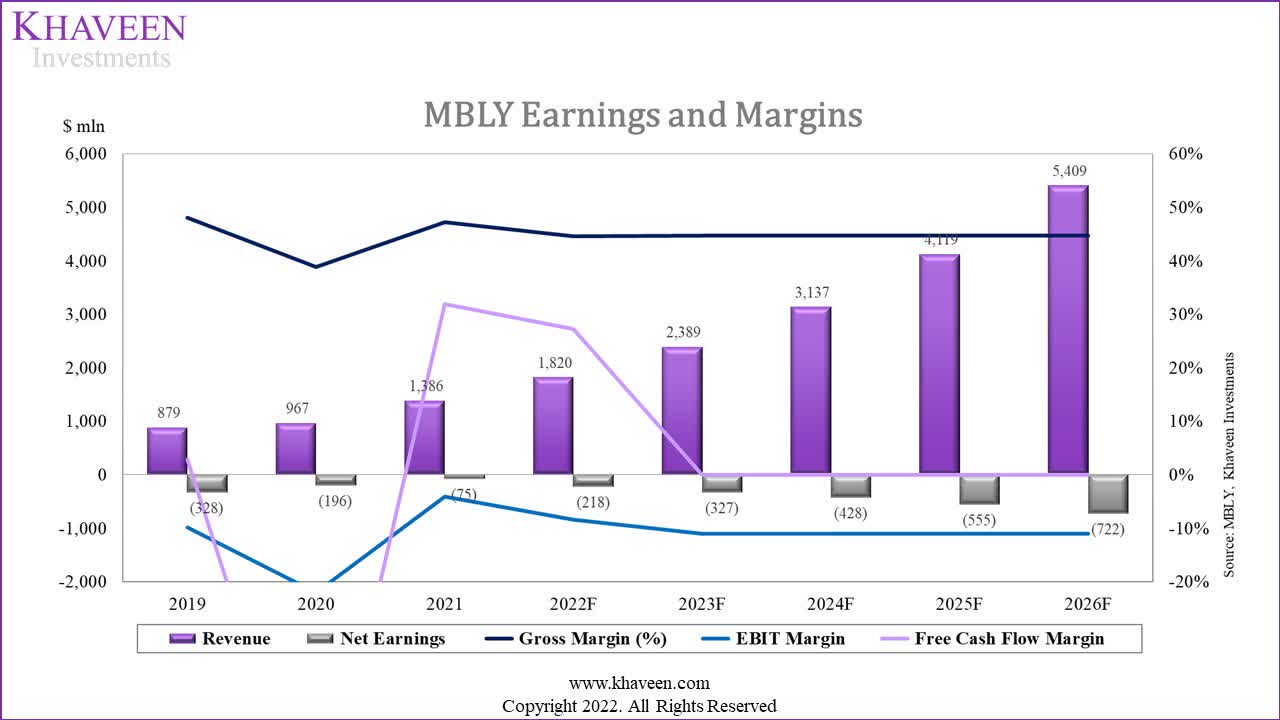
Based on Mobileye’s prospectus, the company is still unprofitable with an average 3-year gross and net margin of 45% and -21% respectively. Though, the company has high growth with a 3-year average of 26%. Thus, we valued the company based on a P/S valuation of its 2021 revenue of $1.3 bln.
SeekingAlpha, Khaveen Investments
|
Intel Mobileye IPO ($ mln) |
100% Stake |
6.47% Stake |
|
Mobileye Acquisition Cost |
15,300 |
990.4 |
|
Mobileye Market Cap on IPO Date |
16,840 |
1,090 |
|
Intel Gain on Mobileye IPO Compared to Acquisition Cost |
1,540 |
99.7 |
|
Our P/S Valuation of Mobileye |
8,733 |
565.3 |
|
Intel Gain on Mobileye IPO Compared to Our Valuation |
8,107 |
525 |
Source: Mobileye, Khaveen Investments
As seen in the table, we calculated the acquisition cost of Intel’s stake in the IPO (6.47%) based on its 2017 Mobileye acquisition cost of $15.3 bln ($990.4 mln). We then valued Mobileye based on its 2021 revenue ($1.3 bln) with a P/S of 6.3x to obtain Intel’s IPO stake valuation of $565.3 mln. Compared with Intel’s actual IPO proceeds of $861 mln, its acquisition value of $990.4 mln is lower with a gain to Intel of $99.7 mln. Also, comparing Intel’s IPO proceeds of $861 mln with our valuation of its IPO stake, we obtained a gain of $525 mln for Intel.
Furthermore, according to Intel, the company will remain a strategic partner for Mobileye despite the IPO.
Intel will remain the majority owner of Mobileye, and the two companies will continue as strategic partners, collaborating on projects as they pursue the growth of computing in the automotive sector. – Intel
In Mobileye’s prospectus, the term “Intel” was mentioned 838 times. According to Mobileye, the company partners with Intel for product development including “frequency-modulated continuous wave (“FMCW”) lidar” to enhance its sensor performance and had…
historically relied on Intel to provide certain development services, including research, technical work on technology, products and solutions, construction and ancillary administrative services and use of space in Intel’s building in Israel.
Moreover, the company expects to continue leveraging Intel’s facilities in Jerusalem such as data centers and workshops as well as facilities in the US, Germany and China. In addition, post-acquisition, the company entered into a Technology and Services Agreement and a LiDAR Product Collaboration Agreement with Intel. Thus, we believe this highlights the significance of the relationship between Intel and Mobileye due to their partnership for R&D activities such as with lidar technology, administration services and sharing of Intel’s facilities for Mobileye.
Also, we previously highlighted that Intel was focusing on expanding into foundry services and we believe this could lower the risk for Mobileye to secure supply from Intel should the company be affected by semicon shortages as it currently depends on TSMC (TSM). For Intel, we also expect it to benefit its IFS segment by providing foundry services to Mobileye and generating additional revenues.
Overall, Intel continues to retain a significant ownership stake (93.53%) over Mobileye following its IPO in October 2022. We believed Intel benefitted with a gain of $99.7 mln from the IPO from its proceeds raised of $861 mln compared to its acquisition cost of $782 mln. Moreover, we calculated a gain of $525 mln for its IPO compared to our valuation of its stake in Mobileye. Going forward, we believe Intel could continue to be a significant partner for Mobileye which it highlighted partnered with the company for product development including radar technologies and leveraged its relationship with Intel for the use of its facilities in Israel, the US, Germany and China. Moreover, we expect the company to leverage its relationship with Intel as it focuses on its foundry expansion and reduces its dependence on TSMC.
Mobileye Continues to Help Intel Reap AV Market Growth
According to Intel, Mobileye is a global leader in ADAS and autonomous driving solutions. Based on Mobileye’s prospectus, the company’s revenue is broken under two reportable segments which are EyeQ SoC and aftermarket products.
Mobileye, Khaveen Investments
Based on the chart above, Mobileye’s revenue comprises 94% of EyeQ SoC revenue in 2021 whereas Aftermarket products represented the remainder (6%) of its total revenue.
We then compiled the market share for Intel and its top autonomous processor competitors including Nvidia, Qualcomm, NXP and TI by extracting their automotive revenue for each company and further segmenting it based on an estimated % breakdown of its product type for automotive ADAS processors.
|
Market Share |
Revenue (2021) |
Share |
|
Mobileye (Intel) |
1,386 |
20.2% |
|
NVIDIA (NVDA) |
566 |
8.3% |
|
Qualcomm (QCOM) |
975 |
14.2% |
|
NXP (NXPI) |
824 |
12.0% |
|
Texas Instruments (TXN) |
639 |
9.3% |
|
Total |
6,850 |
100.0% |
Source: Company Data, Khaveen Investments
Based on the market share chart above, Intel Mobileye has a market share of 20.2%. Besides Intel, the company is trailed by Qualcomm with a market share of 14.2% and NXP with a market share of 12%. Moreover, we compared Mobileye’s SoCs (EyeQ Ultra) with competitors such as Nvidia DRIVE Orin, Qualcomm Snapdragon Ride, NXP R32, and Texas Instruments TDA Jacinto in terms of spec performance such as TOPS, process node, number of cores, power consumption and ADAS support level to determine whether it has an advantage over its competitors. We also compared the number of automaker customer relationships of each company.
|
SoC Comparison |
Automaker Customers |
Max ADAS Level Support |
TOPS |
Process |
Cores |
Power Efficiency |
|
Mobileye (Intel) |
38+ |
Level 5 |
176 |
5nm |
12 |
<100W |
|
Nvidia |
27 |
Level 5 |
254 |
7nm |
12 |
70W |
|
Qualcomm |
19 |
Level 5 |
700+ |
4nm |
16 |
130W |
|
NXP |
8 |
Level 2+ |
1 |
16nm |
7 |
<10W |
|
Texas Instruments |
35 |
Level 3 |
8 |
16nm |
6 |
<20W |
Source: Mobileye, NVIDIA, Qualcomm, NXP, Forbes, Fierce Electronics, Khaveen Investments
In the table above, we compiled the specs of Mobileye’s latest EyeQ 6 Ultra which is expected to launch in 2024 according to Intel. In terms of automaker customer relationships, Mobileye has the highest at 38+ followed by Texas Instruments. In terms of ADAS level support of their SoCs, Mobileye, Nvidia and Qualcomm are tied at Level 5 ADAS. However, Qualcomm’s Snapdragon Ride and Nvidia’s Orin SoCs surpass Intel with a higher TOPS performance compared to the EyeQ 6 Ultra with Qualcomm having the highest at 700+ according to Qualcomm. In terms of process node, Qualcomm’s SoC is made with the most advanced node at 4nm followed by Mobileye at 5nm. Qualcomm also has the highest number of cores using 16 cores. Furthermore, in terms of power efficiency, NXP has the lowest at below 10W thus indicating its superior power efficiency while Qualcomm has the highest at 130W. Overall, despite Mobileye having the highest number of customers, we believe Qualcomm has the overall performance advantage as it had the highest ranking in 3 out of the 5 compared performance metrics.
|
AV Market Forecast |
2021 |
2022F |
2023F |
2024F |
2025F |
2026F |
2027F |
2028F |
2029F |
2030F |
|
Global Vehicle Sales (‘mln’) |
82.68 |
84.3 |
86.0 |
87.7 |
89.5 |
91.3 |
93.1 |
95.0 |
96.9 |
98.8 |
|
Growth % |
5.0% |
2% |
2% |
2% |
2% |
2% |
2% |
2% |
2% |
2% |
|
AV penetration rate |
0.06% |
0.08% |
0.10% |
0.13% |
0.17% |
0.22% |
0.28% |
0.36% |
0.47% |
0.60% |
|
Growth % |
28.7% |
28.7% |
28.7% |
28.7% |
28.7% |
28.7% |
28.7% |
28.7% |
28.7% |
|
|
AV Units (‘mln’) |
0.05 |
0.07 |
0.09 |
0.12 |
0.15 |
0.20 |
0.26 |
0.34 |
0.45 |
0.59 |
|
Growth % |
31.3% |
31.3% |
31.3% |
31.3% |
31.3% |
31.3% |
31.3% |
31.3% |
31.3% |
Source: OICA, Fortune Business Insights, S&P Global, Khaveen Investments
Based on the table above, the AV market is forecasted to grow at a CAGR of 31.3%. The penetration rate of AV was 0.06% in 2021 based on the total vehicle sales of 82.68 mln and we calculated it to increase to 0.6% by 2030 based on the total vehicle market growth forecast of 2% by McKinsey.
|
Mobileye Revenue ($ mln) |
2021 |
2022F |
2023F |
2024F |
2025F |
|
EyeQ SoC |
1,303 |
1,711 |
2,246 |
2,949 |
3,872 |
|
Growth % |
31.3% |
31.3% |
31.3% |
31.3% |
|
|
Aftermarket Products |
83 |
109 |
143 |
188 |
247 |
|
Growth % |
31.3% |
31.3% |
31.3% |
31.3% |
|
|
Total |
1,386 |
1,820 |
2,389 |
3,137 |
4,119 |
|
Growth % |
31.3% |
31.3% |
31.3% |
31.3% |
Source: Company Data, Khaveen Investments
Overall, we determined that Mobileye has the highest number of automaker customers with 38+ customer relationships. However, we believe that Qualcomm has the performance advantage over its competitors as it had the highest ranking in 3 out of the 5 compared performance metrics including TOPS, process node and the number of cores in its SoCs. Notwithstanding, we believe that while Mobileye’s SoC performance is behind Qualcomm and Nvidia, it is still ahead of NXP and Texas Instruments, placing it in the middle of its competitors. Thus, we believe our forecasts for its revenue based on the market growth rate of 31.3% through 2025 are appropriate as we expect the company to perform averagely compared to competitors.
Mobileye Competitive Advantage from its End-to-End Full Stack Solutions
Mobileye has a technology platform that is…
built to enable the full stack of autonomous solutions.
Intel Intel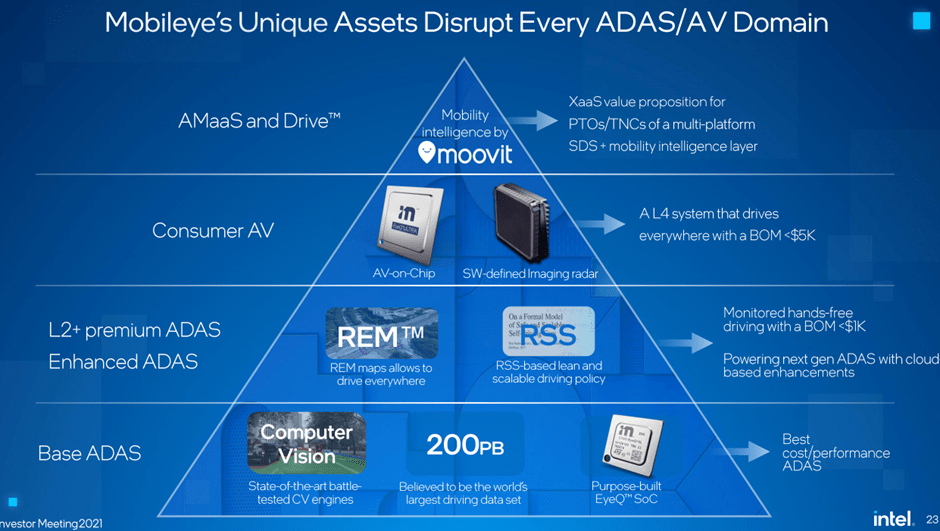
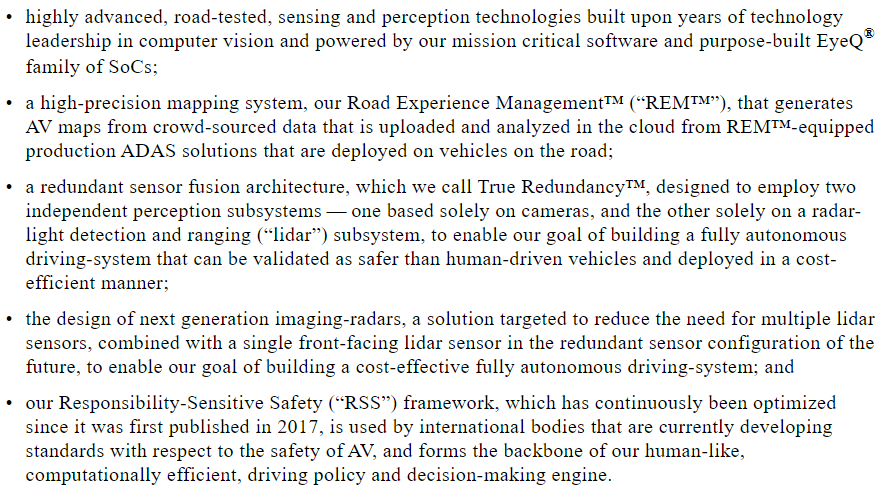
Based on the image above, the company’s solutions include its EyeQ SoCs. Besides that, the company also has its REM mapping system which crowdsources data from AV vehicles. According to TechCrunch, Intel’s REM mapping system can be used to “support in ADAS and autonomous driving systems” and had agreements with several automakers such as BMW (OTCPK:BMWYY), Nissan (OTCPK:NSANY) and Volkswagen (OTCPK:VWAGY) to collect data from vehicles with their SoCs. In addition, the company also has camera-based radar and lidar systems. Moreover, the company has also developed its RSS framework which is a…
math-based AV safety model that provides a framework for digitization of these implicit rules so self-driving cars can successfully integrate with human drivers on the road.
Intel
Furthermore, they stated that the company provides a…
range of ADAS solutions supporting not only base features to meet global regulatory requirements and safety ratings, but also higher-function cloud-enhanced feature sets including crowd-sourced maps and eyes-on/hands-free point-to-point assisted driving solutions.
Additionally, the company’s portfolio also includes more advanced driver assist applications. On top of that, Mobileye is also focusing on robotaxis in partnership with OEMs.
We compared Mobileye’s tech stack against its competitors based on mapping software, radar, lidar, road safety standard framework and Robotaxi capabilities.
|
Company |
Mapping Software |
Radar |
Lidar |
RSS Framework |
Robotaxi |
|
Mobileye (Intel) |
Yes |
Yes |
Yes |
Yes |
Yes |
|
Nvidia |
Yes |
Yes |
Yes |
Yes |
N/A |
|
Qualcomm |
Yes |
Yes |
Yes |
N/A |
N/A |
|
NXP |
N/A |
Yes |
Yes |
N/A |
N/A |
|
Texas Instruments |
N/A |
Yes |
Yes |
N/A |
N/A |
Source: Company Data, Khaveen Investments
Based on the table, Mobileye has the highest number of AV solutions including mapping software, radar, lidar, road safety standard framework and robotaxi capabilities. Nvidia trails Mobileye with its Nvidia DRIVE mapping system, radar and lidar integration and its own Safety Force Field to rival Mobileye’s RSS framework. This is followed by Qualcomm, NXP and Texas Instruments.
Overall, we believe that Mobileye has the overall full stack advantage in AV solutions with the highest number of AV capabilities over competitors. This is due to its portfolio of AV solutions such as its REM mapping system, radar and lidar integration, RSS framework and robotaxi through its Moovit acquisition.
Risk: In-House Chip Development by Customers
According to Wired, Tesla (TSLA) is developing its own custom self-driving chips for its AVs. Additionally, Nvidia had previously switched from Nvidia in 2019. Other automakers including GM Cruise (GM) as well as Volkswagen are also developing their own chips instead of using Nvidia’s chips according to Reuters. We believe that this could pose a threat to semicon companies including Mobileye as the automakers are its customers and thus future development of in-house custom AV chips could threaten Mobileye’s revenue growth. Notwithstanding, we note that Intel and Mobileye had entered into partnerships with several leading automakers such as BMW, Nissan and Volkswagen which we believe lack capabilities to companies such as Tesla.
Valuation
We updated our revenue projections for Intel for its Mobileye segment which we forecasted to grow at a CAGR of 31.3% through 2025 as discussed above but prorated by Intel’s ownership stake of 93.53% post-IPO. Overall, we forecasted it to have a 5-year forward average growth of 7.3% which is unchanged compared to our previous analysis as Mobileye only represented a small portion of Intel’s revenue (1.8%).
|
Intel Revenue Projections ($ bln) |
2021 |
2022F |
2023F |
2024F |
2025F |
|
Client Computing Group |
41.067 |
34.25 |
37.23 |
39.71 |
41.56 |
|
Growth % |
1.3% |
-16.6% |
8.7% |
6.7% |
4.7% |
|
Datacenter and AI |
22.691 |
24.71 |
29.25 |
32.79 |
34.73 |
|
Growth % |
-3.1% |
8.9% |
18.3% |
12.1% |
5.9% |
|
Network & Edge |
7.976 |
10.00 |
12.32 |
14.93 |
17.77 |
|
Growth % |
11.8% |
25.4% |
23.2% |
21.1% |
19.0% |
|
AXG |
0.774 |
1.05 |
1.21 |
1.39 |
1.58 |
|
Growth % |
18.9% |
35.4% |
15.7% |
14.6% |
13.6% |
|
Mobileye |
1.386 |
1.70 |
2.23 |
2.93 |
3.85 |
|
Growth % |
43.3% |
31.3% |
31.3% |
31.3% |
31.3% |
|
IFS |
0.786 |
2.61 |
3.14 |
3.69 |
4.26 |
|
Growth % |
9.9% |
232.0% |
20.3% |
17.5% |
15.4% |
|
Others |
5.019 |
0 |
0 |
0 |
0 |
|
Intersegment Revenue |
-0.675 |
-0.675 |
-0.675 |
-0.675 |
-0.675 |
|
Total |
79.02 |
73.65 |
84.71 |
94.77 |
103.07 |
|
Growth % |
1.5% |
-6.8% |
15.0% |
11.9% |
8.8% |
Source: Company Data, Khaveen Investments
Based on a discount rate of 6.9%, our model shows its shares are undervalued by 140%.
Khaveen Investments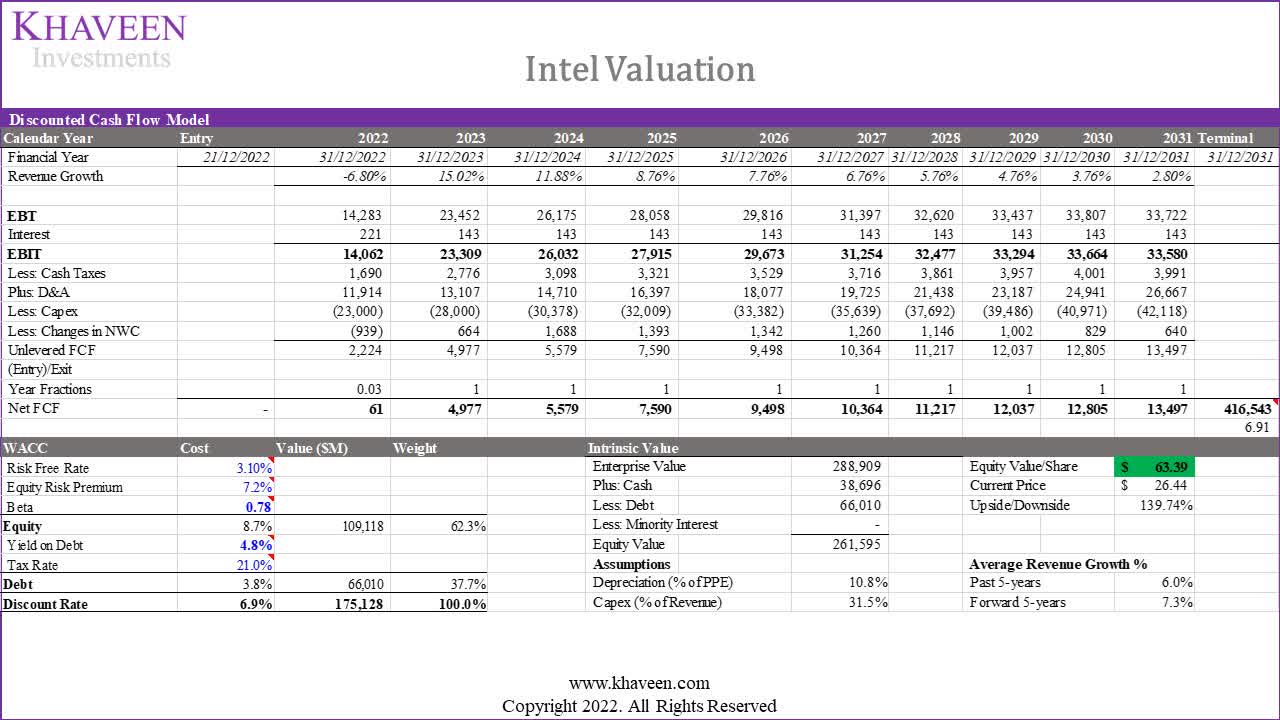
Verdict
After its IPO, Intel continues to retain a significant ownership stake (93.53%) in Mobileye. We believe Intel benefitted with a gain of $99.7 mln from the IPO from its proceeds raised of $861 mln compared to its acquisition cost of $990.4 mln. Moreover, we calculated a gain of $525 mln for its IPO compared to our valuation of its stake in Mobileye of $565.3 mln.
Going forward, we believe Intel could continue to be a significant partner for Mobileye as it partnered with the company for product development including radar technologies and leveraged its relationship with Intel for the use of its facilities in Israel, the US, Germany and China. Moreover, we expect the company to leverage its relationship with Intel as it focuses on its foundry expansion and reduces its dependence on TSMC.
Furthermore, Mobileye has the highest number of automaker customers among competitors with 38+ customer relationships. While we believe that Qualcomm has the performance advantage over Mobileye and its competitors as it had the highest ranking in 3 out of the 5-performance metrics including TOPS, process node and the number of cores in its SoCs, we believe that while Mobileye’s SoC performance is behind Qualcomm and Nvidia, it is still ahead of NXP and Texas Instruments, placing it in the middle of its competitors. Thus, we based our forecasts for its revenue based on the market growth rate of 31.3% through 2025.
Additionally, we believe Mobileye has the overall full stack advantage in AV solutions with the highest number of AV capabilities over competitors. This is due to its portfolio of AV solutions such as its REM mapping system, radar and lidar integration, RSS framework and robotaxi capabilities.
Overall, we expect Mobileye to continue benefiting Intel and projected its growth based on the AV market forecast growth rate of 31.3% through 2025. However, as Mobileye still contributed only a small portion (1.8%) of revenue, our average 5-year forward revenue growth forecast for Intel remains at 7.3%. Notwithstanding, we obtained a higher upside for the company of 140% with a price target of $63.39 compared to our previous analysis as its stock price had declined by 10% since our last coverage.
In terms of its P/FCF ratio, the company’s ratio had declined to 15.58x based compared to its 5-year average of 16.95x.

Thus, we believe Intel, the largest US-based semicon company, although faced with growth headwinds in the industry this year which declined by 36% YTD, is the best pick for 2023 with a massive upside opportunity of 140% based on DCF as well as its share price trading below its 5-year average P/FCF ratio. All in all, we continue to rate the company as a Strong Buy.
Editor’s Note: This article was submitted as part of Seeking Alpha’s Top 2023 Pick competition, which runs through December 25. This competition is open to all users and contributors; click here to find out more and submit your article today!
Be the first to comment