

Alexander Koerner
Since our previous analysis of Intel Corporation (NASDAQ:INTC), the company had recently confirmed its plan to raise prices for its products due to increasing cost pressures. This is following Nikkei Asia’s report of price increases involving:
a majority of its microprocessors and peripheral chip products later this year.
However, Nikkei Asia also reported that:
the percentage increases have not been finalized, and could be different for different types of chips, but are likely to range from a minimal single-digit increase to more than 10% and 20%.
Thus, in this analysis, we determined the potential impact of the price hike on Intel’s CPU microprocessors and projected its total revenue growth for PC and data center segments in addition to a revised projection for its ASPs based on our previous analysis of Advanced Micro Devices (AMD). There, we previously compiled its CPU products pricing and obtained the average pricing of a total of 141 CPU products consisting of 81 Intel CPUs and 60 AMD CPUs.
Moreover, we examined how the potential price hike could benefit Intel besides CPUs as the report indicated its other products could also see a price hike. We analyzed the pricing across different generations of Intel’s NEX segment products including IoT processors, ethernet adapters and silicon photonics. We then projected the segment’s revenue growth based on shipments and ASP growth.
Lastly, we looked into the company’s GPU business as it is expected to launch in August and had recently just released its Arc 380 GPU in China and updated our revenue projections.
Price Hike Boost CPU ASP
As mentioned above, Intel had recently confirmed its plan to increase prices for its products and while the percentage increase had not been finalized according to Nikkei Asia’s report, it is expected to range from
a minimal single-digit increase to more than 10% and 20%.
We compiled the reported price increase besides Intel in the semiconductor industry including foundries TSMC and Samsung as well as AMD, Nvidia, Texas Instruments and Broadcom.
*2023
Source: Tom’s Hardware, Bloomberg, WCCF Tech. DigiTimes, Khaveen Investments
From the table above, we obtained an average price increase of 11.7%. TSMC was reported in 2021 to be raising its foundry quotes between 10% to 20% (15% at the midpoint) while Samsung was reported recently by Bloomberg to also be increasing its foundry quotes between 15% to 20% this year. In our previous analysis of TSMC, we analyzed its pricing up to Q2 2022 and forecasted its full-year increase based on its prorated growth at 26% in 2022. Moreover, DigiTimes had previously reported that AMD and Nvidia CPUs and GPUs could increase by up to 20% with the increasing foundry quotes from TSMC. Furthermore, Texas Instruments was reported to be raising its prices by 10% for “specific ICs, such as those for servers” and Broadcom between 6% to 8% for network communication chips starting in 2023.
Overall, we believe Intel’s price hike is not that surprising given the reported price hikes by competitors across the industry. Moreover, we had previously anticipated price increases by Intel for its CPU products from our previous analysis on AMD, where we compiled both Intel and AMD CPU products’ pricing and obtained the average pricing. From that analysis,
we looked into the pricing from PassMark of 81 Intel CPUs and 60 AMD CPUs for a total of 141 products and charted out the average pricing for the product generations by each company below.
PassMark, Khaveen Investments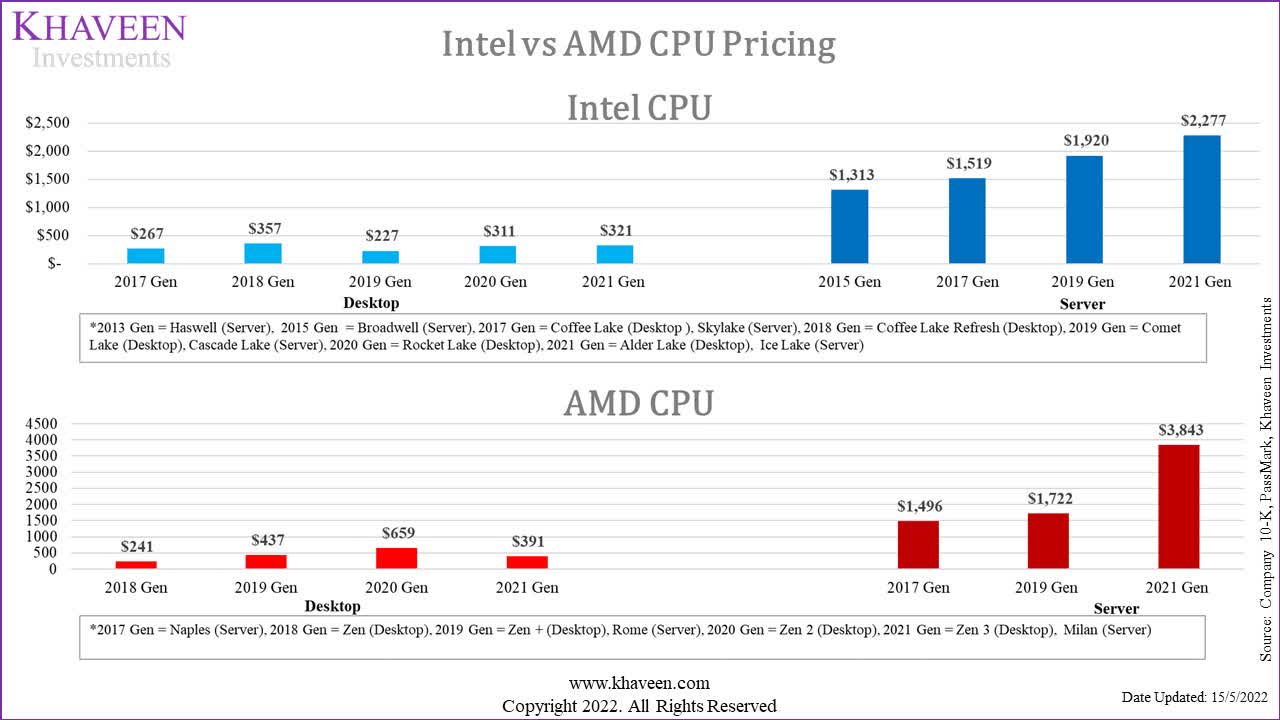
|
Average CPU Pricing Change % |
2018 |
2019 |
2020 |
2021 |
Average |
|
Intel Desktop |
33.90% |
-36.40% |
36.90% |
3.20% |
9.40% |
|
Intel Server |
15.70% |
26.50% |
18.60% |
20.20% |
|
|
AMD Desktop |
81.50% |
50.80% |
-40.60% |
30.60% |
|
|
AMD Server |
15.20% |
123.10% |
69.10% |
Source: PassMark, Khaveen Investments
From the chart and table above, Intel’s desktop and server CPUs have lower average prices than AMD and have lower average growth (9.4%) for desktops and (20.2%) for servers. AMD’s average desktop CPU price declined in 2021 because of limited data of its premium Ryzen Threadripper models but its average prices were still higher than Intel. In our previous analysis of Intel,
we determined that AMD had a performance advantage and its average increase in scores was higher than Intel for all product categories. Thus, we believe the growth in its pricing reflects its increase in product performance as measured by the benchmark scores.
Based on the reported price increase for Intel of “a minimal single-digit increase to more than 10% and 20%,” we believe our price increase assumption from our previous analysis of 9.4% for its PC CPUs is still appropriate as it is in between the lower end of the reported price increase range. Additionally, Intel’s latest earnings briefing highlighted its CPUs for its CCG segment were up by 11%. Thus, we continue to base our desktop and notebook CPU ASP growth forecast on the 9.4% growth while the company’s 13th Gen Raptor Lake Processors are expected to be launched in October 2022 but have yet to be given an official launch date according to Tom’s Hardware.
Intel hasn’t given an official launch date for Raptor Lake yet, but all signs point to a Q4 2022 launch. Our own sources tell us that we’ll see an announcement in late September, but the launch will land in mid-to-late October. – Tom’s Hardware
Moreover, we continue to base our server CPU ASP growth forecast on our derived average of 20.2% which is in line with the top end of the reported price increase of more than 20%. This is as the company is expected to release its next-gen server CPUs (Granite Rapids) by the end of the year and management also highlighted the pricing impact towards Q4. Moreover, its competitor AMD was reported to increase prices by up to 20%.
Lastly, we updated our revenue projections for its CCG platform (notebook and desktop) and DCAI segment revenue growth in the table below with a lower shipment forecast for notebooks and desktops as the PC market is forecasted to decline by 8.2% by the IDC. Additionally, we based our forecast for the server market shipment growth of 5.1% according to Trendforce. For our assumption of Intel’s shipments in 2022 (Desktop and Notebook), we adjusted our shipments growth estimates by taking an average of Intel’s actual Q1 and Q2 growth rates as its shipments had declined by between -11% to -38% and our shipment forecast of -9.5% (Desktop) and -8.9% (Notebook) for the remaining quarters. In terms of ASP, we factored in our analyzed pricing increase for all 3 segments in 2022 but prorated by 0.25 as management highlighted the pricing increase effect in Q4. Beyond 2022, we based its ASP growth on our derived average but tapered down by 2% for PC and 6% for server as a conservative assumption.
And then third, we are increasing pricing. The pricing generally takes effect in the fourth quarter. – Pat Gelsinger, Chief Executive Officer
|
Desktop |
2022F |
2023F |
2024F |
2025F |
|
Market Shipment Growth % |
-8.2% |
1.4% |
1.4% |
1.4% |
|
Intel’s Share of Growth |
– |
0.86 |
0.86 |
0.86 |
|
Desktop Volume |
-12.3% |
1.2% |
1.2% |
1.2% |
|
Desktop ASP Growth % |
2.4% |
7.4% |
5.4% |
3.4% |
|
Revenue Growth % |
-10.2% |
8.7% |
6.6% |
4.6% |
|
Revenues |
10,629 |
11,549 |
12,315 |
12,882 |
|
Notebook |
2022F |
2023F |
2024F |
2025F |
|
Market Shipment Growth % |
-8.2% |
1.4% |
1.4% |
1.4% |
|
Intel’s Share of Growth |
– |
0.92 |
0.92 |
0.92 |
|
Volume |
-22.7% |
1.2% |
1.2% |
1.2% |
|
ASP |
2.4% |
7.4% |
5.4% |
3.4% |
|
Revenue Growth % |
-20.9% |
8.7% |
6.7% |
4.7% |
|
Revenues |
20,155 |
21,916 |
23,388 |
24,485 |
|
Server |
2022F |
2023F |
2024F |
2025F |
|
Market Shipment Growth% |
5.1% |
5.1% |
5.1% |
5.1% |
|
Intel’s Share of Growth |
0.71 |
0.71 |
0.71 |
0.71 |
|
Volume |
3.6% |
3.6% |
3.6% |
3.6% |
|
ASP |
5.1% |
14.2% |
8.2% |
2.2% |
|
Revenue Growth % |
8.9% |
18.3% |
12.1% |
5.9% |
|
Revenues |
24,714 |
29,246 |
32,791 |
34,726 |
Source: Intel, Khaveen Investments
Overall, despite the large declines in shipment growth in 2022, we believe the reported price increase could provide a cushion to Intel. This is as the industry is expected to increase prices by an average of 11.7%. The reported price hike by Intel is unsurprising to us as we had previously analyzed and determined the average price increase for Intel’s CPUs at 9.4% (PC) and 20.2% (server). We continue to base our projections for its PC CPUs ASP on our derived growth rate of 9.4% (prorated by 4 quarters) which is in line with the lower end of the reported price increase. Additionally, we retained our ASP projection for its server CPUs, but prorated by 4 quarters, as the company is expected to ramp up its next-gen server CPU this year.
Price Hike Also Supports NEX segment growth
Besides its CPUs, the reported price hike is also for other Intel products such as Wi-Fi and other connectivity according to Nikkei Asia.
The biggest U.S. chipmaker plans to raise prices this autumn on flagship products such as central processing units for servers and computers, where it dominates the market, as well as on a wide range of other items, including chips for Wi-Fi and other connectivity, according to three industry executives with direct knowledge. – Nikkei Asia
We previously broke down its new NEX segment revenue according to its major product groups in both logic and DAO markets including processors
based on the previous revenue breakdown of its IOTG segment as well as ethernet adapters and silicon photonics-based on its market share and estimated market sizes for each product.
Intel, Omdia, Yole Development, Khaveen Investments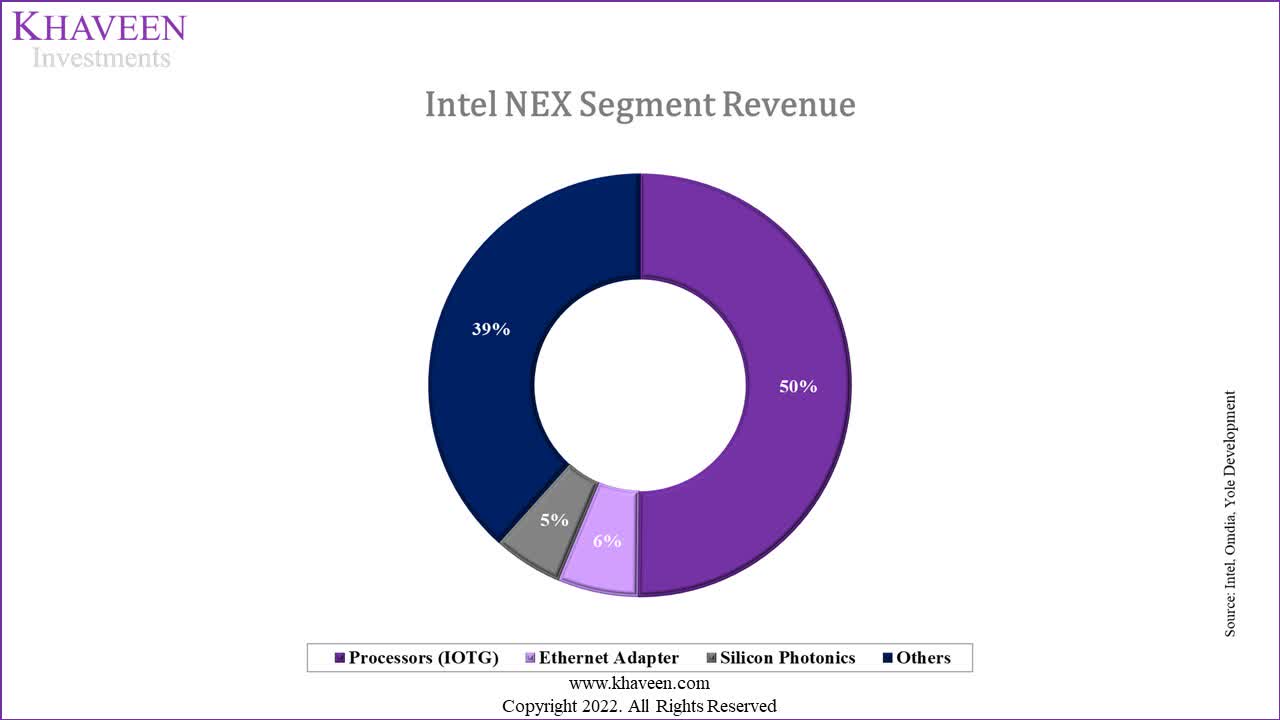
Moreover, we then analyzed the average price difference between different product generations of Intel’s Internet of Things (“IoT”) processors with its Intel Atom product line, silicon photonics and ethernet adapters. For its IoT processors, we compiled a total of 11 products across different Intel Atom generations, 2 for silicon photonics and 10 for ethernet adapters.
|
IoT Processors |
2016 |
2018 |
2020 |
2021 |
Average |
|
Average Price ($) |
30.00 |
36.75 |
51.50 |
54.80 |
|
|
Growth % |
22.5% |
40.1% |
6.4% |
23.0% |
|
|
Silicon Photonics |
2020 |
2021 |
Average |
||
|
Average Price ($) |
630 |
746 |
|||
|
Growth % |
18% |
18% |
|||
|
Ethernet Adapters |
2017 |
2019 |
2020 |
2021 |
Average |
|
Average Price ($) |
300.3 |
313 |
521 |
869.5 |
|
|
Growth % |
4.2% |
66.5% |
66.9% |
46% |
Source: Intel, Colfax Direct, Khaveen Investments
Based on the table above, the product with the highest average price increase is ethernet adapters at 46% followed by IoT processors (29.3%) and silicon photonics (18%). Compared to the reported price increase, our calculated average price increase for IoT processors and silicon photonics would coincide with the top range of the reported price increase of “a minimal single-digit increase to more than 10% and 20%”. However, the ethernet adapters have a higher average price increase of 46%.
|
Intel NEX Segment Products |
ASP |
Shipments |
Total Growth Forecast |
Previous Forecast |
|
IoT Processors |
29.3% |
12% |
44.8% |
8.20% |
|
Silicon Photonics |
18% |
6.9% |
26.6% |
25.80% |
|
Ethernet Adapters |
46% |
6.9% |
55.9% |
33.50% |
Source: Intel, Khaveen Investments
Furthermore, we then calculated an estimated growth rate of each product based on ASP growth and unit shipment growth. For IoT processors, we based its growth on the IoT devices forecasted CAGR of 12% and server shipment CAGR of 5.1% for silicon photonics and ethernet adapters as these products are mainly used in data centers. In total, our calculated growth rate for ethernet adapters is the highest at 55.9% followed by IoT processors and silicon photonics. In comparison with our previous forecast, ethernet adapters also had the highest market forecast CAGR among the 3 products. The largest difference is IoT processors, which have the lowest forecast CAGR of 8.2%. We then updated our revenue projections for Intel’s NEX segment with our calculated growth rates based on ASP but tapered down by 3% as a conservative assumption and unit shipment growth.
|
NEX Segment Revenue ($ mln) |
2021 |
2022F |
2023F |
2024F |
2025F |
2026F |
|
Processors (‘IOTG’) |
3,442 |
4,627 |
6,063 |
7,743 |
9,627 |
11,647 |
|
Growth % |
34.4% |
31.1% |
27.7% |
24.3% |
21.0% |
|
|
Ethernet Adapter |
495.2 |
744 |
1,093 |
1,572 |
2,211 |
3,041 |
|
Growth % |
50.1% |
47.0% |
43.8% |
40.7% |
37.5% |
|
|
Silicon Photonics |
422.3 |
512 |
605 |
696 |
778 |
846 |
|
Growth % |
11.8% |
21.3% |
18.1% |
15.0% |
11.8% |
8.7% |
|
Others |
3,617 |
4,116 |
4,561 |
4,918 |
5,154 |
5,248 |
|
Growth % |
13.8% |
10.8% |
7.8% |
4.8% |
1.8% |
|
|
Total |
7,976 |
9,998 |
12,323 |
14,928 |
17,771 |
20,781 |
|
Growth % |
11.8% |
25.4% |
23.2% |
21.1% |
19.0% |
16.9% |
Source: Intel, Khaveen Investments
Furthermore, according to management from its latest earnings briefing, the company highlighted its confidence in the NEX segment’s growth for the remainder of the year.
For NEX we expect another record quarter in Q3 and continued growth throughout the year. NEX revenue tailwinds will be fueled by new product introductions, data center and Telco Networking demand and continued improvement in pricing and component supply. – Dave Zinsner, Chief Financial Officer
All in all, as the reported price increase mentioned that other Intel products besides processors including connectivity could be included, we analyzed the average pricing increase of Intel’s IoT processors, silicon photonics and ethernet adapter products. Based on our analysis, all 3 product groups had positive average price increases with ethernet adapters the highest at 46%. We updated our revenue projections for the company’s NEX segment from our previous analysis with the latest based on ASP growth and unit shipment growth, resulting in a higher growth forecast at a 5-year average of 21.1% compared to 16.7% previously.
Price Hike for GPU Could Boost Growth
Furthermore, while the reported price increase did not mention GPUs specifically but instead “microprocessors” which includes both CPU and GPUs, we believe that Intel’s GPUs could also be included in the price hike as its competitors, Nvidia and AMD (GPU market leaders), were also reported to be increasing its GPU prices by up to 20% by DigiTimes with the increasing quotes for process nodes by TSMC. Also, in the same report, Intel was also mentioned as it could increase its prices. Additionally, Intel’s GPUs are also manufactured with TSMC’s 7nm process.
Intel’s desktop GPUs had been delayed and are expected to be released in August 2022. However, its A380 model had already launched in the China market in June. Notwithstanding, according to WCCF Tech, Intel’s desktop GPU prices were reportedly leaked and we compiled the midpoint pricing range for each GPU model in the table below.
|
Intel Arc GPU |
Average Price (Midpoint) |
|
A770 |
374 |
|
A750 |
314 |
|
A580 |
225 |
|
A380 |
137 |
|
A310 |
100 |
|
Average |
230 |
Source: WCCF Tech, Khaveen Investments
Based on the table above, we obtained an average price of $230 for Intel’s Arc desktop GPUs based on the reported prices by WCCF Tech. Additionally, we factored in a possible price increase for Intel of 20% based on the reported price increase for Nvidia and AMD. This gives us an ASP assumption of $276 for Intel in 2022. Moreover, based on its latest earnings briefing, management indicated that it will not hit its previous GPU shipment target of 4 mln in 2022 but did not disclose its impact or new target. We updated our revenue projections with a 5% lower unit shipment target and higher ASP of $276 mln which shows total revenues of above $1 bln. This is also in line with management’s guidance that it is confident of reaching over $1 bln in revenue for its AGX segment this year.
For AXG, while we will not hit our GPU unit target, we remain on track to deliver over $1 billion in revenue this year. – Pat Gelsinger, Chief Executive Officer
|
AXG Revenue Projection |
2022F |
2023F |
2024F |
2025F |
2026F |
|
Shipments (‘mln’) |
3.8 |
3.971 |
4.15 |
4.34 |
4.53 |
|
Growth % |
4.50% |
4.50% |
4.50% |
4.50% |
|
|
ASP ($) |
276 |
305.4 |
335.0 |
364.2 |
392.2 |
|
Growth % |
10.7% |
9.7% |
8.7% |
7.7% |
|
|
Revenue |
1,048 |
1,213 |
1,390 |
1,579 |
1,777 |
|
Growth % |
35.4% |
15.7% |
14.6% |
13.6% |
12.5% |
Source: Intel, Khaveen Investments
To conclude, while the reported price increase by Nikkei Asia did not specifically highlight GPU pricing to increase, the report instead stated Intel’s microprocessors which also include GPUs by definition. Moreover, as Nvidia and AMD were also reported to increase prices this year by up to 20% as TSMC raises its foundry quotes and with Intel also being a customer as its Arc GPUs are also manufactured by TSMC, we factored its ASP increase possibility in our projections but also lowered its unit shipment in 2022 based on management guidance. Still, we expect its revenue for the AGX segment to reach above $1 bln.
Risk: PC Market Decline
In its latest earnings briefing, Intel’s management highlights the weak PC market which it expects to decline by 10% this year.
However, as a result of macro weaknesses, we now expect the PC TAM to decline roughly 10% in calendar year 2022, characterized by broadening consumer weakness and relative strength in enterprise and higher-end skews. – Pat Gelsinger, Chief Executive Officer
In our previous analysis of Micron, we noted the PC market decline in Q2 was below market expectations and revised our projections based on the market forecast growth rate of -8.2% in 2022 by the IDC. Based on this, we updated our projections for Intel’s CCG segment growth rate.
Valuation
We updated our revenue projections for Intel based on the discussed price hike impact on its CCG, DCAI, NEX and AGX segments while retaining the same projections from our previous analysis for the rest of its segments. For the total CCG revenue estimates, we summed our projections of Intel’s notebook and desktop revenue through 2025 as well as its Other CCG (adjacencies) revenue growth based on its past 5 years (10.6%) but tapered down by 2% as a conservative estimate. Based on the table below, we obtained an average 3-year forward growth rate of 6.7% which is slightly higher compared to our previous analysis of 6.03%.
|
Intel Revenue Projections ($ bln) |
2021 |
2022F |
2023F |
2024F |
2025F |
|
Client Computing Group |
41.067 |
34.25 |
37.23 |
39.71 |
41.56 |
|
Growth % |
1.3% |
-16.6% |
8.7% |
6.7% |
4.7% |
|
Datacenter and AI |
22.691 |
24.71 |
29.25 |
32.79 |
34.73 |
|
Growth % |
-3.1% |
8.9% |
18.3% |
12.1% |
5.9% |
|
Network & Edge |
7.976 |
10.00 |
12.32 |
14.93 |
17.77 |
|
Growth % |
11.8% |
25.4% |
23.2% |
21.1% |
19.0% |
|
AXG |
0.774 |
1.05 |
1.21 |
1.39 |
1.58 |
|
Growth % |
18.9% |
35.4% |
15.7% |
14.6% |
13.6% |
|
Mobileye |
1.386 |
1.82 |
2.37 |
3.07 |
3.93 |
|
Growth % |
43.3% |
31.3% |
30.3% |
29.3% |
28.3% |
|
IFS |
0.786 |
2.61 |
3.14 |
3.69 |
4.26 |
|
Growth % |
9.9% |
232.0% |
20.3% |
17.5% |
15.4% |
|
Others |
5.019 |
0 |
0 |
0 |
0 |
|
Growth % |
-1.4% |
-100.0% |
– |
– |
– |
|
Intersegment Revenue |
-0.675 |
-0.675 |
-0.675 |
-0.675 |
-0.675 |
|
Total |
79.02 |
73.76 |
84.85 |
94.90 |
103.15 |
|
Growth % |
1.5% |
-6.7% |
15.0% |
11.9% |
8.7% |
Source: Intel, Khaveen Investments
Furthermore, management also lowered its gross margin guidance from 52% to 49% in its latest earnings briefing and lowered its capex guidance to $23 bln from $27 bln in its previous quarter.
Intel, Khaveen Investments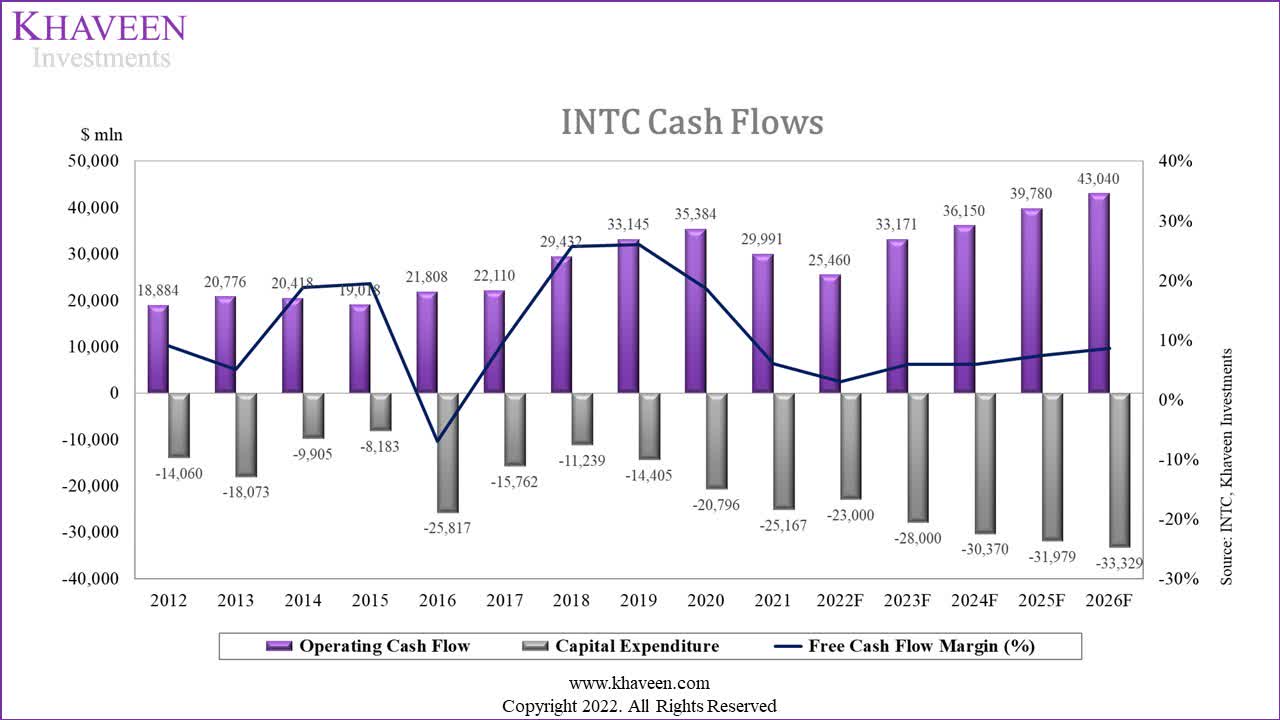
We continued to value the company with a discounted cash flow (“DCF”) valuation, as we expect the company to continue generating positive FCFs. We based its terminal value on its past 5-year average EV/EBITDA of 6.91x.
Based on a discount rate of (6.4%), our model shows its shares are undervalued by 83.22%.
Khaveen Investments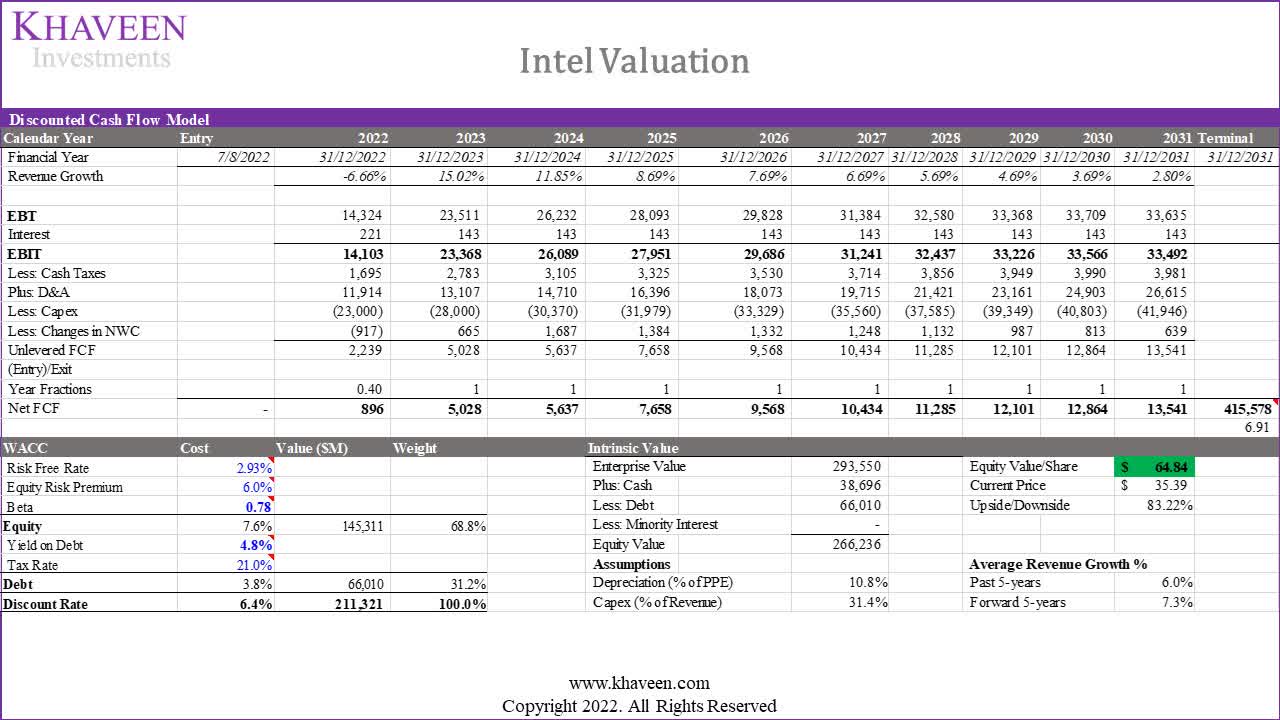
Verdict
To sum it up, as Intel was reported to increase its pricing for a broad range of products, we firstly examined its CPU business and retain our projections for its ASP growth for its PC and server segments which is in line with the lower-end and top end of the price increase range respectively. Moreover, we analyzed its NEX segment’s products which could also see a price hike and forecasted its growth based on ASP and unit shipment growth. Lastly, although not mentioned explicitly, we looked at its GPU products and a potential price hike as Nvidia and AMD also were reported to increase prices by up to 20% for products including GPUs as TSMC, which is also Intel’s GPU manufacturer, raises its quotes.
Overall, we maintain our Strong Buy rating for Intel with a lower target price of $64.84 compared to our previous analysis despite a slightly higher 5-year forward revenue growth rate of 7.3% from 6.9%.
Be the first to comment