

yorkfoto
I last wrote about Intel (NASDAQ:INTC) in May here, discussing why it remained a “value trap” for investors. An apparent bargain valuation has done little to persuade the stock quote to rebound. Unfortunately, a continuation of operating issues, a Big Tech bust in investor interest, and now an approaching recession have weighed on share pricing. The stock price has slid another -40% since May, and I am thinking a further -25% decline under $20 cannot be ruled out in a severe economic contraction scenario for 2023.
Seeking Alpha – Paul Franke, Intel Article, May 31st, 2022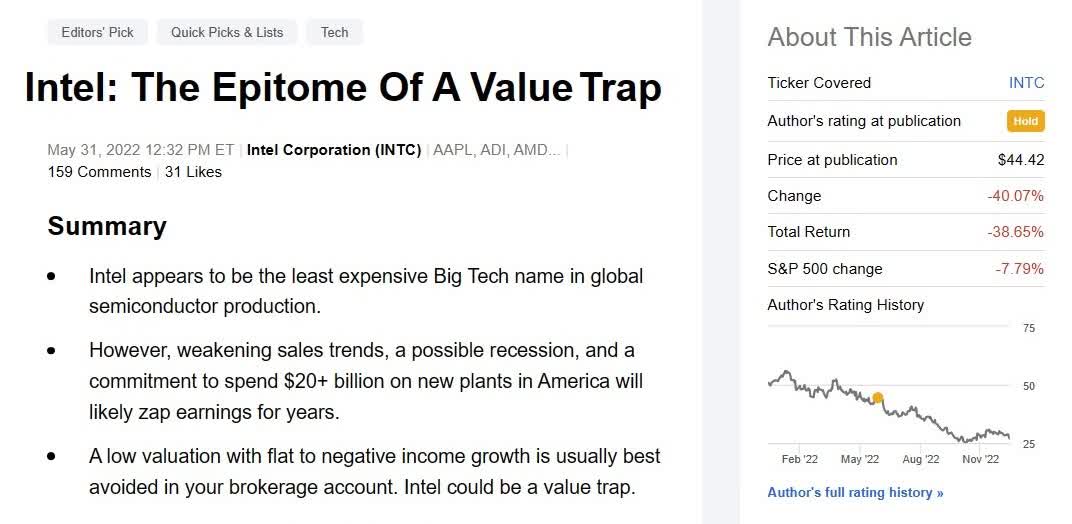
High Dividend Yield Worth A Look
Of course, the current 5.4% dividend payout is enticing on today’s Intel price, but another potential wave of selling suggests investors wanting to buy a position or add to their stake should stay patient and wait for even lower entry prices. I know it’s hard to pass up for income investors, with a cash distribution roughly double any peer Big Tech semiconductor firm (and 4x the median average), but prudence says we have not yet reached bottom as the economy starts to slide backwards.
YCharts – Big Tech Semiconductors, Trailing Dividend Yield, 6 Months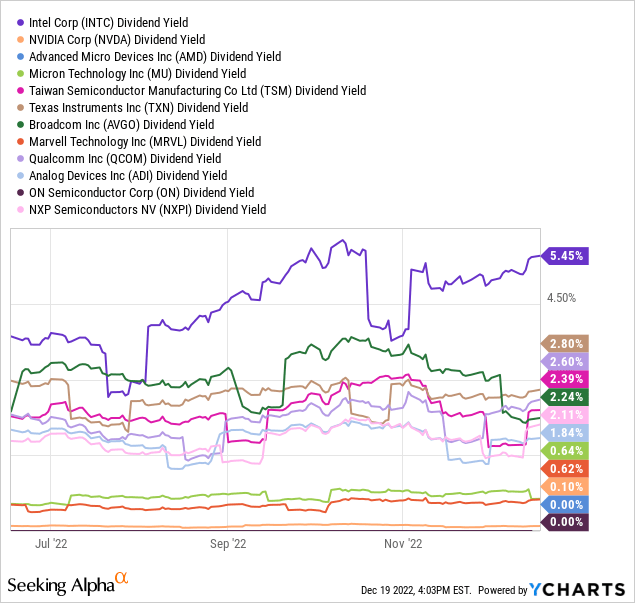
The 6-month graph of trailing dividend yields is drawn vs. peers and competitors NVIDIA (NVDA), Advanced Micro Devices (AMD), Micron (MU), Taiwan Semiconductor (TSM), Texas Instruments (TXN), Broadcom (AVGO), Marvell Technology (MRVL), Qualcomm (QCOM), Analog Devices (ADI), ON Semiconductor (ON), and NXP Semiconductors NV (NXPI).
An open question about sustainability of the dividend payout is it will likely take up the vast majority of earnings over the next couple of years, especially if a recession drags down operating results another notch. Many Wall Street analysts and investors are wondering if a dividend cut will happen in 2023. My view is a severe economic contraction would definitely increase the logic for such.
Valuation Compelling
If you could count on growth trends in sales and income resuming soon, after the disaster of 2021-22, valuations do support a higher price outlook for the stock. However, the value trap idea is sales and earnings are falling, meaning this stock appears quite cheap on “trailing” results, not so much on forward projections.
Enterprise value (which includes equity-cap and bond debt outstanding minus cash holdings) to the basic cash EBITDA construct (earnings before interest, taxes, depreciation and amortization) at 4.7x looks to be near 10-year lows on a trailing basis. Nevertheless, on forward Wall Street analyst projections, Intel is sitting at a historically normal multiple of 6.9x.
YCharts – Intel, EV to EBITDA, Since 2012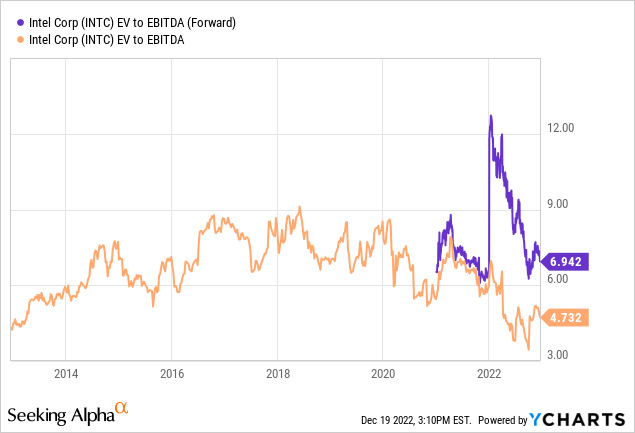
Then, when we compare and contrast Intel’s forward EV to EBITDA ratio to major competitors and peers in the semiconductor space, shares again appear to be trading near a bargain level. Intel’s 6.9x multiple is the lowest of the group today (which may argue the whole sector remains overvalued going into recession, despite wicked price declines in 2022).
YCharts – Big Tech Semiconductors, EV to Forward EBITDA, 6 Months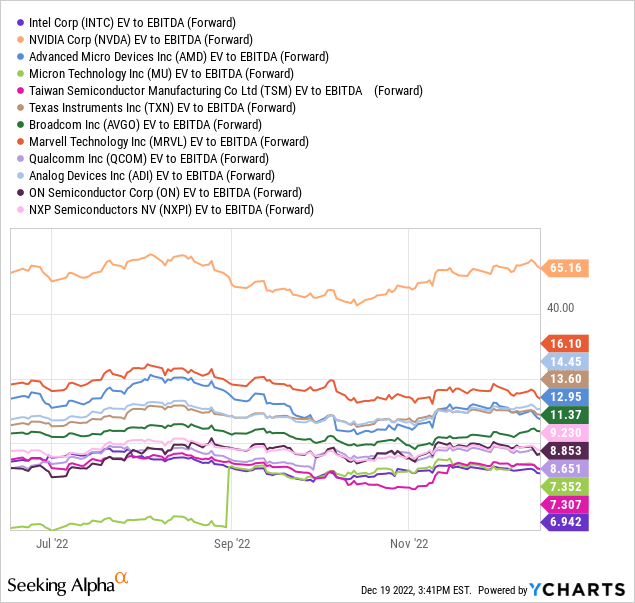
On EV to Revenue calculations, Intel has absolutely entered undervalued territory, trading near 10-year lows around a multiple of 2x.
YCharts – Intel, EV to Revenues, Since 2012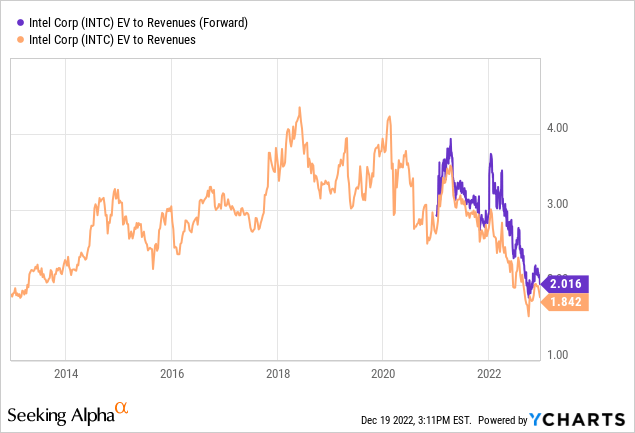
Compared to rivals, this 2x forward ratio is far and away the cheapest you can find in the mega-cap semi sector. [A smaller capitalization memory-chip favorite of mine, Everspin (MRAM) is getting close to 1x EV to Revenues and growing nicely in 2022-23, if you want a giveaway valuation.] The Intel valuation on sales is a good 50% discount to the median average of peers.
YCharts – Big Tech Semiconductors, EV to Forward Revenues, 6 Months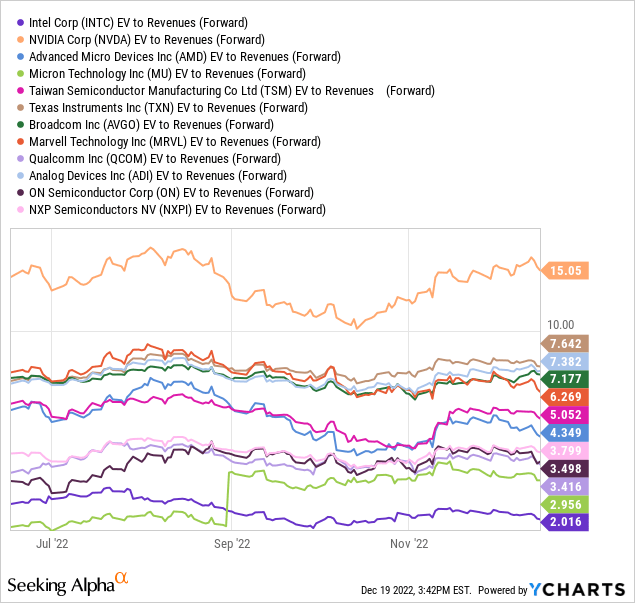
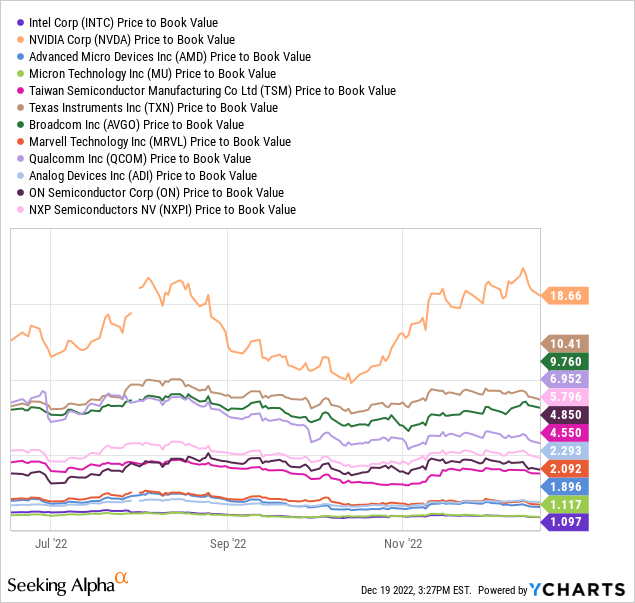
And, when we review basic cash flow and book value ratios of worth, Intel is similarly the cheapest (or nearly so) out of the Big Tech companies focused on semiconductor production. The conclusion from fundamental ratio analysis is Intel’s underlying business is certainly available to new investors at a low entry price.
YCharts – Big Tech Semiconductors, Price to Trailing Cash Flow, 6 Months YCharts – Big Tech Semiconductors, Price to Book Value, 6 Months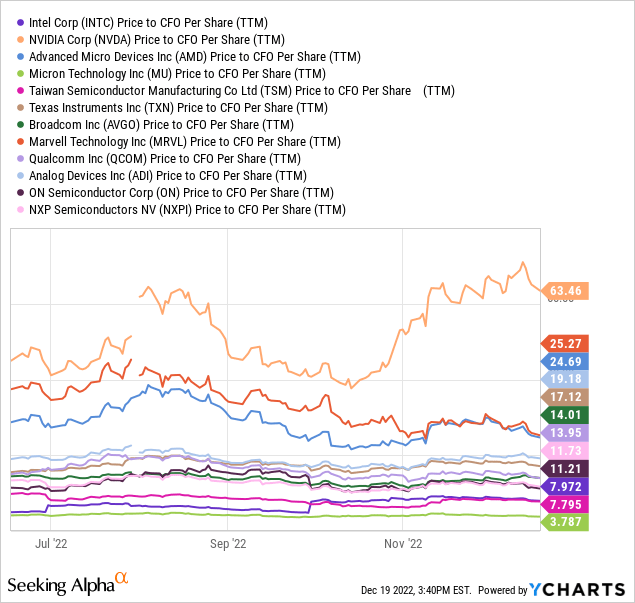
Recession Trouble Dead Ahead
But here’s the bad news. A monster slowdown in global growth (especially in the U.S.) is almost certainly guaranteed by the crazy U.S. Treasury bond inversion of late 2022. It’s the worst bond market setup and forecast of economic calamity over my 36 years of trading, if history repeats past occurrences. My latest article on the importance of a Treasury yield-curve inversion was posted in November here.
Intel could theoretically suffer a large outlier drop in demand and pricing ability next year. What this means is current Wall Street forecasts may not be bearish enough. Heaven forbid, overall U.S. demand for computers and electronics could move into reverse for the first time since the 2008-09 Great Recession, with Intel potentially generating breakeven cash income results by the second half of 2023. Don’t say it cannot happen. Already, Intel is projected to witness a steep drop in EPS before a recession shows up, with only a slight rebound expected after 2023.
YCharts – Big Tech Semiconductors, Wall Street EPS Estimated Growth, 2022-25, December 19th, 2022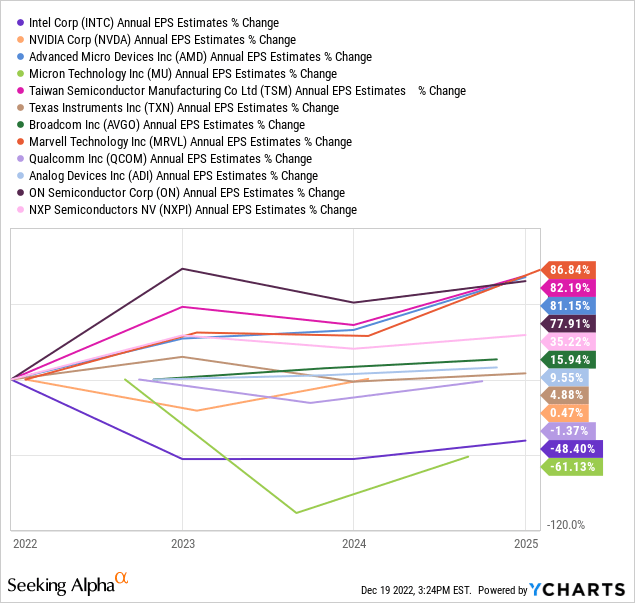
Since 1971, the U.S. has experienced 7 “official” contractions in GDP output, adjusted for inflation. Intel has fallen dramatically during each (measured from the beginning to end of recession), except one, the 1980 version of recession. And, when measured from the start of recession, Intel’s share quote has typically experienced at least a 20% price decline before finding a bottom.
YCharts, Intel Price Since 1971, Recessions Shaded in Grey, Log Scale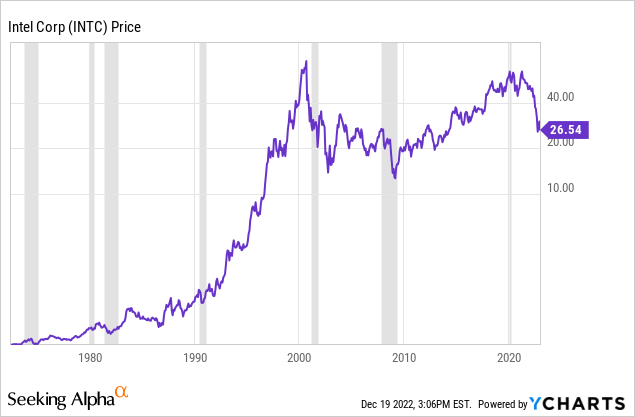
Horrible Trading Momentum
Beside the major risk of a recession hurting Intel’s immediate operating future, another excuse to be leery of shares is the rotten 2022 momentum trend turning “worser” (if that’s a word) in November and December.
Below is an 18-month chart of daily price and volume changes. Of course, Intel has suffered from the double whammy of a Big Tech wreck in price/valuations and falling consumer demand for electronics (PCs) during a period of high inflation. Shares have declined much faster in percentage terms than the blue-chip S&P 500 average company this year.
Indicators of trading momentum are still failing to predict a bottom as of today. They even suggest lower prices are coming soon. The Accumulation/Distribution Line has been weak all year, showing no sign of improvement since the S&P 500 bottom in October (marked with a blue arrow). In addition, price is again below its 50-day moving average. You cannot entertain a long-term upmove without first retaking this simple indicator of price trend.
More worrisome developments are found in the Negative Volume Index (which reviews trading on low volume days) and the basic On Balance Volume creation (price changes in the context of daily trading volume).
A healthy signal comes from a climbing NVI, where buyers appear on weakness (after high volume selloff days) and are willing to be aggressive during other low-volume sessions. I have boxed in red the bearish change for the NVI in November/December, where sellers are now overwhelming buyers on slow-volume trading days.
The OBV is a record of selling/buying action every day, where strong volume buying pushes the indicator higher each trading session. A declining line means price is falling more often than rising, and/or volume is greater on down days vs. up days. Either way, Intel’s OBV pattern (marked with the green arrow) is one of the ugliest in all of Big Tech, with new lows being reached yesterday (under October’s low point). OBV movements have a decent history of leading price, meaning the outlook for Intel to hold above $24 into January is quite uncertain.
When you combine NVI and OBV momentum trends, it’s fair to say sellers have been overwhelming buyers on both high and low volumes days of late. If you want to buy shares in a company ready to jump in price, shouldn’t you want the opposite for underlying share supply/demand trends?
StockCharts.com – Intel, 18-Month Graph of Daily Price & Volume Changes, Author Reference Points
Final Thoughts
Does an imminent recession and bearish trading momentum guarantee a monster price decline is next for Intel? Absolutely not, but the odds favor more down into the first part of 2023. My forecast (and preferred zigzag if you want to pin down my view) is Intel will be hit by another round of selling into March, probably pushing price under $20 per share. The total effect of rising interest rates takes 6-12 months to be fully felt in the economy. So, U.S. growth rates may slow down appreciably over the next 3-6 months. I am modeling a mild recession for 2023, at a minimum. Such would keep Intel’s business growth future hazy to negative another year.
If investors actually panic sell equities in fear during Q1 2023 (many are bearish and pessimistic, but I do not sense much fear in the ones I talk to), a drop under $20 for Intel makes perfect sense. After that, assuming the Fed comes to the rescue with lower interest rates and a new round of QE, Intel may be able to recover in the second half of the year above $30.
My suggestion for those wanting to commit new capital to Intel is to wait patiently for even lower prices. Given the U.S. semiconductor infrastructure-build push, Intel may be a top choice in the end, but it could take another year or two to reach sharply higher share pricing. A low price to revenue number and strong dividend yield will be even better buys under $20. At least that’s my current thinking on the company. The highest rating I can give Intel is a Hold/Neutral setting today. I peg Buy territory under $20 for conservative long-term investors.
Thanks for reading. Please consider this article a first step in your due diligence process. Consulting with a registered and experienced investment advisor is recommended before making any trade.
Be the first to comment