

BongkarnThanyakij/iStock via Getty Images
Investment thesis
Intel Corporation’s stock (NASDAQ:INTC) is suffering from its worst decline since the burst of the Dotcom bubble. 20 years later, the stock formed a significant double top, from which it got rejected in a massive sell-off, now lasting more than 1.5 years. In this article, I explain an actionable trading opportunity for more short-term investors, but I also underscore the importance of a contingency plan in case the stock moves against it. For more long-term oriented investors, I don’t see any urgency to take any position in this situation, which is not offering a positive setup. I qualify the stock as a hold position, while, under certain conditions, the discussed trading opportunity could lead INTC to be considered a short-term speculative buy-position.
A quick look at the big picture
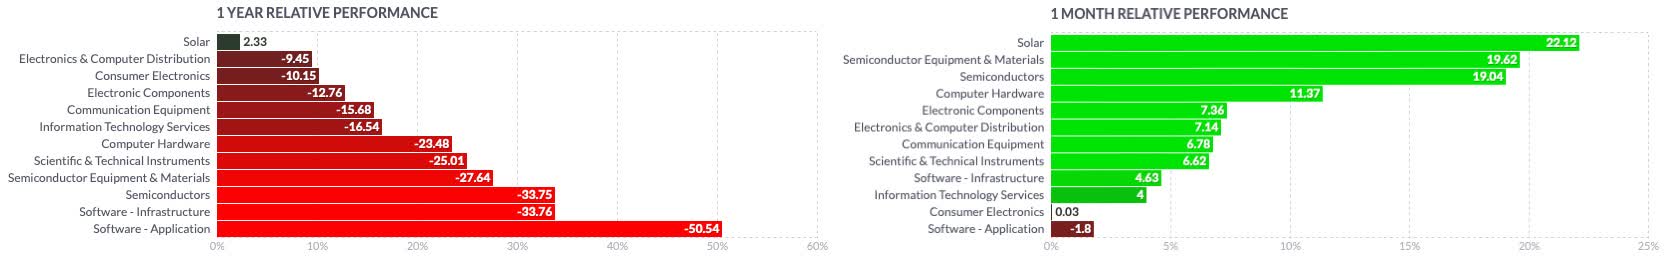
While it has formed its second sharp rebound during the past few weeks, the US technology sector has been under higher selling pressure for the majority of the past 12 months and is still among the most significant laggards in the economy. Semiconductor manufacturers are among the strongest leaders in the ongoing rally, showing some resilience, despite having lost more than one-third of their value on a yearly basis. The solar industry could overall perform much better and is also leading the current uptrend, while others, such as companies in the software application or software infrastructure industries, are still having difficulties recovering.
finviz finviz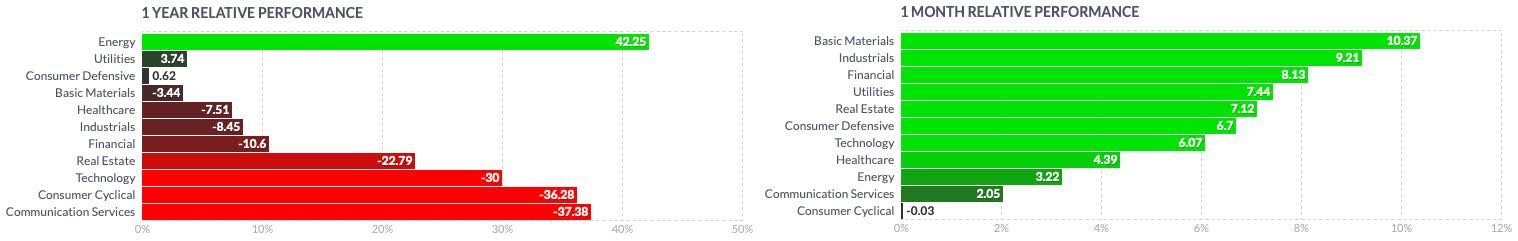
Looking at more specific groups of the industry, the VanEck Semiconductor ETF (SMH) marked its All-Time-High [ATH] on November 22, 2021, and has since massively corrected, losing over 47% until bottoming on October 13, 2022, and has since reverted, breaking with strength through its EMA200 until reaching its EMA50 which is now almost crossing the EMA100 on a weekly time frame. A sign that would suggest a more likely bearish momentum. It’s important to note, that the reference’s actual price level on a daily scale corresponds exactly with the EMA200, a major resistance confirmed on both analyzed time frames. The industry reference is seemingly breaking out of its long-term downtrend, while it is building up significant relative strength when compared to the broader technology market, the Nasdaq Composite (IXIC).
Author, using TradingView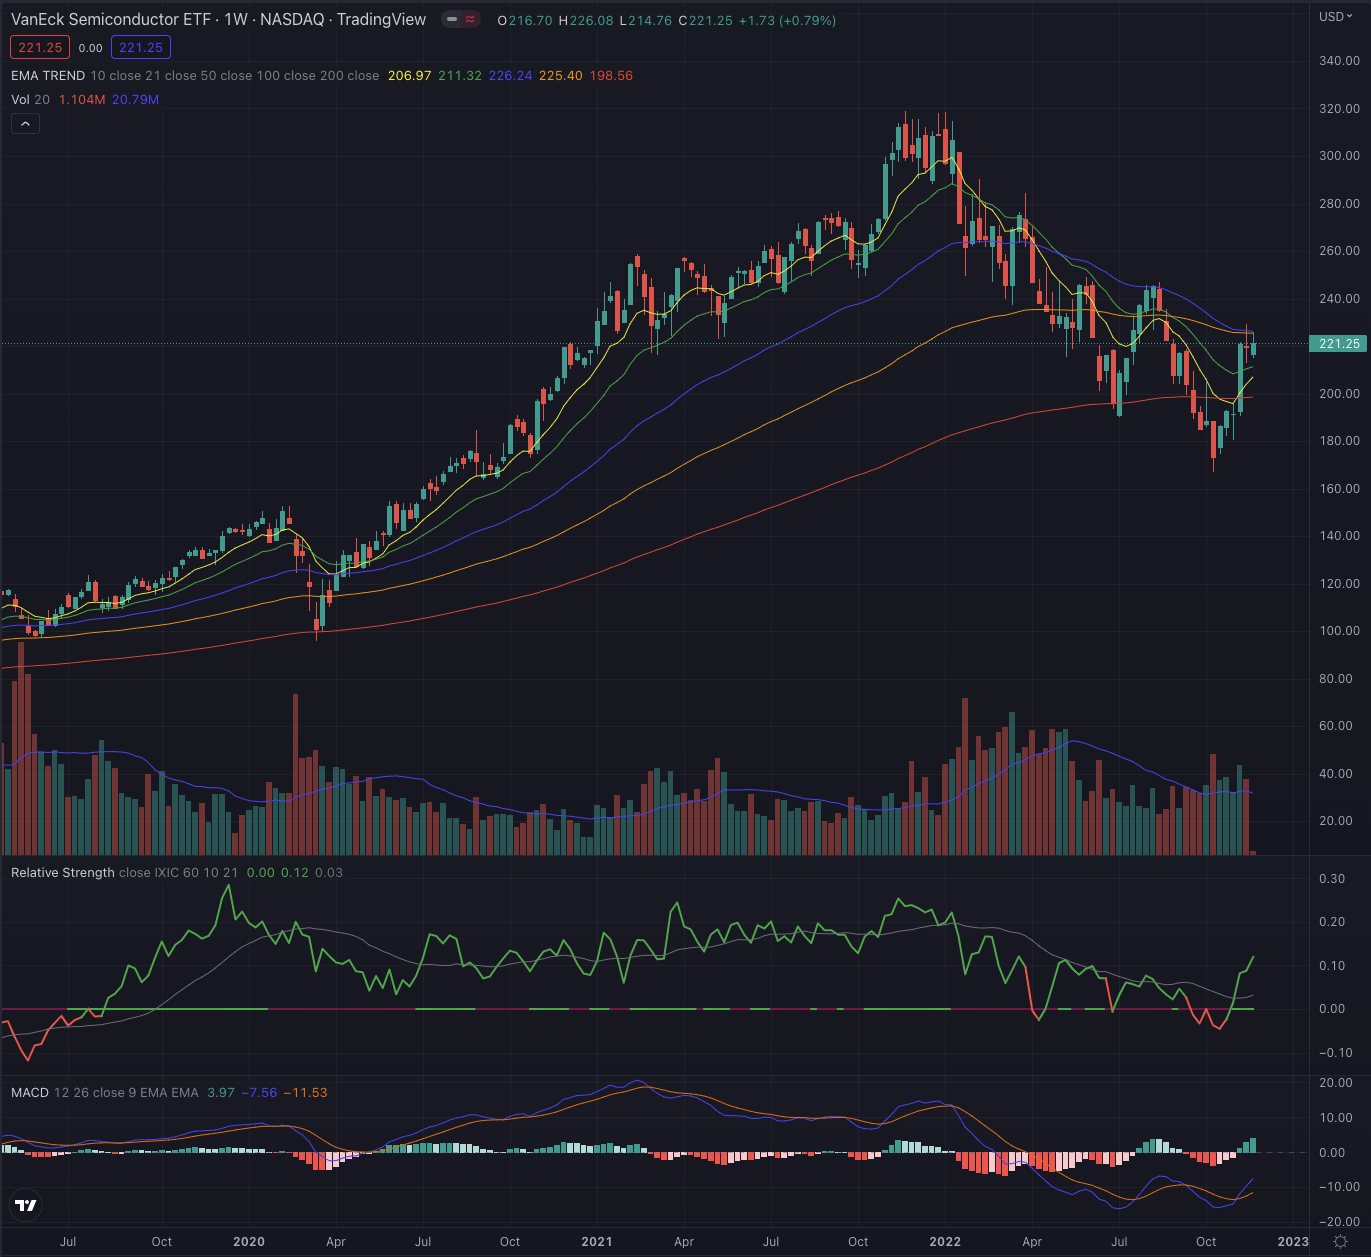
INTC’s historical stock chart is showing some sporadic relative strength during 2018, 2019, and out of the pandemic low, while the stock has since been a laggard, leading to a massive underperformance of its peers and references in the past 5 years. Advanced Micro Devices (AMD) is the best outperformer, with a massive performance of 561.47%, followed by NVIDIA (NVDA) which also greatly outperformed both the S&P 500 (SP500) and the Nasdaq-100 tracked by the Invesco QQQ ETF (QQQ). Taiwan Semiconductor Manufacturing Company (TSM), despite not being a peak performer, could still significantly outperform INTC, by especially showing relative strength in the past two years, returning close to 100% performance to its investors over the analyzed period.
Author, using SeekingAlpha.com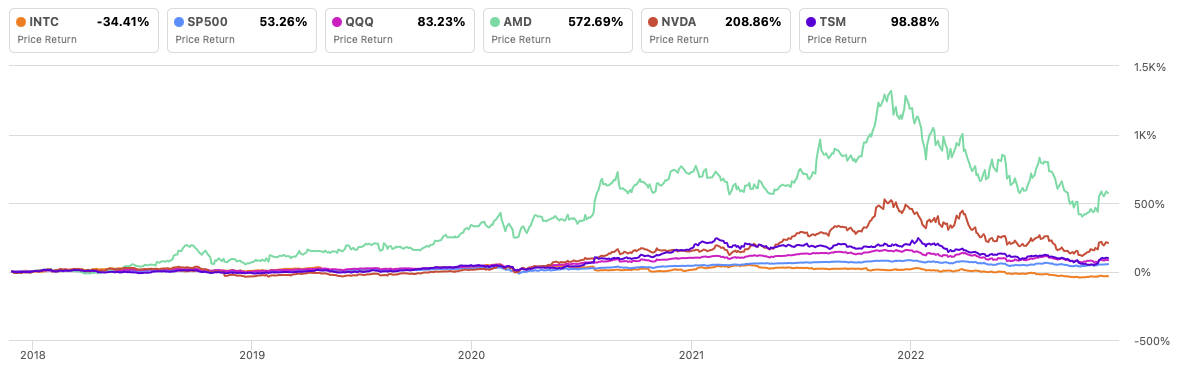
Where are we now?
INTC formed a double top by April 12, 2021, after peaking on January 24, 2020, just before the COVID-19 pandemic crash. The stock has since performed poorly, reporting significant relative weakness, which deepened since it entered its long-term downtrend by the end of January 2022. The days of distribution accelerated, leading the stock to levels not seen since 2014, extending it until under the 1.618 Fibonacci extension, while losing over 64% of its value through October 10, 2022, where it finally seemingly bottomed on important time frames.
Author, using TradingView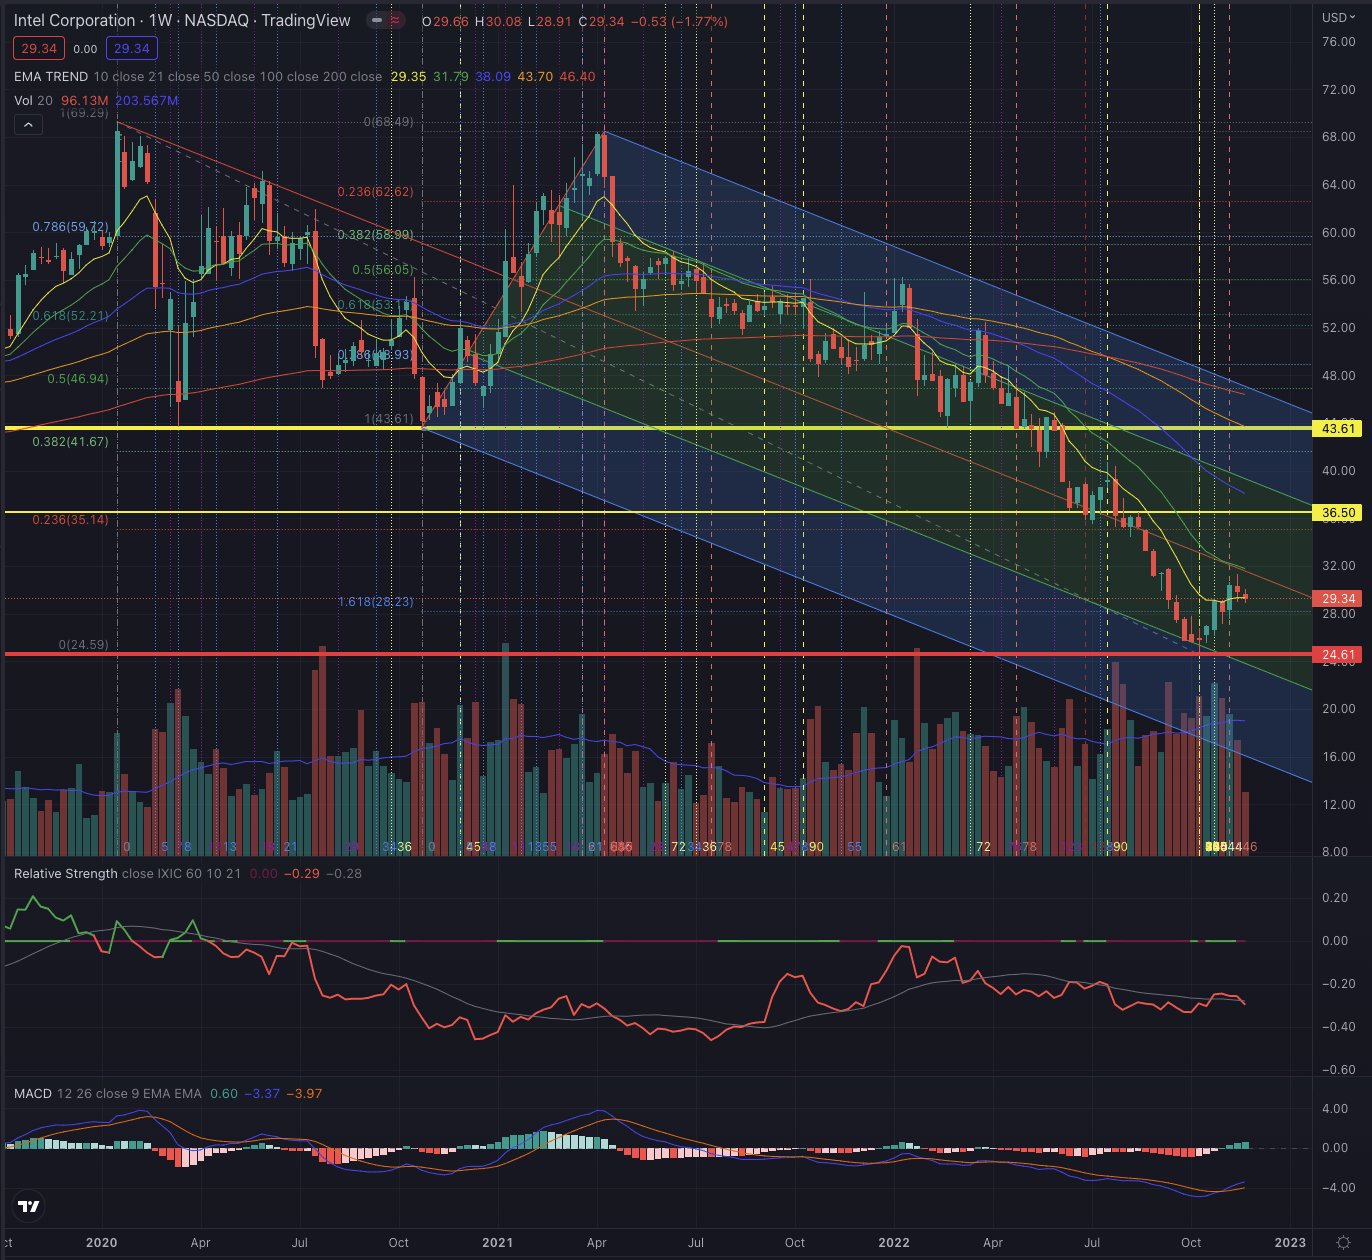
The actual rebound may be technically overdue, as the stock hasn’t been that much negatively extended since the burst of the Dotcom bubble in 2002, and marked its longest losing streak since. INTC is deep in its stage 4, a stage no investor wants to be in if not on the short side. The problem in such a steep decline is the massive technical, but also psychological, overhead resistance that the stock has to overcome before possibly setting up a new uptrend. History showed repeatedly that massive declines also in renewed names and secular leaders needed a long time to bottom and many stocks took years to break even, or never reached the former peak price level again. INTC took over two years to bottom from its Dotcom crash with an 83% loss from its peak, AT&T (T) lost 83% in 3.5 years and never even approached again its peak prices, Cisco Systems (CSCO) needed 2.5 years to bottom and lost 93% of its value, General Electric (GE) never recovered after dropping 65% in 2 years, Ford Motor (F) -83% in 3.5 years, or Micron Technology (MU) which lost 93% in 2.5 years and just recently, after 20 years, failed its attempt to overcome its ATH. The list is long, and though there are also stocks that recovered faster and overall performed better, no one can know this when a stock is declining, but it can be identified as soon as the stock forms significant resilience and fulfills the conditions of a likely consistent leader.
What is coming next?
I don’t believe history will repeat itself, as the actual situation is intrinsically but also economically different, but no one knows with certainty, and it’s most likely not the right time to begin and build a consistent position at this point, as the bottom fishing could continue for an unforeseeable time. I am not a supporter of practices such as “averaging down” or repeatedly calling the bottom, without setting appropriate stop-loss levels and being prepared for a likely mistake in my assumptions. Everyone can be wrong, but staying wrong is a conscious decision any investor makes while choosing to feed their ego instead of their investment portfolio.
I expect the stock to continue performing weaker than its reference in the short term. At this point, I rank INTC as a hold position, but only because the stock is still testing its support price level at the EMA50 on its daily chart. The stock may float around this price for some time, but investors should particularly pay attention to a possible violation of the support, and if that violation would be followed by a confirmation. The stock may have bottomed, but its recent decline in trading volume is not a sign of conviction, and despite its relative weakness recently gained some positive momentum, INTC is just lacking significant strength and there are still seemingly more declining days after each smaller gain.
Author, using TradingView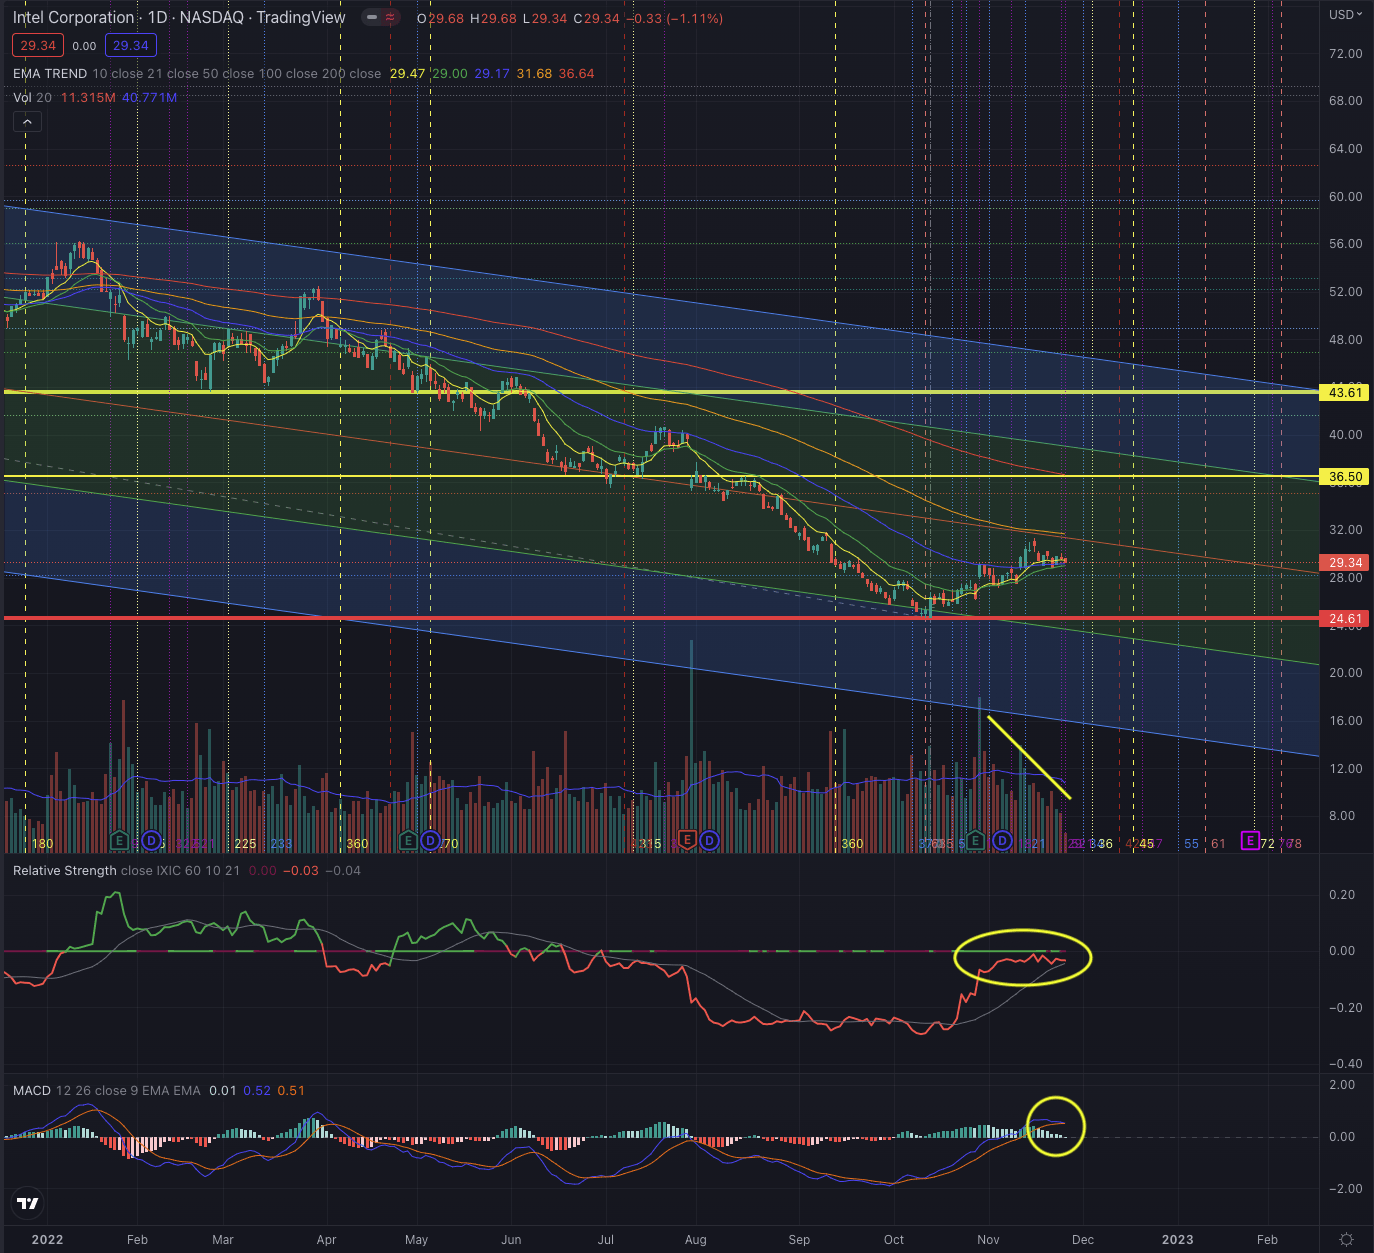
As the stock is in stage four, tracing along the central part of its downtrend channel, I would not consider any long-term position, as this is not the type of situation I see as statistically likely offering a winning setup. As a long-term investor, I would not consider any major position until the stock has confirmed a significant breakout over its long-term moving average. In stage four of a stock, there is no need to rush into it as investors are betting against a strong trend and the odds are high that new lows will form or the bottoming process extends over a long time. Additionally, most of the profits are made when a stock breaks out of stage one and rises consistently in stage two. While it may sound great to fish the bottom, this practice has not much in common with a rational and calculated investment decision, but is certainly more related to pure gambling on personal intuition. A dangerous game to play.
When would I consider buying INTC? First of all, it’s important to set up a contingency plan and size the positions in order to limit the effects of a possible mistake, while taking advantage of a positive outcome. Managing the risk is the most important part of any investing situation, and it’s also the only element investors can control. From a short-term perspective, INTC is now testing its support level and only if the stock breaks out consistently over its EMA50 confirmed by a significantly higher volume, I would consider to build up a first high-risk short-term position, with my first target at $32, and successively incrementing my position if the stock continues its ascension toward $35, until possibly reaching its strongest overhead resistances, now seen at its EMA200 or $36.50.
In the actual situation, my stop would not exceed $28, as I don’t want to be invested if the stock decides to test the recent bottom. If the stock rises, investors could set a stop under the tracing EMA50 or under the discussed price levels, in order to secure their profit in case of a major pullback. Investors should closely observe the price action and how the stock behaves at each important price level, by particularly observing the trading volume in both directions.
The bottom line
Technical analysis is not an absolute instrument, but a way to increase investors’ success probabilities and a tool allowing them to be oriented in whatever security. One would not drive towards an unknown destination without consulting a map or using a GPS. I believe the same should be true when making investment decisions. I consider techniques based on the Elliott Wave Theory, as well as likely outcomes based on Fibonacci’s principles, by confirming the likelihood of an outcome contingent on time-based probabilities. The purpose of my technical analysis is to confirm or reject an entry point in the stock, by observing its sector and industry, and most of all its price action. I then analyze the situation of that stock and calculate likely outcomes based on the mentioned theories.
The semiconductor industry is performing relatively better in the past few weeks, retracing partially its extended losses, recorded in the past 12 months. In every stock market downturn, some leaders become laggards and new leaders emerge, while some of the former leaders still show resilience and continue to lead in their industry. INTC, as also other secular leaders, needed decades before emerging from their long-lasting decline, and though past performance is no guarantee of future results, long-oriented investors want to avoid stocks in their stage-four decline, as no one can predict with certainty where the sell-off will take an end. Under the analyzed circumstances and by observing the explained actionable contingency plan with the most important resistance and stop-loss levels, I rank INTC as a short-term buy, while, overall for long-term investors, the actual situation isn’t offering any positive setup, leading to rank the stock as a hold position.
Be the first to comment