

Firn/iStock via Getty Images
Thesis
The Dogs of the Dow (“DOTD”) strategy is a systematic method to identify prominent companies that are undervalued. It provides a simple process to pick the optimal combination of valuation and quality among the 30 blue-chip Dow stocks. It involves only 3 simple steps outlined on this website:
- Selecting several (say 10) stocks that have the highest dividend yield from the Dow Jones Industrial Index
- Holding them for a period of time (say 1 year)
- Repeating (or balancing) based on steps 1 and 2.
And above all else, it actually works! For readers who can’t wait, its past performances are shown in the next section. And as you can see from the list below, during Q3 2022, both Intel (NASDAQ:INTC) and International Business Machines (NYSE:IBM) have become DOTD. They are now the 3rd and 5th highest-yielding stocks on the list.
Source: www.dogsofthedow.com/ddogytd.htm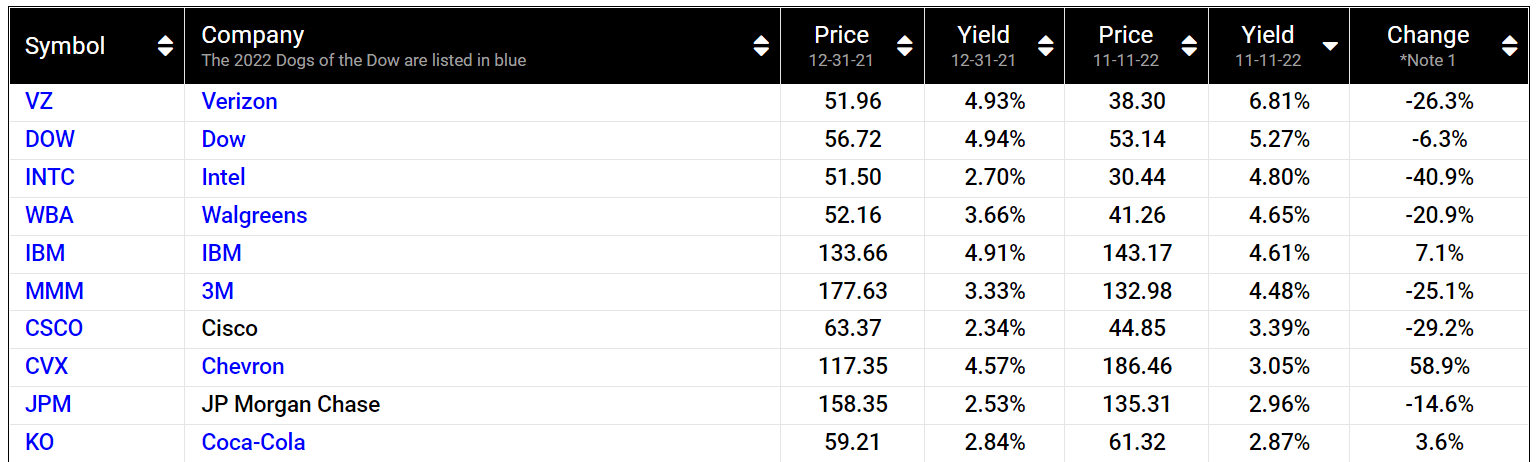
Normally, tech companies do not make it to the DOTD list. The DOTD list is typically frequented by companies from utility-like stocks (such as Verizon), healthcare stocks (like Walgreens and Amgen), or commodity-type stocks (such as Dow and Chevron). However, in the case of INTC and IBM, there are good reasons that they showed up on the list recently due to a combination of large price corrections, stagnating or worsening profitability, and yet steady dividend payouts.
So, the natural question is: can these tech stock recover both their profitability and stock prices, so they get themselves off the DOTD list?
My answer is yes for both stocks. And in the remainder of this article, you will see my reasoning in detail. At this point, I see the silver lining ahead for them to resume their growth. And at the same time, their valuations are so compressed that there is a large chance for their price to stage a sizable rebound and deliver outsized total returns.
How did the DOTD method perform?
As aforementioned, the DOTD method has been effective in the past because it is based on timeless principles (to look for the best combination of value and quality) and a systematic method. The following chart shows its performance since 2007 (taken from Investopedia):
The chart compares the DOTD strategy to a buy-and-hold strategy on the Dow Jones Industrial index (“DJIA”). The strategy lagged the DJIA after the 2008 crash till 2010 briefly. Then it has been outperforming the DJIA index consistently since then. Since 2007, $10,000 invested in DJIA from the beginning of 2008 would grow to $17,350 in 2018. While the DOTD method would have grown to $21,420 in contrast.
Source: www.investopedia.com/terms/d/dogsofthedow.asp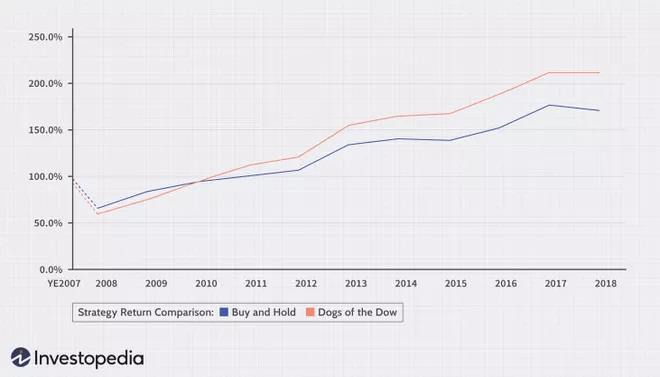
In case you are wondering if its performance still continues under the current volatile conditions we are going through this year, the next chart shows that the answer is a definitive YES. The DOTD method would have made a small profit of 0.5% YTD despite all the market corrections and drama. But if you simply buy and hold the DJIA index, you would have lost 7.1% in contrast.
Now we move on and examine IBM and INTC more closely.
Source: www.dogsofthedow.com/ddogytd.htm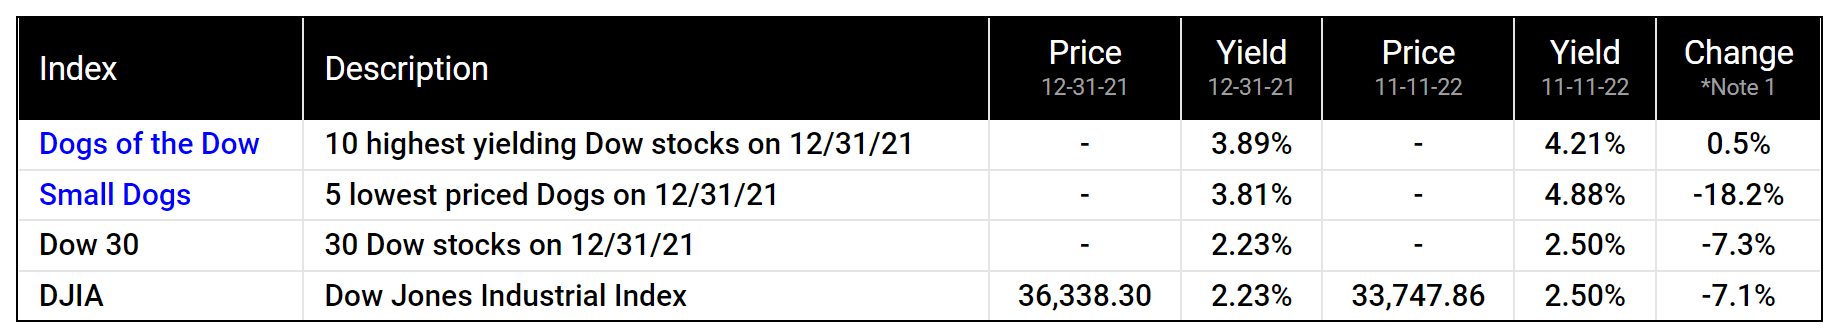
INTC and IBM: Q3 recap
It is not an exaggeration to say that INTC has been brutalized lately. It has suffered a price decline of close to 40% YTD because of a combination of headwinds: revenue contraction, margin contraction, and the large capital requirements of its foundry (“IFS”) initiative. To wit, in its recent Q3 earnings report (“ER”), it reported another quarter of margin compression, with gross profit margin (“GPM”) down to 45.9% during Q3, the lowest level in 10 years. On the bottom line, its EPS dialed in at $0.59 in Q3, a decrease of 59% YoY. At the same time, it faces tremendous CAPEX requirements, in the range of $21B as you can see from the following chart, largely due to its IFS commitment.
Source: INTC 2022 Q3 ER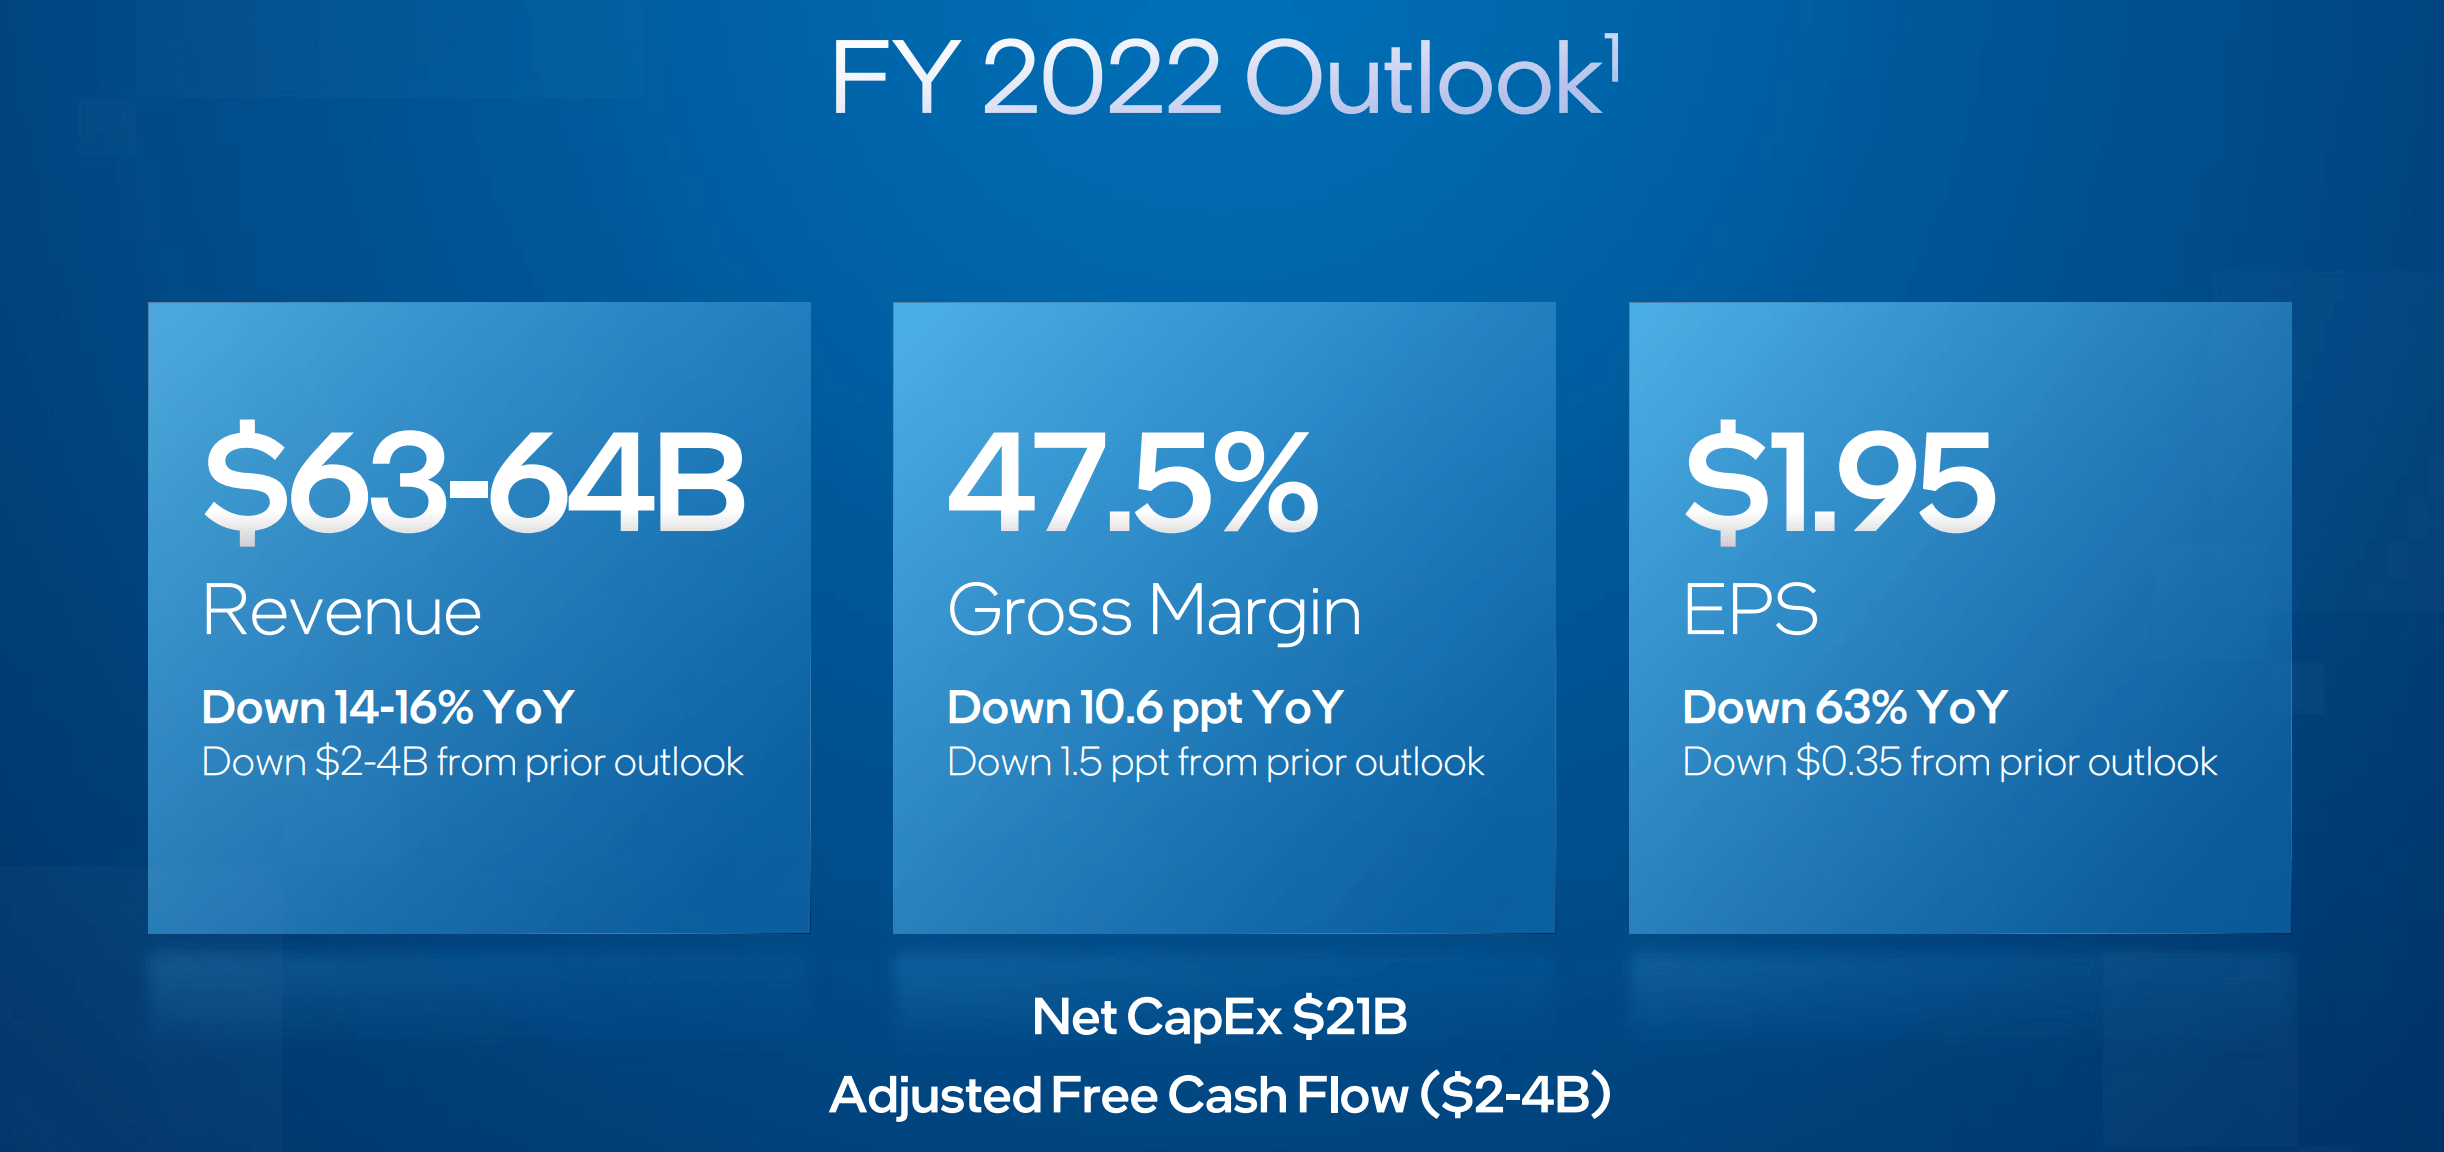
The picture for IBM is slightly brighter, but not by so much. IBM has been plagued by declining top-line and bottom-line for years. Both its revenues and cash flow have declined at 1% CAGR for the five years. In its Q3 ER, it reported the first quarterly results in more than 5 years which can be called uplifting in my view. Its Q3 results exceeded consensus estimates on both lines. Its Non-GAAP EPS came in at $1.81, exceeding consensus estimates slightly by 1 cent. And its Q3 revenue came in at $14.1B, exceeding consensus estimates also slightly by $550M.
Source: IBM 2022 Q3 ER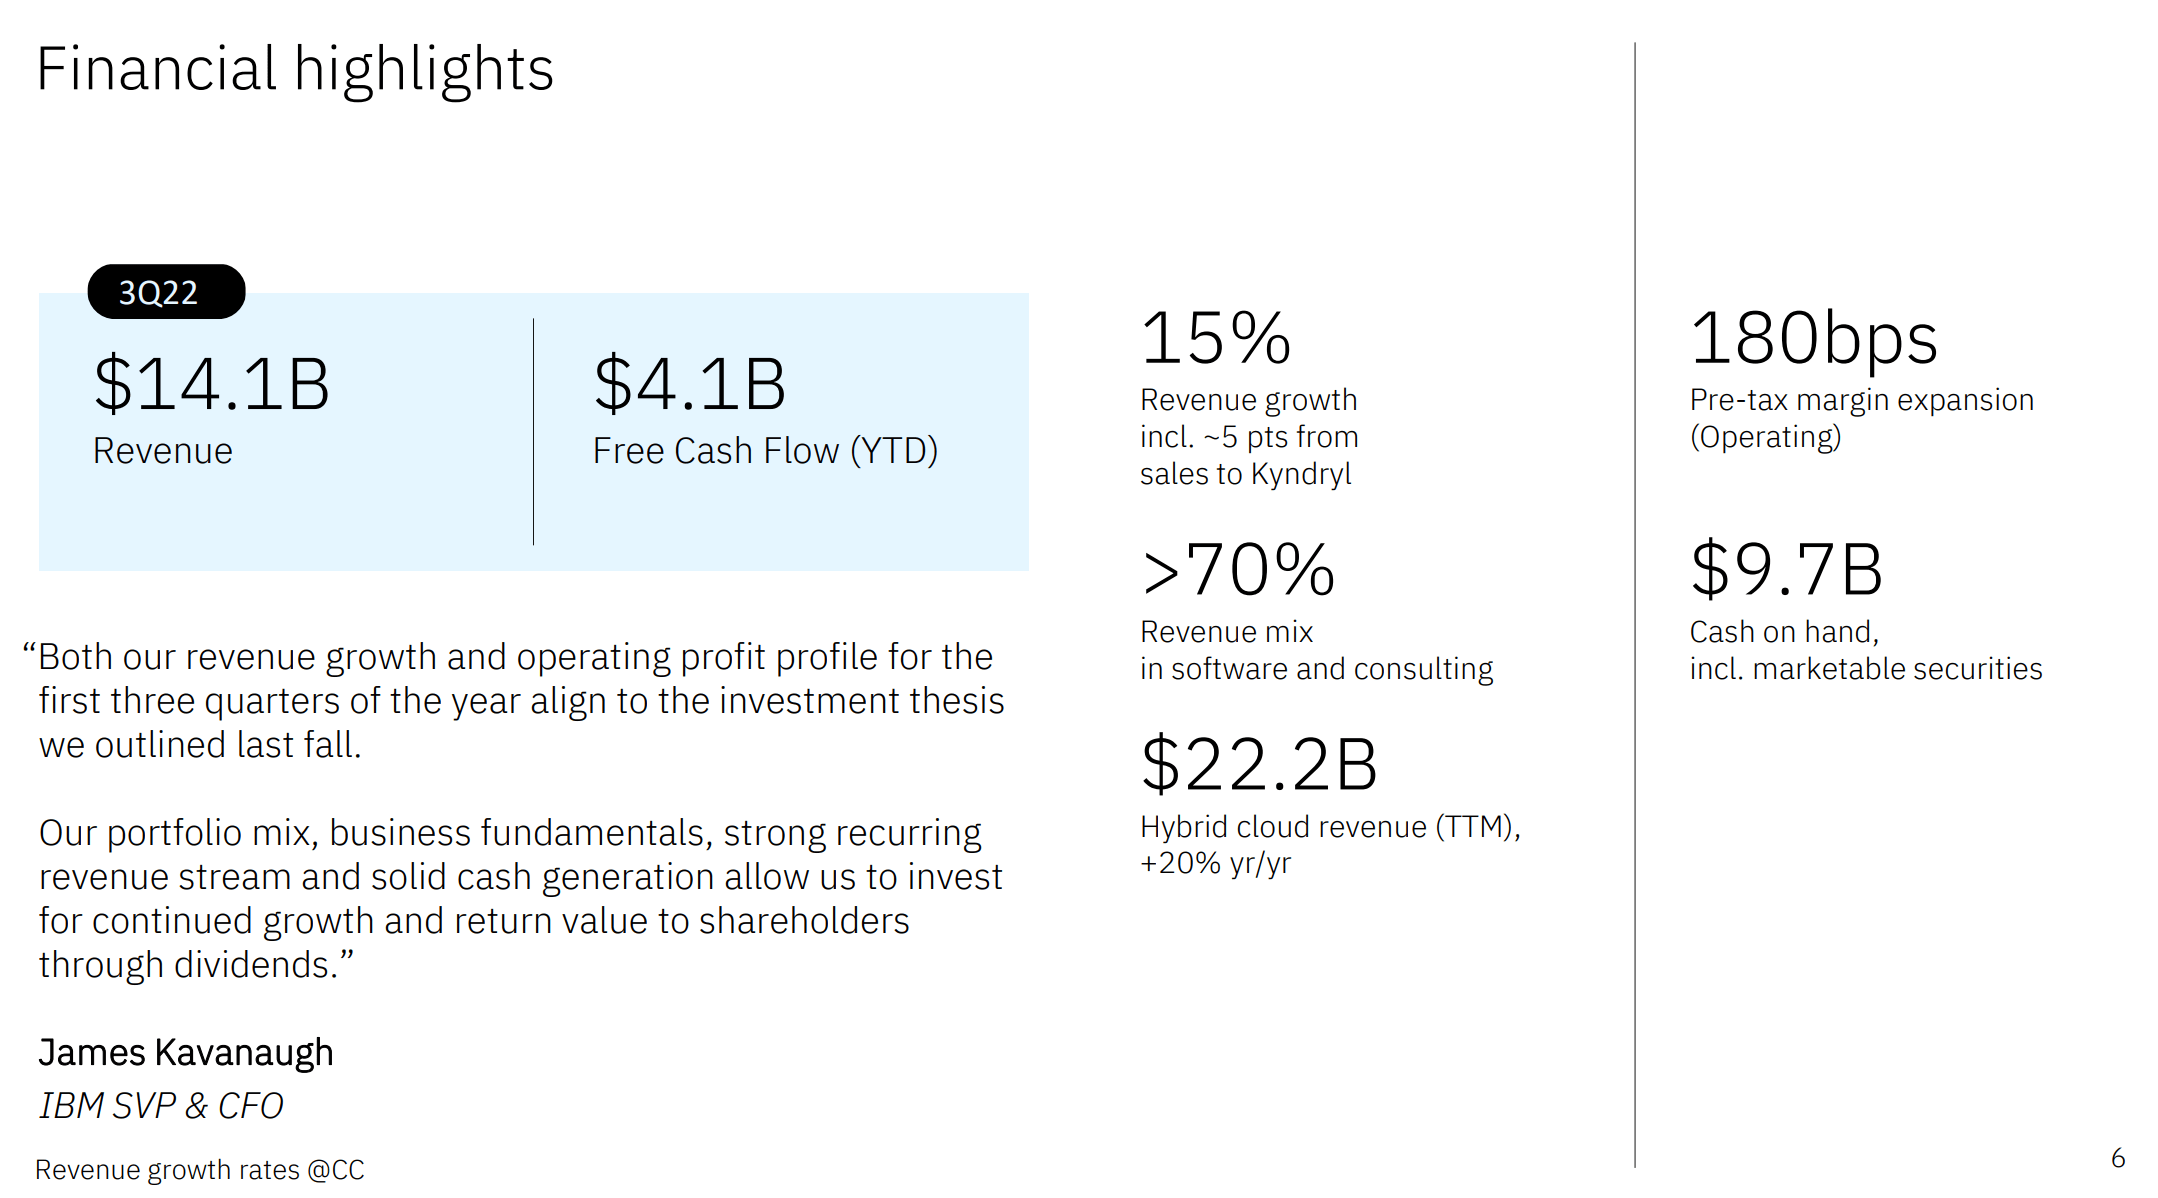
Due to such performance issues, both stocks have underperformed the Dow index (“DIJA”) in recent years by A LOT. As seen from the following chart, this year alone, INTC suffered a total correction of 38% YTD, compared to the 5.6% loss from the DIJA index as approximately by the SPDR Dow Jones Industrial Average ETF (DIA). IBM has been suffering years of stagnating prices too (in a range between $100 to $150 in the past 5 years or so), while the overall market went up by more than 1.5x. Such large price lags relative to the DJIA drove up their dividend yields and put them not only on the DOTD list but also near the top of the list as aforementioned.
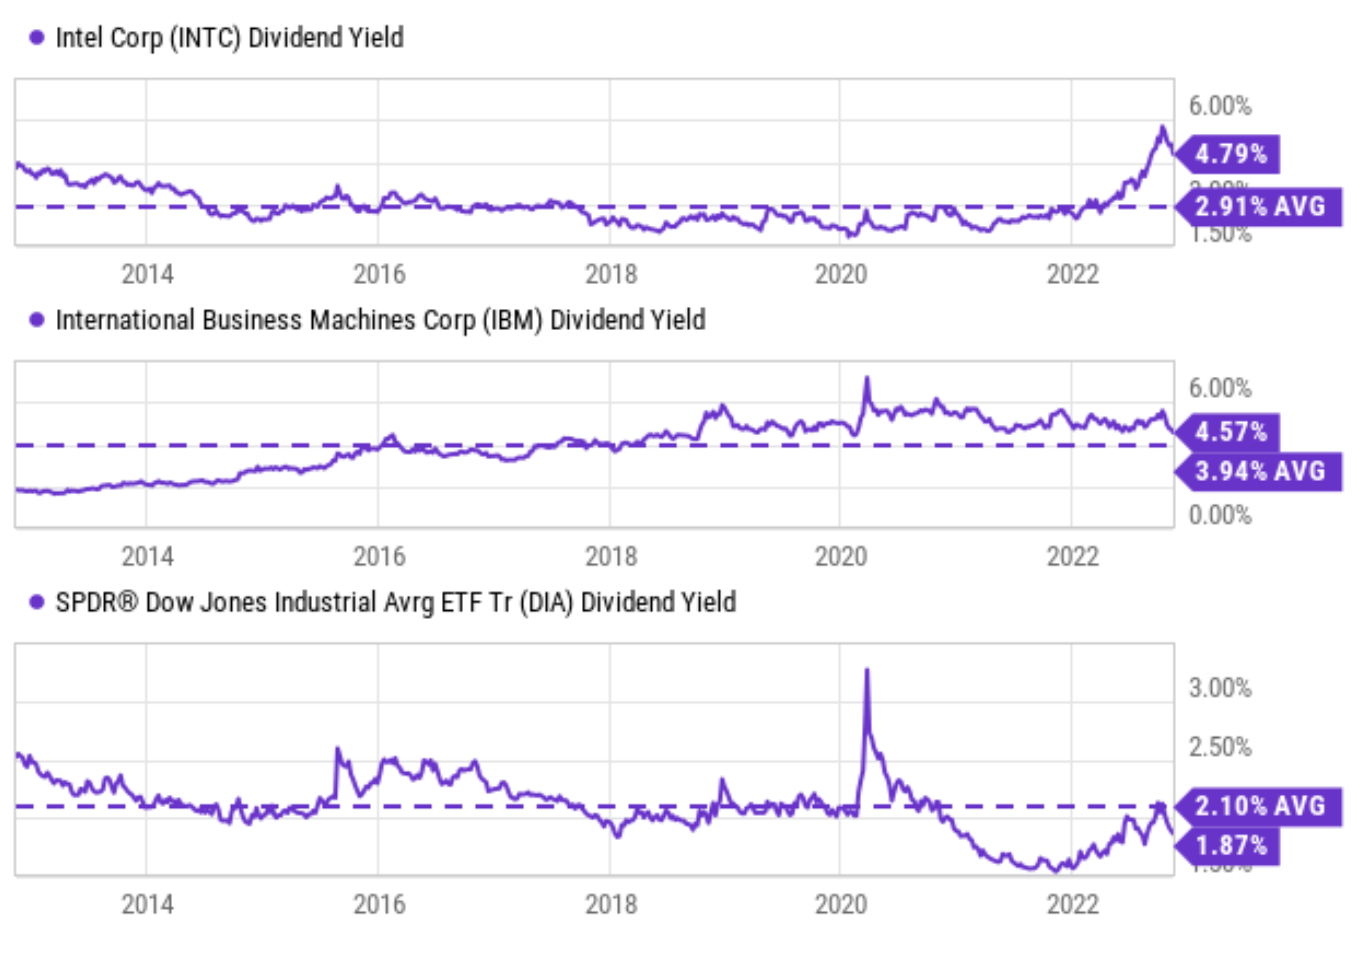
As you can see from the next chart, the dividend yield for INTC is 4.79% currently and 4.57% for IBM. Both are yielding not only far above their historical averages (2.91% for INTC and 3.94% for IBM) but also close to a peak level in about 10 years. In contrast, the DIJA index is yielding 1.87% currently, about 11% below its historical average of 1.87%.
Next, I will argue both INTC and IBM have a good prospect of recovering their profitability and stock prices going forward.
Source: Seeking Alpha data Source: Seeking Alpha data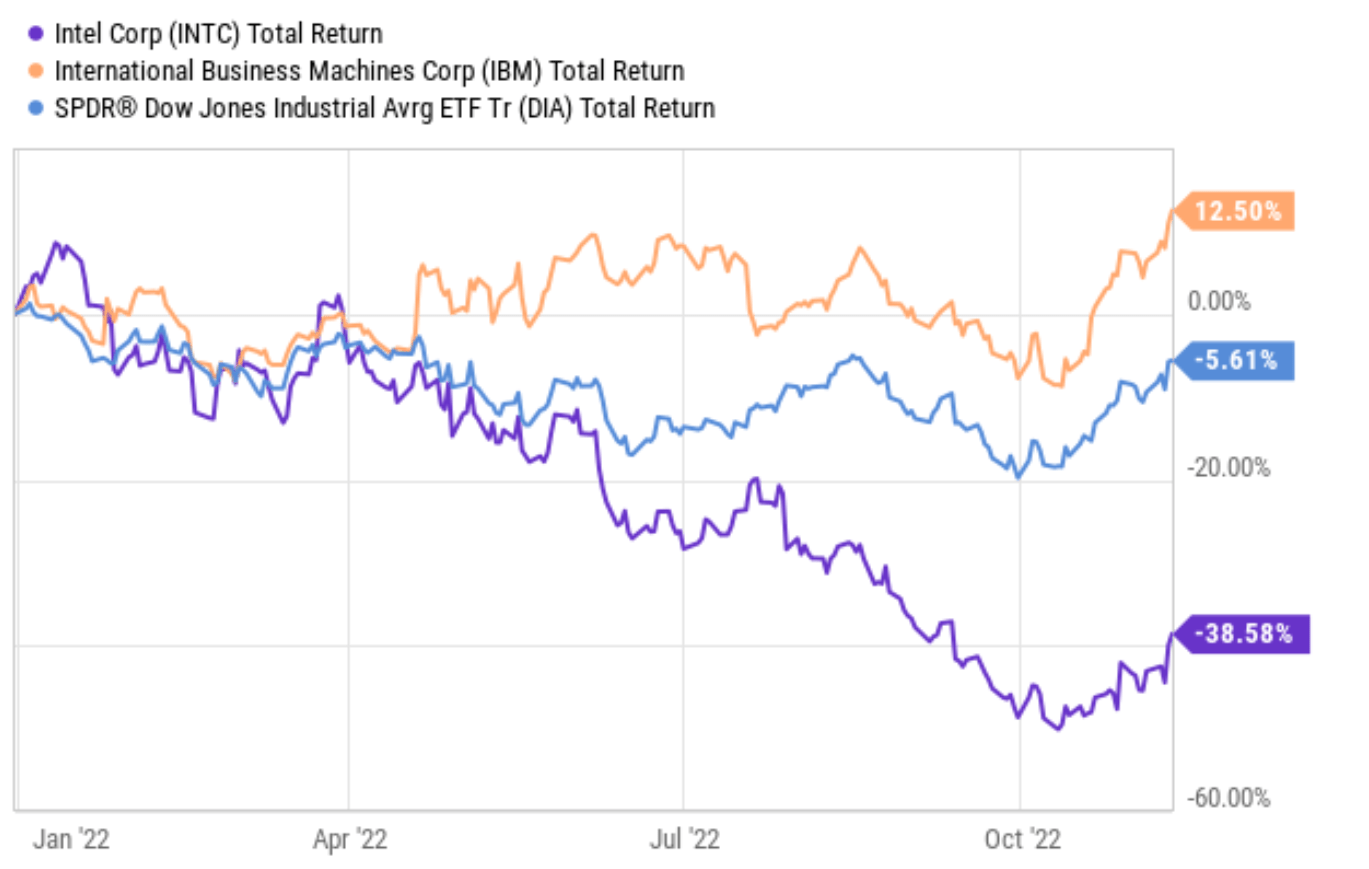
INTC: Business outlook and projected returns
My view is that INTC has reached a bottom in Q3 both in terms of business fundamentals and stock prices. If you recall from INTC’s ER slide above, it now expects total revenues in the range between $63B~$64B for the full year 2022. It also expects a GPM of 47.5% for FY 2022. This GPM represents a reversal of the margin contraction it has been suffering lately. A GPM of 47.5% is a 160 basis points expansion from its Q3 GPM of 45.9%.
The company has multiple promising initiatives on going also, with the IFS being the most notable area in my view. The business is confident in achieving 5 nodes in 4 years and progressing on schedule for Intel 20A and 18A. Its first test chips have already taped out. At the same time, it is also expanding its IFS capability through acquisitions. It has recently acquired Tower Semiconductor. A few highlights for this acquisition are quoted from the following news release (slightly edited and with emphases added by me)
- The acquisition accelerates INTC’s path to becoming a major provider of foundry services and capacity globally, now offering one of the industry’s broadest portfolios of differentiated technologies and capabilities.
- Highly complementary transaction brings together INTC’s cutting-edge nodes and scale manufacturing with Tower’s specialty technologies and customer-first approach…
- This transaction is expected to be immediately accretive to INTC’s non-GAAP EPS.
Source: INTC Q3 ER
In terms of organic investments, it is building a $20B foundry complex in Ohio. The project is progressing well (see the new reports from Columbus Dispatch reports) and is expected to receive large subsidies from the recently-passed CHIPS act. All told, Its IFS has already attracted the interest of 100+ potential customers. A total of 35 customer test chips are expected for its Tower facility alone, and IFS’ potential clients include major players like Qualcomm (QCOM) and Amazon (AMZN).
The addressable market for the global foundry industry is expected to grow to $100 billion in about 5 years. My estimate for INTC IFS’s market share is to be about $15B by 2025. And my estimation is based on the following two key assumptions: A) a total of $30B investment combining its Tower acquisition, Ohio facility, and government subsidies, and B) a 0.5x asset turnover rate (consistent with pure foundry players such as Taiwan Semiconductor). Based on this estimate, its total revenue is projected to reach $78.5B EVEN if its current core business segments stagnate at the 2022 level. This projected revenue would translate into $18.7 per share. Assuming a 3.0x P/S multiple, its projected stock price would be $56.1, or about an 85% potential upside from its present price.
Source: Author based on Seeking Alpha data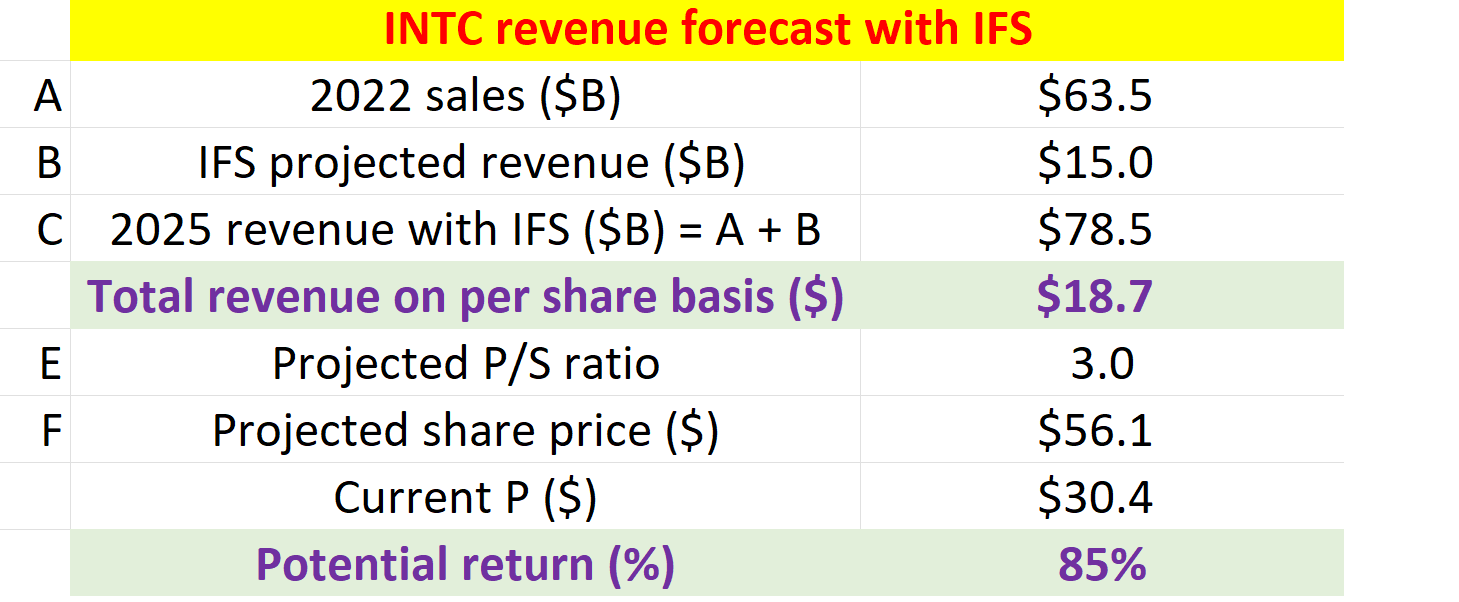
IBM: Business outlook and projected returns
I see IBM has turned a corner too after its Q3. As aforementioned, its Q3 ER represents the 1st quarterly results in more than 5 years which can be called uplifting in my view. More importantly, I see IBM has finally identified a few new growth engines forward. In particular, its hybrid cloud applications and Kyndryl seem to be the key catalysts to rekindle the growth in its Software segment, the company’s largest division. Its Software segment posted a 6% increase in revenues in Q2, thanks to good demand for hybrid cloud applications and increased sales to Kyndryl. And in Q3, this segment continued the strong and growing recurring revenue base. The segment rake in a total of $5.8B in revenue, representing a 14% growth rate, and the growth included about ~8 pts from sales to Kyndryl.
Source: IBM Q3 ER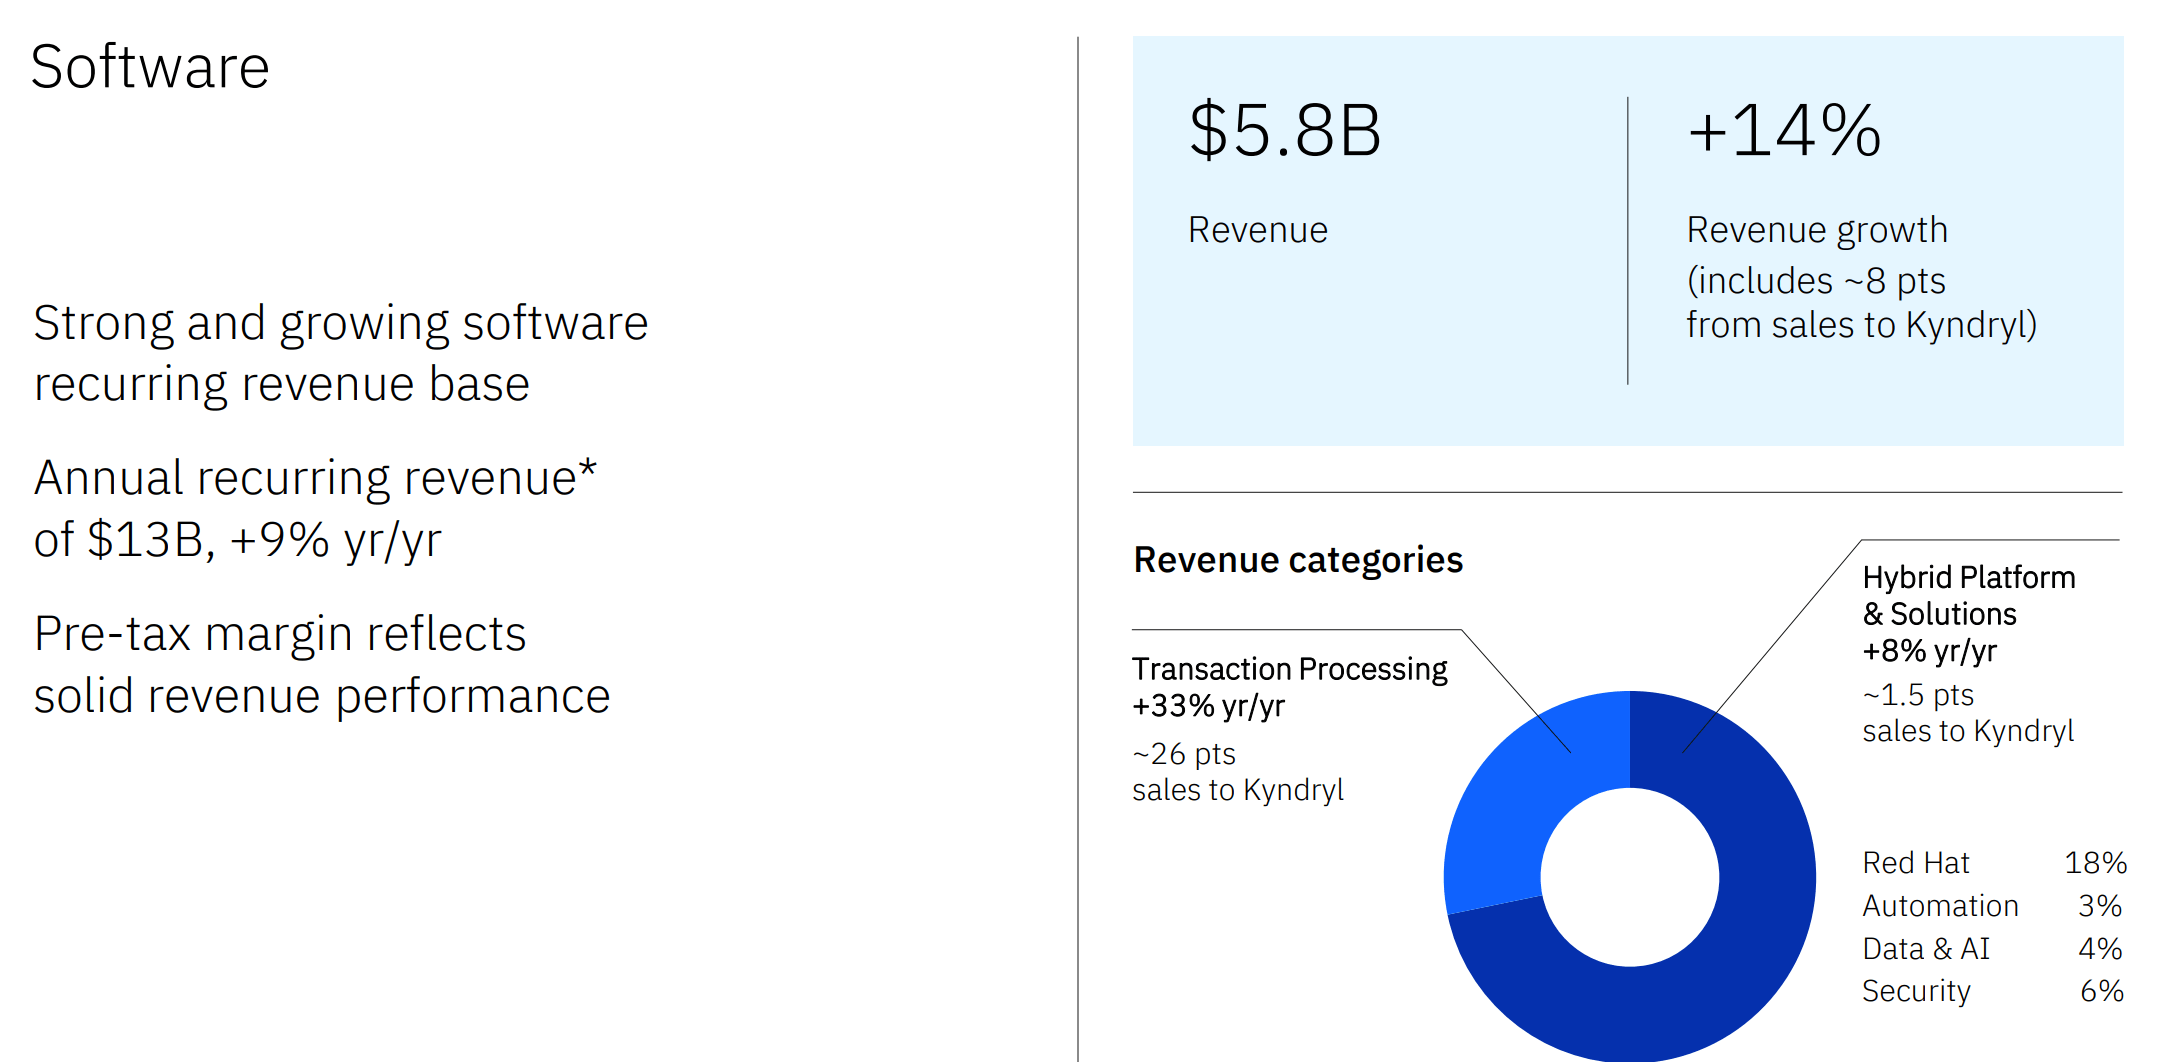
Despite its past struggles with growth, the business has been stably profitable as shown in the chart below. It has enjoyed consistently higher profitability than its cost of capital by a wide margin. Its ROE (return on equity) has been on average 36.5% in the past 5 years as seen. And its ROCE (return on capital employed), a more accurate measure of its profitability, is even higher. Its ROCE has been averaging 68.9% in the past 5 years. Both ROE and ROCE have been dramatically higher than its weighted average cost of capital (“WACC”), which fluctuated in the range between only 6.45% to 7.78% in the past decade.
Source: Author based on Seeking Alpha data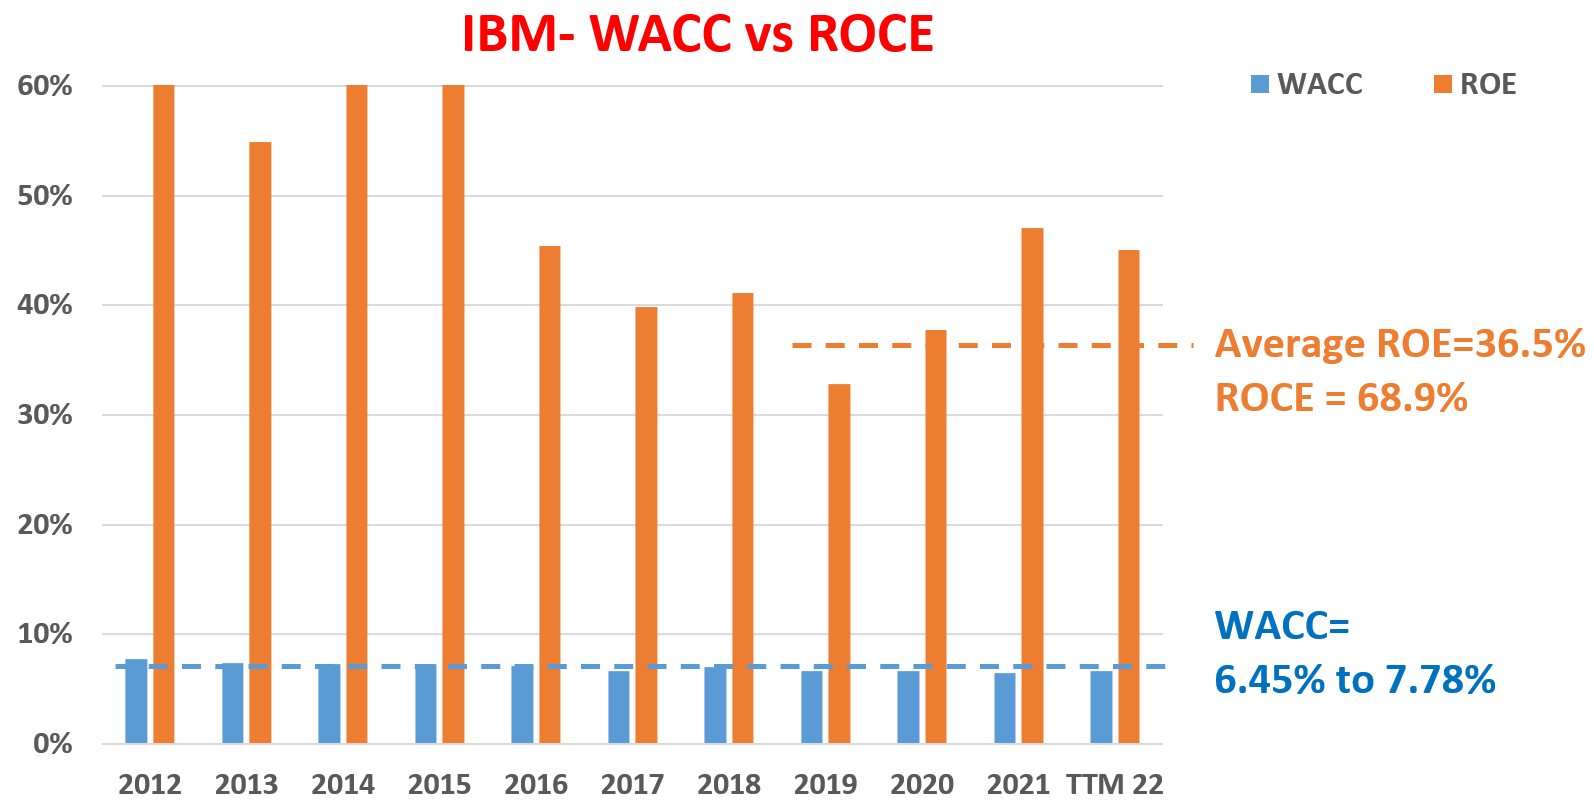
Given its consistent profitability, relatively stable WACC, and also dividend champ status, it is reasonable to apply the discounted dividend model (“DDM”) to assess IBM’s fair valuation. As detailed in my earlier articles:
In the DDM model, the fair price of a business is the summation of all its future dividend payments discounted to their present value. And in this analysis, I will use the WACC quoted above as the discount rate because A) the relatively stable nature of its WACC in the past, and B) WACC is the minimum required return that a business needs to make to overcome the cost of capital.
The DDM analysis for IBM is shown in the table below. The analysis considered a combination of scenarios with varying WACC (in the range between 6.5% to 8.5%) and terminal DGR (dividend growth rates) between 2.5 to 5.0%. The most probable scenarios in my mind are those highlighted in red in the mid of the table. To wit:
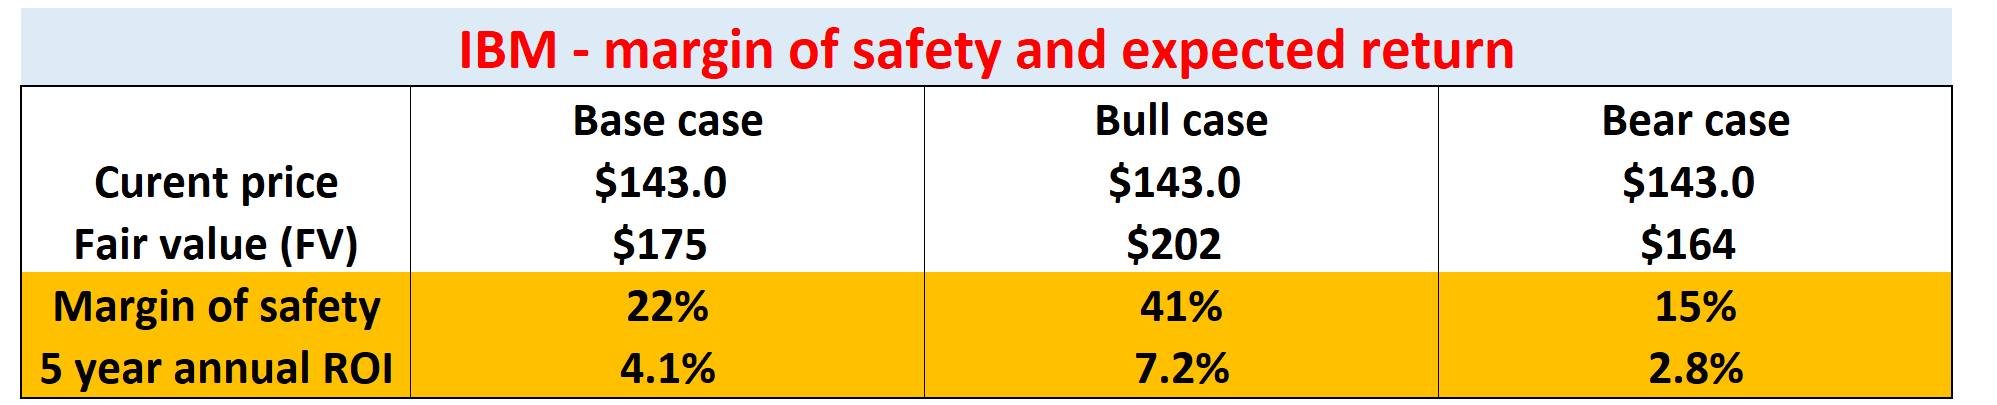
- As a base case, I expect its fair price to be ~$175. This base case considers an average WACC around its historical mean of 7.25% and a DGR of around 3.5%. In this case, its current price of $143 As of this writing represents a margin of safety of ~22%.
- As a bull case, let’s consider a favorable combination of a higher DGR of 4.0% and the same WACC of 7.25%. The fair price in this case would be about $202. In this case, the current price features a really large margin of safety of 41%, and the 5-year annual return is projected to be 7.2% CAGR.
- As a bear case, I considered an unlucky combination of a higher WACC of 7.5% and a lower DGR of 3.5%. Even in this case, the current price still provides a decent margin of safety of about 15%.
Source: Author based on Seeking Alpha data Source: author based on Seeking Alpha data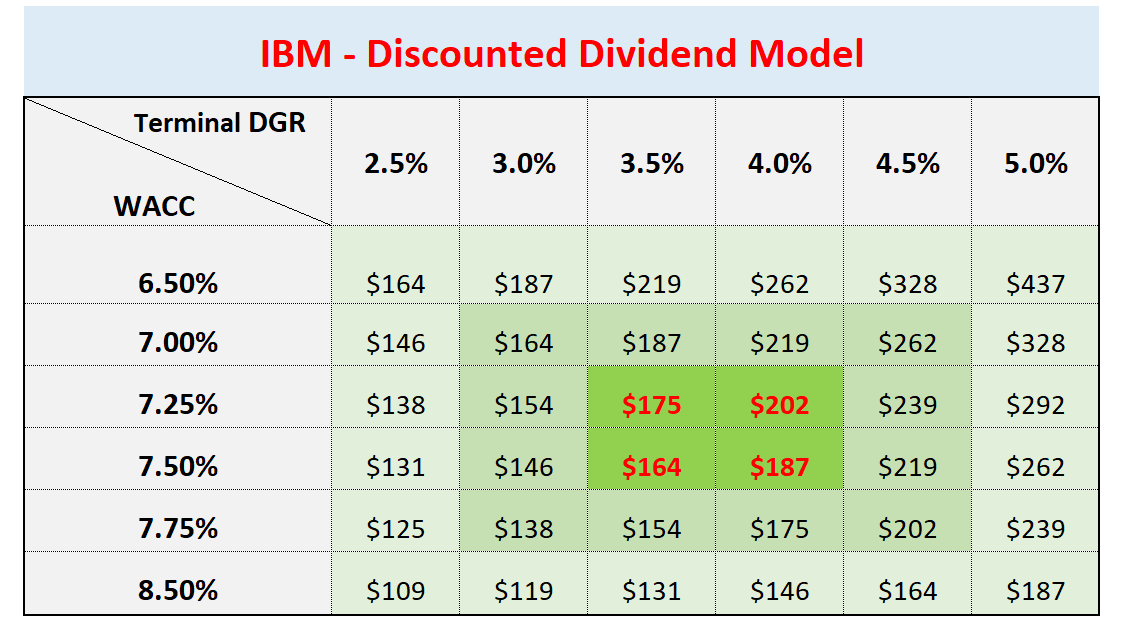
Other risks and final thoughts
To recap, both INTC and IBM have been struggling with a range of headwinds in the past few years. In INTC’s case, it has been suffering both revenue contraction AND simultaneously margins contraction also in recent quarterly. To wit, its Q3 ER reported a gross profit margin of only 45.9%, the lowest level in 10 years. At the same time, it faces tremendous CAPEX requirements due to its IFS initiative. For FY 2022, it expects total net CAPEX expenditures of $21B, with adjusted Free Cash Flow only in the $2-4B range.
In the case of IBM, it has been plagued by declining top-line and bottom-line for years. Both its revenues and cash flow have declined at 1% CAGR consecutive for the past 5 years. Looking forward, the company is still expecting some headwinds. Foreign exchange rates are expected to cause a 6% headwind this year. I also expect its EPS to decline compared to the 2021 tally, as the higher revenues would be very likely to be more than canceled off by elevated research and development expenses.
However, after their Q3 results, I see the silver lining ahead for both of them to resume their growth and recover their stock prices. Their extremely compressed valuations, as reflected in their top spots in the DOTD list, provide a large margin of safety at this point. As argued above, I see key catalysts to rekindle growth at both firms and good odds for both of these dogs to grow out the DOTD list.
Be the first to comment