

Bet_Noire/iStock via Getty Images
The US inflation rate is at or near 8%, as compared to 1.68% a year ago. When inflation started rising last year, the Fed called it “transitory,” but afterwards abandoned this terminology. In my opinion, this was the result of political pressure rather than a decision based on some quantitative assessment. This is because inflation has always been “transitory” in the USA. Focusing on monthly, or year-over-year levels, the rate of change may appear high, but the long-term picture is different, as the chart below shows.
Monthly CPI (SA) with Rate-Of-Change (Price Action Lab Blog – Norgate Data)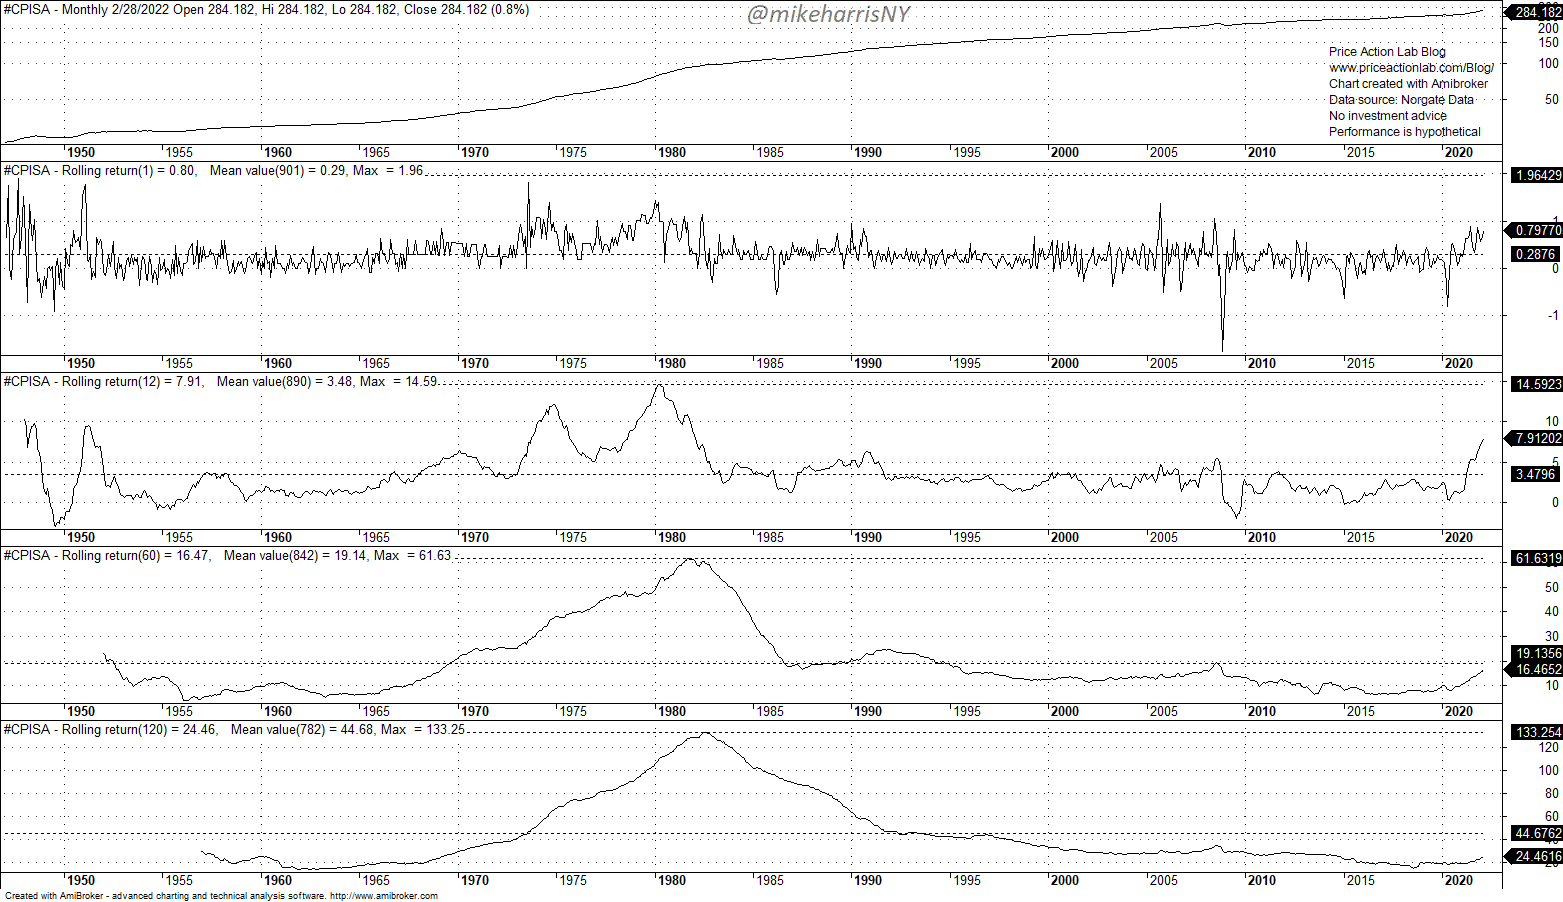
The top chart shows the monthly CPI (Seasonally adjusted) since 01/1947. The next chart is the monthly rate-of-change, which is now at about 0.5%. The maximum was about 2% in September 1947. The next chart shows the 12-month rate-of-change, which is now at 7.9%, with the maximum being 14.6% in March 1980.
Based on the first two charts of rate-of-change, the monthly and 12-month, and despite a twin shock to the economy due to a pandemic and higher commodity prices caused by a supply chain shock and war, the inflation picture is of a resilient economy. Year-over-year inflation at 8% is less than the 1980 maximum inflation by a factor of about 1.8 despite multiple shocks.
The next chart shows the 5-year inflation rate-of-change at 16.5%, well below the mean value of 19.1% calculated over the available sample. The 5-year inflation rate of change is even lower than what was realized in July 2008 at 19.2%, which is a figure close to the average. The maximum 5-year rate-of-change of inflation was 61.6% in September 1981.
The inflation rate-of-change for a 10 year lookback period is at 24.5%, a little more than half the average value of 44.7%. The maximum 10-year rate-of-change was 133.25% in July 1982.
This isn’t a trick to undermine the impact of inflation, but only to show that depending on the lookback period, the perception changes. The Fed executes monetary policy with an impact much slower than monthly inflation changes. It may take time for the policy to work while everyone focuses on monthly inflation changes. The other alternative is to strangle the economy with large rate hikes, forcing a quick recession with inflation naturally dropping due to plunging demand even when there are supply problems. There is also the political aspect of the Fed not being willing to admit this will be a painful ride and thus remove the “transitory” qualification because this doesn’t apply in the short term but only in the long term.
To make a long story short, the recent rate hike was a move to appease that part of the market that follows the “old book” where inflation is an adverse development that can cause markets to crash. But that is a significant portion driven by old economics, and they had to be taken into consideration. There is the “other part” of the market that understands that as long as the US dollar remains a major reserve currency, the chances of inflation remaining on an uptrend are small and at some point it will disappear due to prices naturally reaching a high, causing a fall in demand and a recession.
Despite the reluctance of the Fed to raise rates significantly, the bond market has been hit hard. The US Treasury Bond Total Return Index is down 9.1% from its 2020 highs and down 5.5% year-to-date.
US Treasury Bond Total Return Index With Drawdown Profile (Price Action Lab Blog – Norgate Data)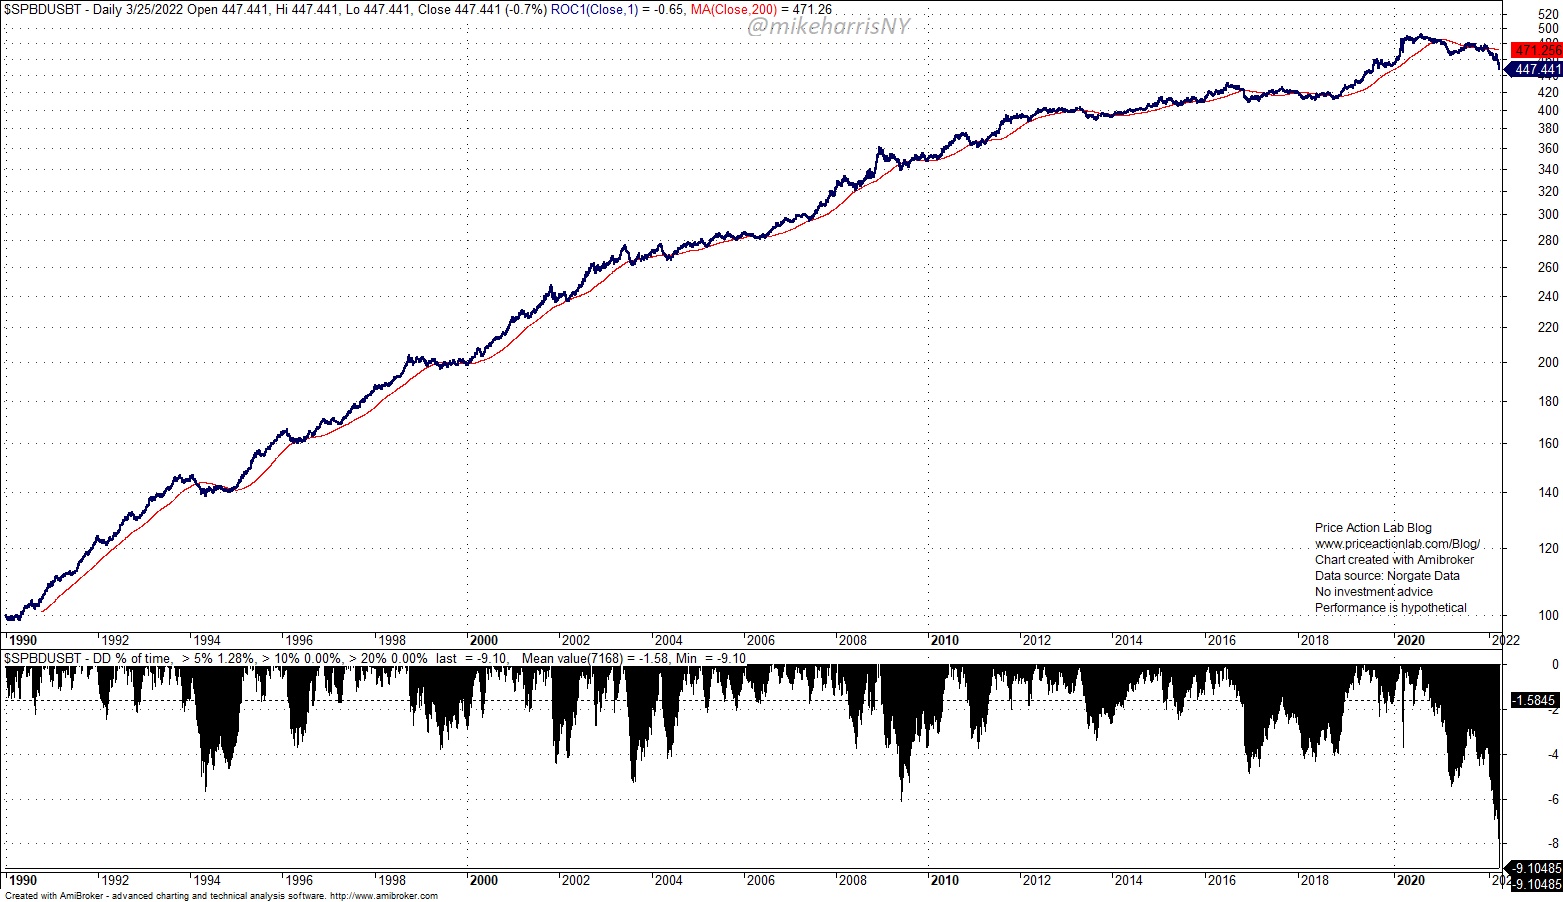
A loss of 9.1% from highs is the most the US Treasury Bond Total Return Index has incurred since 1990. The largest loss before that was 6% during June 2009. This is a significant drop, but the effect is minimized due to the lower duration. The drop from highs in the case of the US Treasury Bond 20+ Year Total Return Index is -23.22%, which is about 3% less than the maximum drop of 26.6% in June 2009.
The popular ETF (TLT) that tracks the above index is also down 23.2% from its all-time highs.
TLT ETF Chart With Drawdown Profile (Price Action Lab Blog – Norgate Data)
Despite the large drop in TLT ETF and the underlying index, the drawdown profile doesn’t show any extreme moves, and historically this has been a volatile market. However, the performance of the 60/40 portfolio in SPY/TLT has been mainly determined in the last 12 years by the rise in stocks. Since January 2010, SPY ETF (SPY) is up 414% versus up 98% for TLT ETF, and as a result, the 60/40 portfolio (without rebalance) has a gain of 287%. With annual rebalancing, the total return drops to about 264%.
SPY and TLT ETFs Charts and 60/40 Portfolio Performance (Price Action Lab Blog – Norgate Data)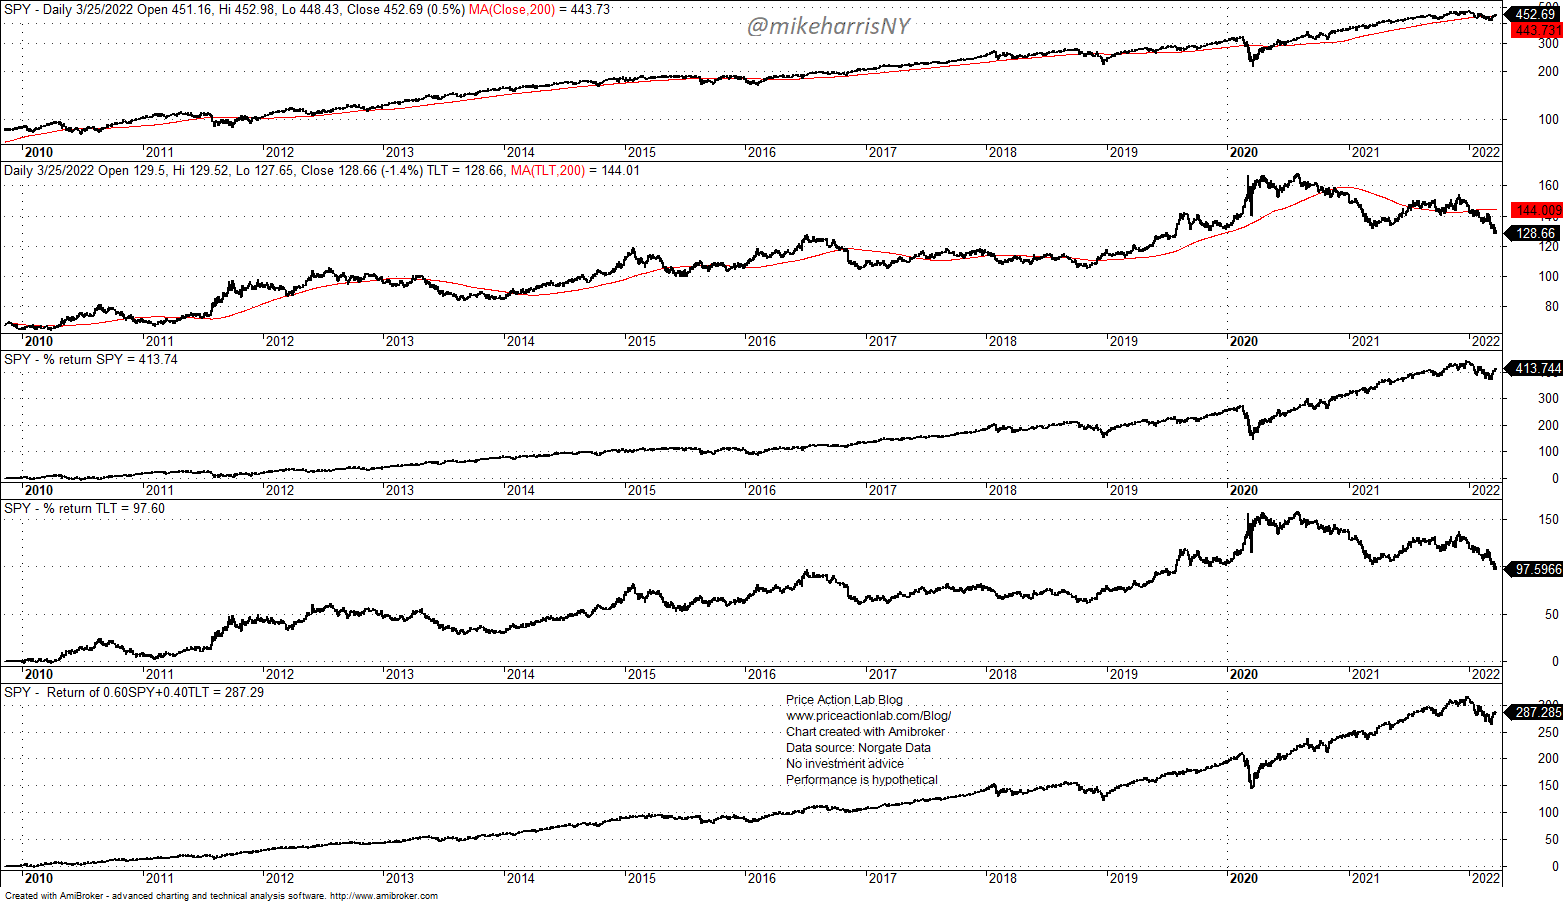
The SPY/TLT 60/40 portfolio is down 7.8% year to date. The largest loss since 2004 was -8.5% for 2008. In another Seeking Alpha article in 2017, I wrote about the risks of the 60/40 portfolio.
Putting it all together
1. The Fed isn’t going to push the economy into a recession because inflation will do that eventually and naturally. They will raise rates as they go while making sure the markets discount them slowly.
2. Inflation is always transitory from a proper reference frame, except in countries where the economy is broken and the currency is worthless. The US dollar is a major reserve currency and will remain such for the foreseeable future. This means that the US economy can absorb a significant rise in inflation without systemic risks.
3. The bond market has overreacted and a rebound may follow soon, especially if the stock market rebound continues. Many bond traders were probably spooked by the relentless publication of articles calling for many interest rate hikes using outdated econometric models that may have worked many years ago but are obsolete at this point in time.
4. My opinion is that there is still a long deflationary supercycle in place due to globalization and technology. Although this dynamic has been disturbed by the pandemic and war in Europe, there will be a reversion soon to the long-term trend. Bond yields will fall, and it’s possible to see the 10-year note yield fall below 0.5% in the next five years. The fall in yields is dictated by long-term dynamics such as demographics and technology, and those take decades to change.
Be the first to comment