

ugurhan
The US Federal Reserve’s preferred inflation metric is “core inflation”, and roughly 40% of this metric is “owners’ equivalent rent” [OER], which is essentially a measure of the average rent paid by US renters. OER is unfortunately a lagging indicator, since rents go up slowly as people sign new leases. If rents head sharply higher, it takes a while before the average rent catches up to reflect this. The issue is well known among economists, and a discussion can be found in many places, including this example by Nobel Prize winning economist Paul Krugman in the New York Times.
One way to reduce the lag, and to get a more current view of inflation today, is to replace the OER with the average rent paid for new leases, for example using only those signed within the last 3 months. Harvard economist Jason Furman has done just that in the chart below, using Private New Rent Indices [PNRI] from sources like Zillow. This provides a much less lagged metric, a picture of what’s happening now, as opposed to 6 months ago.
The lagging and non-lagging metrics imply very different levels of core inflation. OER inflation today is at its highest level in recent history, and is still trending up, indicating that rising rents continue to be a problem. But that’s not at all what’s happening in the real world today. Instead, newly signed leases, as measured by the PNRI, are at lower prices in October than they were in September. That’s rent deflation for the month of October. Since rents account for about 40% of core inflation, this makes a huge difference:
Jason Furman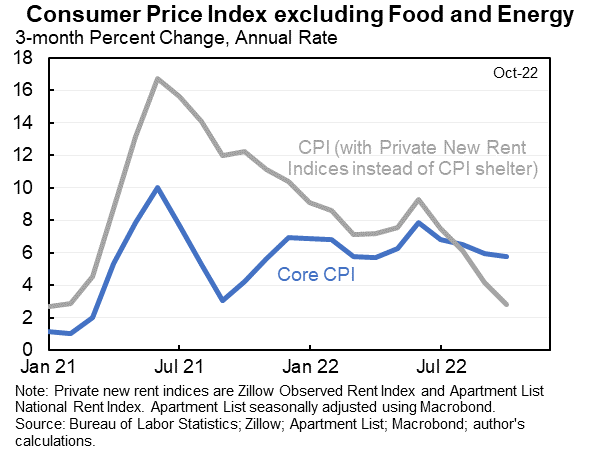
The difference is clearly visible by eye. The grey line on the chart uses a 3 month average of PNRI, while the number for just the month of October 2022 is about 1.4%.
Four takeaways
The 4 takeaways I suggest from the chart above are:
- Using non-lagging rent metrics is very important if one wants to understand core inflation now, as opposed to where it was 6 months ago.
- Core inflation was much worse than reported in 2021. I suspect this is not a surprise to most consumers!
- Core inflation is much lower today than official metrics indicate.
- A simple continuation of the current trend suggests core inflation will be negative in early 2023.
Core inflation and headline inflation
Core inflation is similar to headline inflation but with volatile components like food and energy removed. Economists prefer to look at core inflation rather than headline inflation when they are trying to figure out if the economy needs to be stimulated, or is overheated. Core inflation provides information about the underlying economy, rather than external factors, and is therefore important to help decide on Fed policy. Here’s Krugman on this point:
The reason the Consumer Price Index affects expectations about policy is that it’s supposed to be an indicator of how overheated the economy actually is. We’ve long known that the raw inflation numbers are poorly suited for this purpose. For example: Inflation caused by things like Russia’s invasion of Ukraine isn’t telling us about slack in the U.S. economy. So the Fed has long relied on “core” inflation, which excludes volatile food and energy prices.
The Fed, 2021 through Q1 2022
The Fed hasn’t exactly covered itself in glory over the past two years. Extraordinary measures during the pandemic were clearly called for, and the recovery during 2020 is a major success. I want to be sure to call that out, because sometimes the Fed does a good job.
But the decision to maintain “pedal to the metal” stimulus during 2021 and into early 2022 is puzzling, to say the least. This was a time of:
- Low, declining unemployment
- Growing GDP
- Massive inflation, especially as measured using non-lagging indicators
Normally this would not be a recipe for massive monetary stimulus, yet the Fed maintained both zero interest rates and full quantitative easing [QE] through March of 2022. The justification for this decision was, as best I understand it, no more than a guess that inflation might be transitory. Economist Mohammed El-Erian identified this as the worst inflation call in the history of the Fed (and it’s hard to disagree):
The characterization of inflation as transitory is probably the worst inflation call in the history of the Federal Reserve, and it results in a high probability of a policy mistake… the Fed must… regain control of the inflation narrative and regain its own credibility. Otherwise, it will become a driver of higher inflation expectations that feed onto themselves.
Inflation expectations
The Fed has aggressively raised interest rates in 2022. While the Fed just flat out blew it in 2021 through March of 2022, I think they have been quite right to raise aggressively since then. And the reason for this is that inflation expectations, which may have been in danger of spiraling upwards, are instead firmly under control. This can be seen in bond market data as reported by the St. Louis Fed. Long term inflation expectations implied by the bond market peaked at just over 3% in April of 2022, and have come down to below 2.3% since then. Despite the mistakes of 2021, long term inflation expectations are firmly anchored near the Fed’s 2% long term target.
St. Louis Fed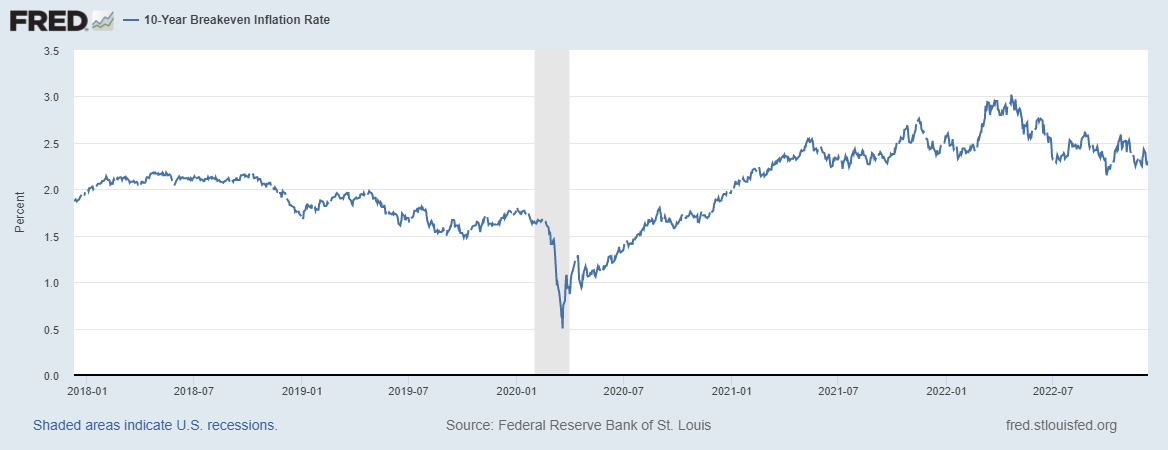
Wage inflation
Wage inflation is often cited as a big problem, with the recent 5.1% YOY wage growth considered a “grim omen” by some economists. But given what is plainly evident with rents as a lagging indicator, a question naturally arises. Is wage inflation also a lagging indicator? And the answer is almost certainly yes. Average wages, like the OER, respond with a lag. Krugman recently had this to say when comparing the two:
average market prices lag well behind new contracts: many apartments are leased and workers hired for a year, so market conditions take a while to show up in average measures… rising official shelter prices largely reflect a surge in rents last year… Recent market rent inflation is low, maybe even negative. Something similar although less drastic may be happening with wages: averages rising bc of a hot market some months ago, new wage deals up at a more moderate pace…
Emphasis mine.
Economic Models vs. Common Sense
With inflation expectations firmly anchored and non-lagging core inflation metrics low and declining, one might argue that now is not the time for “pedal to the metal” interest rate hikes. A simple extrapolation of current core inflation trends implies negative inflation by early 2023. Common sense seems to argue that aggressive rate hikes from here would be a mistake.
Common sense can of course take a victory lap given the obvious mistakes the Fed made in 2021. The “pedal to the metal” stimulus at a time of low and declining unemployment, growing GDP, and high inflation, defied common sense, and was clearly wrong in hindsight. I suspect the Fed’s economic models pointed them toward maximum stimulus at that time, and are likely pointing them toward rate hikes today.
But here’s the thing about models. When the assumptions are wrong, so is the forecast. And economists have never modeled a post pandemic era before, so there’s no data to work with that maps onto what we are seeing today. Here’s Krugman on this point:
We – me too – have been way too quick to jump into data interpretation without thinking enough about wage and price dynamics in the face of disruptions. This time really is different.
Conclusion
The core inflation that we see reported includes a huge component, owner’s equivalent rent, that is highly lagged, reflecting the situation perhaps 6 months ago. Core inflation reported using this metric is well above the Fed’s long term 2% inflation target, suggesting that the economy is running too hot, and that more interest rate increases should be implemented to cool it off.
But there are better ways to compute rent inflation, by using private new rent indexes. These are composed using leases signed within the last 3 months, and provide a much more current view than traditional rent metrics. Core inflation computed using this metric is not only below the Fed’s 2% long term target, it’s heading down at a rate that suggests the US economy will enter deflation in early 2023 if the current trend continues. I do not know if the trend will continue, or if deflation is really coming. But the risk may be higher than is typically reported.
Be the first to comment