

Indian Rupee, US Dollar, USD/INR, RBI, Nifty 50 – Talking Points
- Indian Rupee rose on RBI operation twist to bring up near-term rates
- USD/INR fall could be short-lived as economic picture appears bleak
- Indian lockdown may extend, Nifty 50 trading within a bearish pattern
Indian Rupee Gains on RBI Operation Twist but Gains Risks Being Short-Lived
The Indian Rupee recently appreciated against the haven-linked US Dollar. Gains could be short-lived as the coronavirus threatens domestic growth and the Nifty 50 looks vulnerable to losses. Over the past 24 hours, the Reserve Bank of India (RBI) had to step in with an operation twist as a local t-bill auction drew yields under the central bank’s benchmark reverse repo rate target.

Recommended by Daniel Dubrovsky
Forex for Beginners
In this operation, the RBI bought INR100 billion of long-term bonds while selling an equivalent amount of short-term securities. This helped bring up front-end borrowing costs as the yield on the 10-year bond fell by 20 basis points. Heightened demand for immediate liquidity may have also played a role here, aiding to fuel appreciation in the Indian Rupee.
While these may have supported INR, bleak economic figures paint a difficult trajectory for the currency. In March, Indian exports contracted -34.6% y/y which was the sharpest decline in at least 20 years. Meanwhile passenger car sales slumped by 52.1% in March which is a worrying figure for the world’s fourth-largest car-producing nation. Local vehicle manufacturer Tata Motors has had to halt production on multiple occasions.
Earlier this month, Prime Minister Narendra Modi extended lockdown measures through May 3 to help contain the coronavirus outbreak. The latest figures show Indian cases at 21,700 which is up from 2,543 in early April. An extension of these social distancing measures could further prolong the drag on the economy, risking a deterioration in sentiment that may bode ill for the Nifty 50 and Indian Rupee.

Recommended by Daniel Dubrovsky
Traits of Successful Traders
Indian Rupee Technical Analysis
On a daily chart, USD/INR appears to have broken under a Rising Wedge bearish chart pattern. That could lead to near term losses as prices eye 75.5680. This also followed the presence of negative RSI divergence, a signal of fading upside momentum. If buying pressure resurfaces, prices may revisit resistance at 77.0359 which is the 23.6% Fibonacci extension. Beyond that sits the 38.2% level at 77.9440.
USD/INR Daily Chart

USD/INR Chart Created in TradingView
Nifty 50 Technical Analysis
The Nifty 50 also appears to be eyeing a Rising Wedge. At the time of writing, the prices are trading within the chart formation. A break under the floor of the formation risks opening the door to a reversal of the bounce off lows from April 2016. Otherwise prices may rise to retest lows from October 2018 which may stand in the way as new resistance.
Nifty 50 Daily Chart
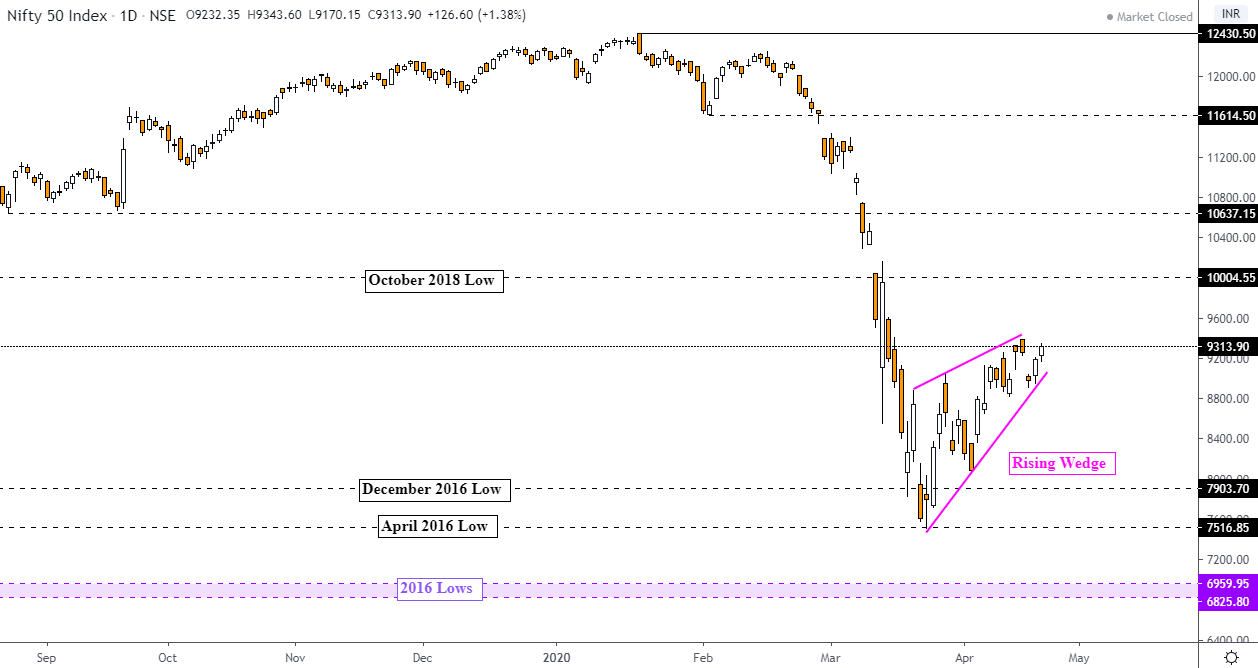
Nifty 50 Chart Created in TradingView
— Written by Daniel Dubrovsky, Currency Analyst for DailyFX.com
To contact Daniel, use the comments section below or @ddubrovskyFX on Twitter
Be the first to comment