

S&P 500 Price Outlook:
S&P 500 Forecast: Index Creeps Toward 4000 Mark, Can it Break Higher?
The S&P 500 is mere points away from breaking the 4,000 mark for the first time in history, an event that would be quite significant given recent market turbulence. The unraveling of Bill Hwang’s Archegos family office saw some stocks crash as risky leveraged bets were unwound and financial institutions were left to foot the bill.
Recommended by Peter Hanks
How to Trade FX with Your Stock Trading Strategy
Despite growing instances of financial instability, the broader S&P 500 and Dow Jones indices trade around all-time highs as the Nasdaq 100 negotiates the ongoing reflation trade. With sentiment intact ahead of Friday’s non-farm payrolls report and further insight on President Biden’s infrastructure plan, the S&P 500 may extend higher if it can break 4,000 once and for all.
S&P 500 Price Chart: 1 – Hour Time Frame (November 2020 – March 2021)

To that end, resistance is incredibly sparse aside from the 4,000 mark which commands respect purely from a psychological standpoint. That said, psychological levels, particularly those situated at a round number, exist for a reason as they can often denote an area where targets or stops are set that can see price accelerate or stall upon approach. Either way, the level serves as a nearby “line in the sand” to the topside that could open the door to an extension higher should bulls break above.
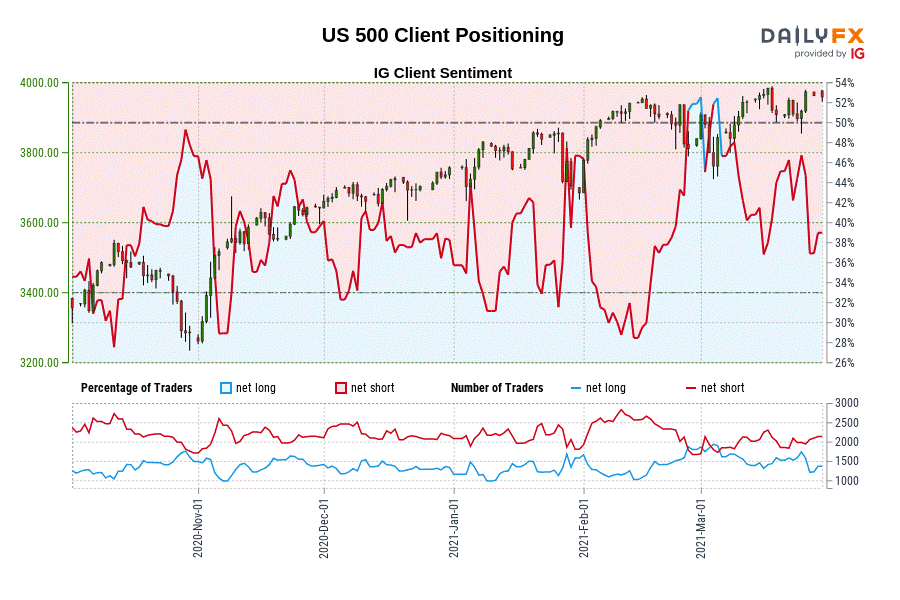
With that in mind, IG client sentiment data reveals retail traders are overwhelming net-short the S&P 500 with a drastic decline in long exposure just last week. Prior shifts in retail exposure to that degree, like early January and early February, saw a subsequent surge in the index although past performance is not indicative of future results. Since we typically take a contrarian view to crowd sentiment, IGCS data might suggest the S&P 500 could push higher.
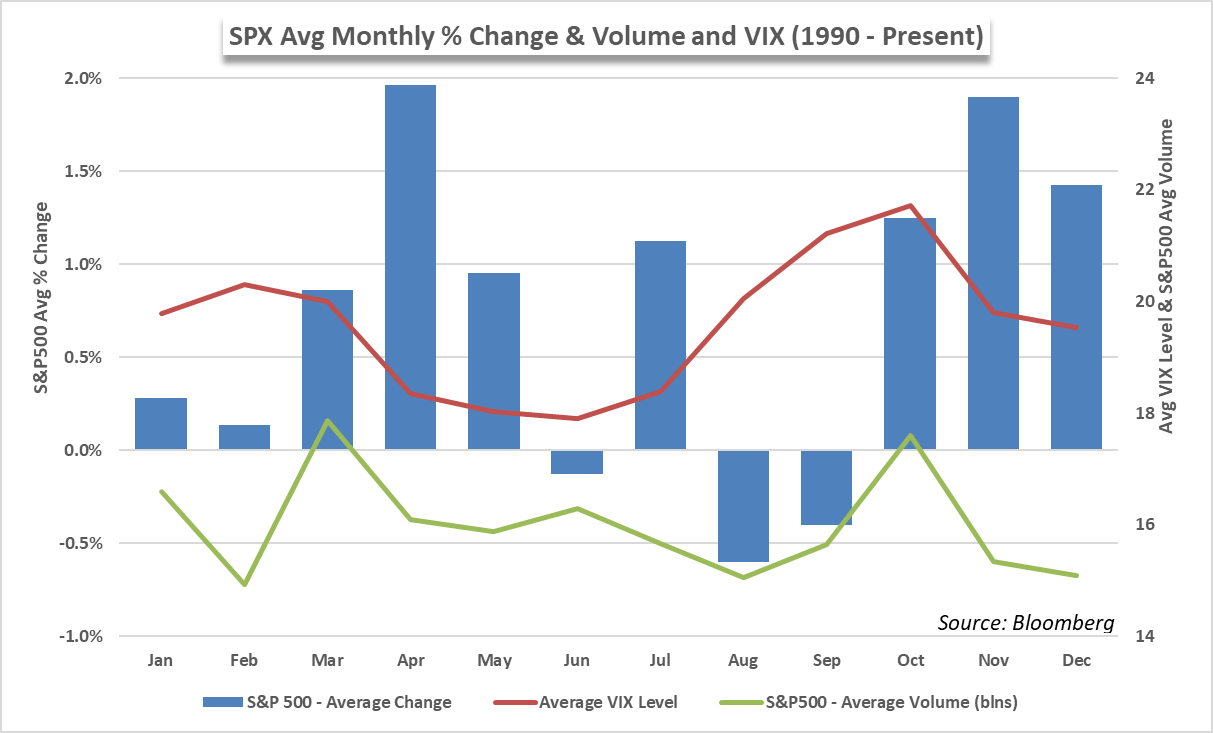
Further still, there is seasonality to consider as April is historically one of the months in which the S&P 500 performs best. In the last 30 years specifically, it boasts the best monthly performance on average. Nevertheless, the week is filled with event risk and liquidity may dry up ahead of the trading holiday this Friday. Thus while there are reasons to be bullish, patience might be rewarded until after the looming event risk has passed.
Starts in:
Live now:
Apr 07
( 15:04 GMT )

Recommended by Peter Hanks
Weekly Stock Market Outlook
–Written by Peter Hanks, Strategist for DailyFX.com
Contact and follow Peter on Twitter @PeterHanksFX
Be the first to comment