

niphon
Incyte Corp. is Moving Higher
Incyte Corporation (NASDAQ:INCY) is a biopharmaceutical company that is outperforming the SP 500 index. There are several bullish indications why INCY could reach $100. In this article, I will outline why I am looking to add to my position.
Chart 1 – INCY Monthly with 6 & 10 Month Moving Averages
www.stockcharts.com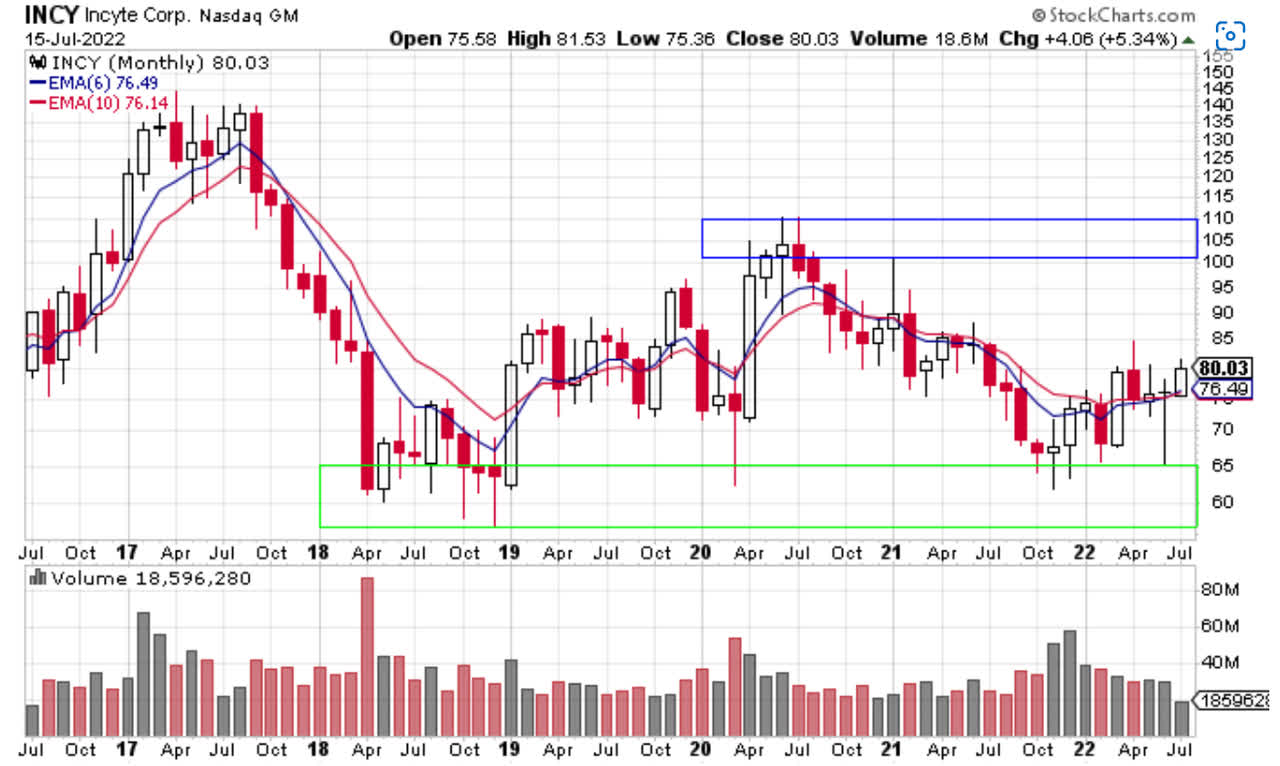
Chart 1 shows INCY on a monthly chart. A few things stand out to me looking at this chart. INCY finds buying support in the $60 area as shown by the green box. This price level has been tested numerous times since 2018 and it has held.
On the opposite side of the coin, INCY hasn’t been able to push thru the $105 price level as that is where sellers have been dominant. In June, price bounced off the support area around $65 and is now at $80. Price has closed above the blue six-month moving average since March. Price has closed above both the six and the ten-month moving averages for the past two months. INCY is currently trading above both moving averages and both moving averages are in bullish alignment. Bullish alignment is when price is above both the fast (six-month) and slow (ten-month) moving averages, and both moving averages are trending higher.
I recognize that the month is not over and things could change. Right now, though, INCY looks bullish on the monthly chart.
Chart 2 – INCY Weekly with 30-Week Moving Average & Relative Strength
www.stockcharts.com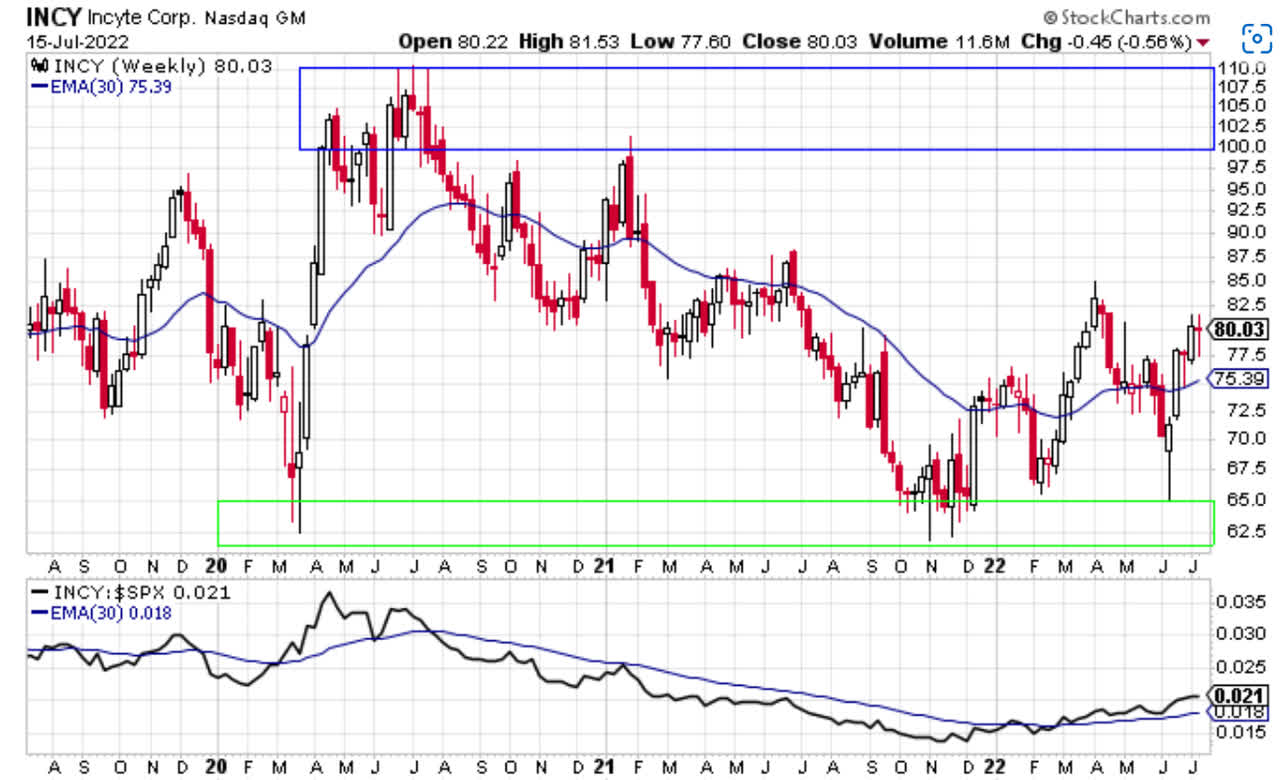
Chart 2 is a weekly chart of INCY and it too looks bullish. Since November 2021, INCY has been making a series of higher highs and higher lows. This is the definition of an uptrend. INCY bounced off the support area around $65 and moved as high as $85. It pulled back to the support area one more time and then moved higher. Now INCY is back above a rising 30-week moving average. The 30-week moving average has been in a downtrend since August 2020, and now it is starting to work its way higher. It too is making a series of higher highs and higher lows. That is a definite bullish development.
The INCY:$SPX ratio in the bottom panel of Chart 2 is a relative strength chart. That ratio bottomed in December 2021 and is now trending upwards. The 30-week moving average is also trending higher which is bullish. INCY is outperforming the SP 500 on an intermediate timeframe. If the SP 500 index has already put in its bottom, and I know that is still up for debate, INCY looks to be one of the leaders in the next leg of the bull market.
Chart 3 – INCY Daily Chart
www.stockcharts.com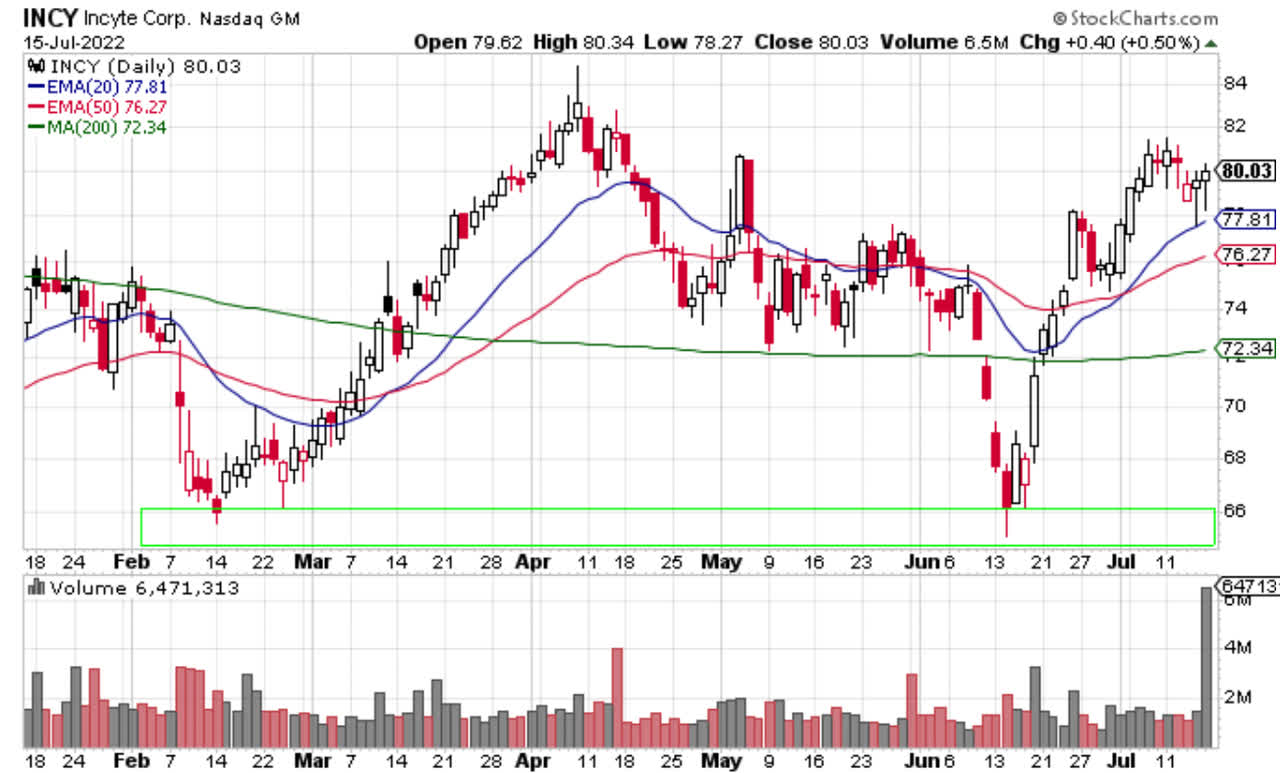
Chart 3 shows INCY on the daily chart. You can see INCY moving higher on the daily timeframe. The daily chart is also a good place to see the base that INCY has built. INCY has a nice double bottom price pattern where price tested the $66 area in February and in June. Since June, INCY has climbed higher with bullish volume as well. It looks like institutions have been positioning themselves into INCY.
In today’s market environment, INCY is an oddity. INCY is one of the few stocks in the SP 500 index that is above its 20-day, 50-day, and 200-day moving averages. And all those moving averages are trending higher. By my count, there are 48 stocks in the SP 500 index that are in that condition. Sixteen of those stocks are in the healthcare sector. Four of those 16 are in biotechnology as INCY is one of those.
My initial purchase of INCY was back on 5 July. I am looking to add to INCY on a break above $80.40, which is the high of the last price candle on the chart. My target price for INCY is $100. That works out to a 24% return.
I like the idea of adding to a position that has built a nice base over a period of months. That base has been tested, and the support level has held. Price has moved higher with bullish price action as well. This tells me that institutions are accumulating shares.
INCY is outperforming the SP 500 index over the intermediate term. All those factors are bullish and are why I am adding to my position.
Be the first to comment