

JHVEPhoto
Prudential (NYSE:PRU) reported Q3 results on August 2nd, substantially missing the consensus EPS for the quarter. The negative earnings surprise was largely attributed to the company increasing reserves on life insurance policies, following a review of current data. The increased mortality rates resulting from COVID-19 have been something of a curve ball for life insurers, and adjusting rates to account for an ongoing endemic, albeit with the potential for improved vaccines, will take some time to dial in.
While the shares initially fell after the Q3 earnings report, they have since recovered and now exceed the pre-earnings level. Even with this bounce, Prudential shares have fallen 16% since closing at $121.06 on April 20th, just slightly below the trailing 12-month high closing price of $121.38 from February 10th.
Seeking Alpha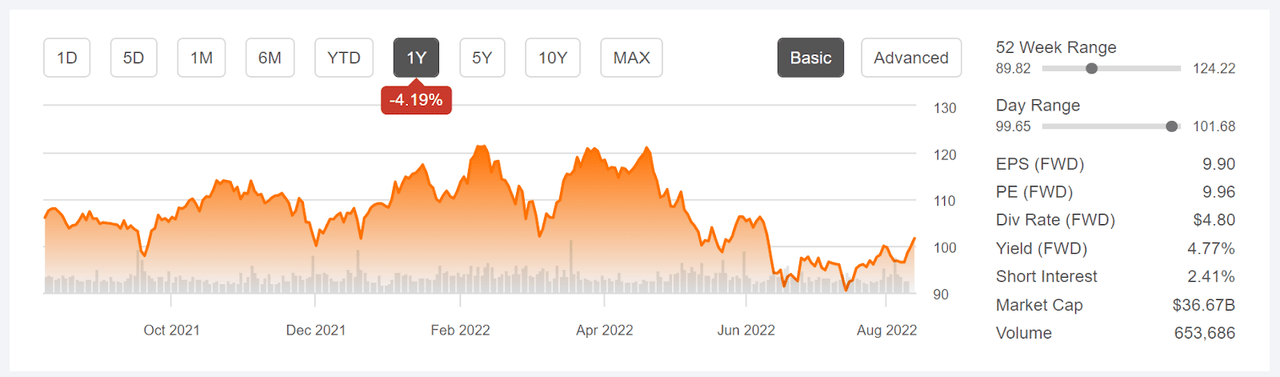
12-Month price chart and basic statistics for PRU (Source: Seeking Alpha)
The Q2 EPS was the lowest for any quarter in the past 4 years. Excluding Q2, the earnings over the past 2 years have been strong, beating expectations in every quarter.
E-Trade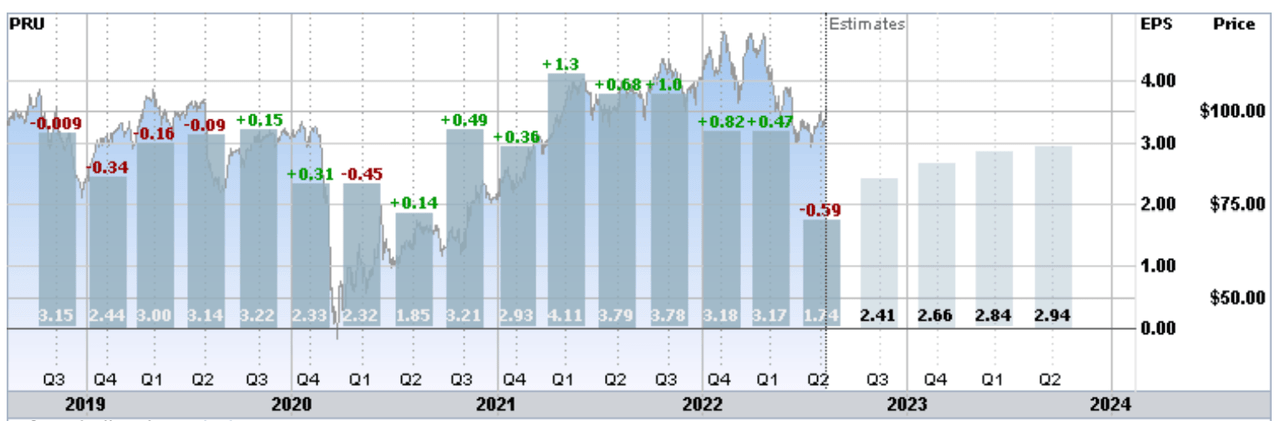
Trailing (4 years) and estimated future quarterly EPS for PRU. Green (red) values are amounts by which EPS beat (missed) the analyst consensus (Source: E-Trade)
With the dividend increase for 2022, PRU’s forward dividend yield is 4.77%. This is on the high end as compared to peers, but not extraordinarily so. PRU has increased its dividend for 13 consecutive years. The 3-, 5-, and 10-year dividend growth rates are 7.3%, 10.1%, and 12.5% per year, respectively. On the basis of the Gordon Growth Model, an expected return in the range of 12% to 15% per year is plausible, as long as the past dividend growth rates are sustainable.
In general, life insurance companies benefit from rising interest rates (also see this article). An easy way to examine interest rate sensitivity of a public company is to examine the correlation between total return on a stock and percentage changes in the 10-year Treasury yield. A positive correlation indicates that the stock tends to gain with rising rates, and vice versa. I have calculated the correlation between rolling total return on PRU and the percentage change in the 10-year Treasury yield for different time scales and historical periods.
Geoff Considine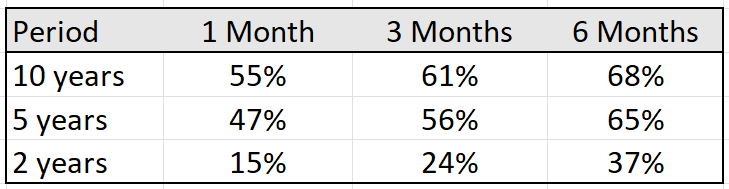
Correlations between percentage changes in the 10-year Treasury yield and total return from PRU (Source: Author’s calculations using data from Yahoo! Finance)
The correlation between 1-month return and 1-month change in the 10-year Treasury yield is 15% over the past 2 years, 47% over the past 5 years, and 55% over the past 10 years. The strength of the positive correlation increases with the time scale and with longer historical periods. These results show that PRU has tended to perform when interest rates and bond yields increase.
I last wrote about Prudential 7 months ago on January 12, 2022, at which time I maintained a bullish/buy rating. In the period since, the shares have returned -10.2% (including dividends), as compared to -10.3% for the S&P 500 (SPY). At that time, PRU had returned 47.5% over the past year. The Wall Street analyst consensus rating was neutral, and the consensus 12-month price target was very close to the share price at that time. The analyst consensus was that there was essentially no upside. The valuation looked reasonable, with a forward P/E of 8.25 and a dividend yield of 4.0%. The consensus view implied by the price of options on PRU, the market-implied outlook, was slightly bullish to the middle of 2022 and neutral to January of 2023.
For readers who are unfamiliar with the market-implied outlook, a brief explanation is needed. The price of an option on a stock is largely determined by the market’s consensus estimate of the probability that the stock price will rise above (call option) or fall below (put option) a specific level (the option strike price) between now and when the option expires. By analyzing the prices of call and put options at a range of strike prices, all with the same expiration date, it is possible to calculate a probabilistic price forecast that reconciles the options prices. This is the market-implied outlook. For a deeper explanation and background, I recommend this monograph published by the CFA Institute.
Over the 7 months since my last post on PRU, interest rates have continued to rise and PRU’s dividend yield has increased substantially, from 4.0% to 4.77%. I have calculated an updated market-implied outlook for PRU and I have compared this with the current Wall Street consensus outlook in revisiting my rating on PRU.
Wall Street Consensus Outlook for PRU
E-Trade generates the Wall Street consensus outlook for PRU using ratings and price targets from 9 ranked analysts who have published opinions over the past 3 months. The consensus rating continues to be neutral/hold, and the consensus 12-month price target is 2.2% below the current share price.
E-Trade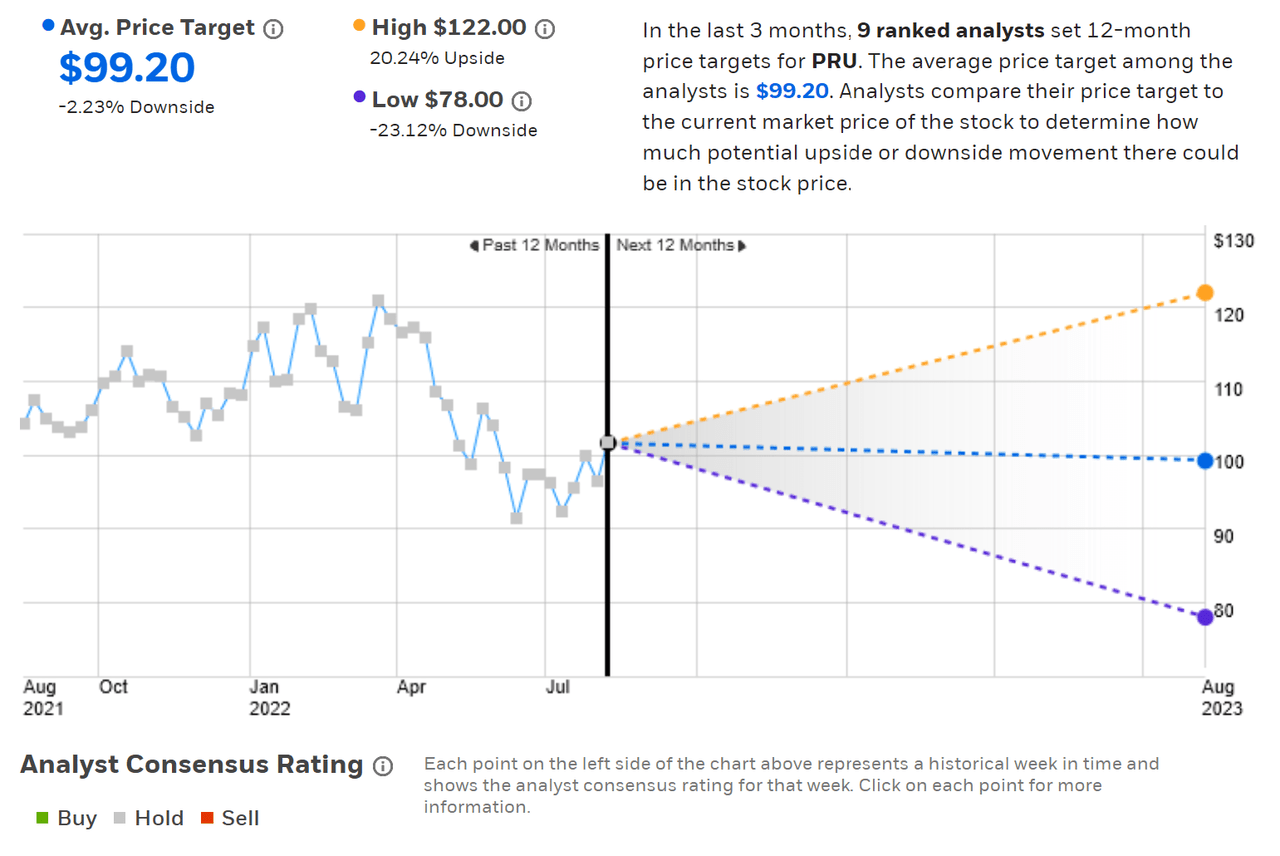
Wall Street consensus rating and 12-month price target for PRU (Source: E-Trade)
Seeking Alpha’s version of the Wall Street consensus outlook is calculated using ratings and price targets from 17 analysts who have published their views over the past 90 days. The consensus rating is neutral and the consensus 12-month price target is 0.5% below the current share price.
Seeking Alpha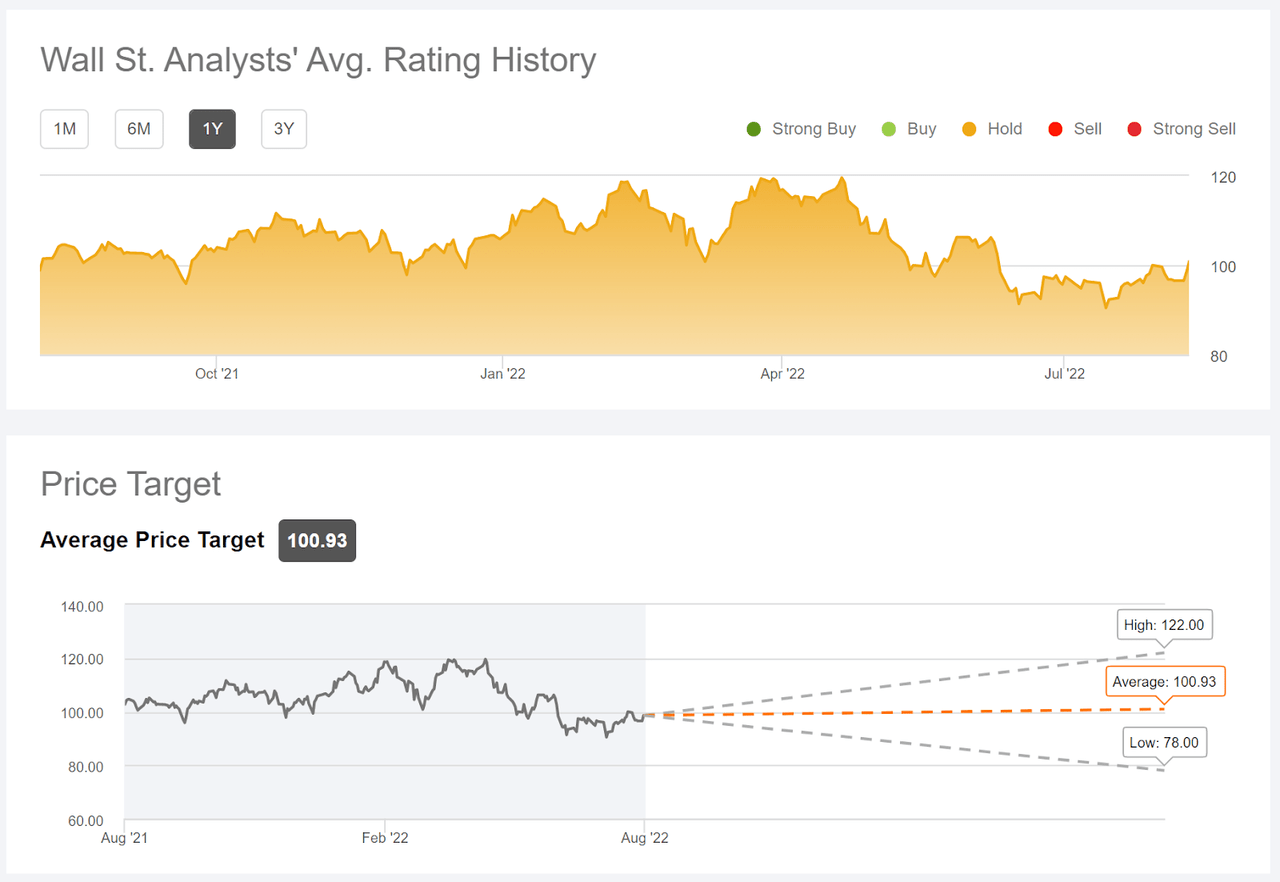
Wall Street consensus rating and 12-month price target for PRU (Source: Seeking Alpha)
Similar to the situation in January, the consensus rating is neutral and the 12-month price target is slightly below PRU’s current share price. Both the share price and the price target have fallen over recent months.
Market-Implied Outlook for PRU
I have calculated the market-implied outlook for PRU for the 5.3-month period from now until January 20, 2023, using the prices of call and put options that expire on this date. I selected this specific expiration date because the options expiring in January are heavily traded, increasing confidence in the representativeness of the consensus view. In addition, I created the market-implied outlook in April using this expiration date, which makes for an interesting comparison.
The standard presentation of the market-implied outlook is a probability distribution of price return, with probability on the vertical axis and return on the horizontal.
Geoff Considine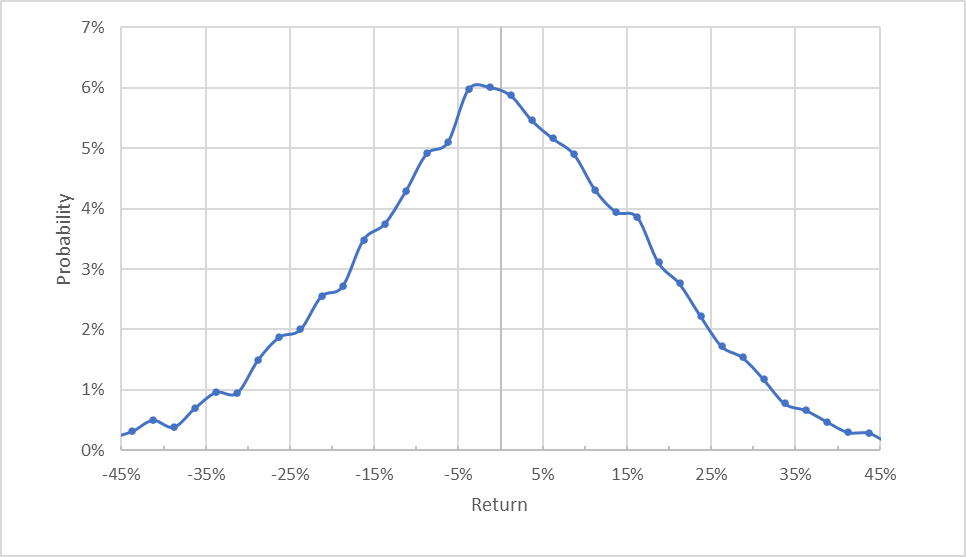
Market-implied price return probabilities for PRU for the 5.3-month period from now until January 20, 2023 (Source: Author’s calculations using options quotes from E-Trade)
The market-implied probabilities are generally symmetric, indicating comparable probabilities of positive and negative returns of the same magnitude. The peak in probability is slightly tilted to favor negative returns. The expected volatility calculated using this distribution is 30.9% (annualized), as compared to 30.4% for the outlook calculated using this same option expiration date in January. For context, the annualized volatility of the S&P 500 over the past 3 years is 19.2%.
To make it easier to compare the relative probabilities of positive and negative returns, I rotate the negative return side of the distribution about the vertical axis (see chart below).
Geoff Considine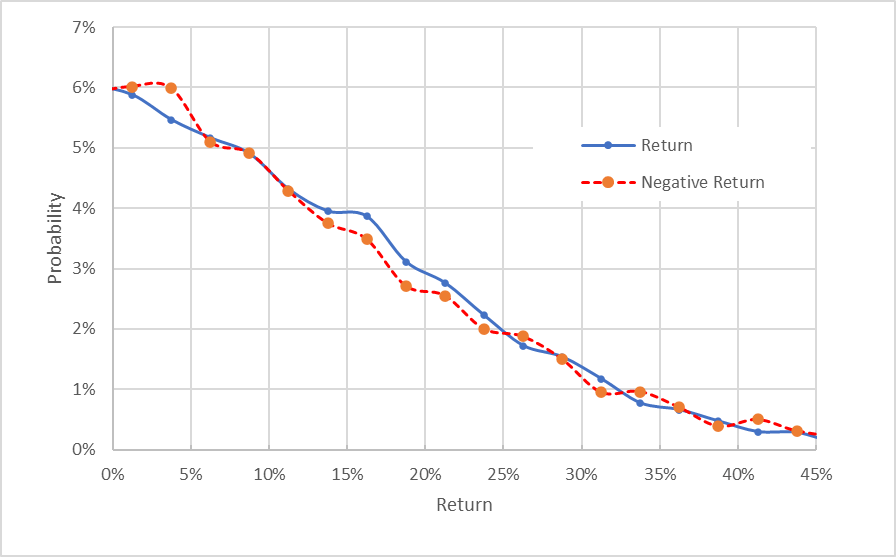
Market-implied price return probabilities for PRU for the 5.3-month period from now until January 20, 2023. The negative return side of the distribution has been rotated about the vertical axis (Source: Author’s calculations using options quotes from E-Trade)
This view highlights how closely the probabilities of positive and negative returns match (the solid blue line tracks very closely with the dashed red line). Theory indicates that the market-implied outlook is expected to have a negative bias because investors, in aggregate, are risk averse and thus tend to pay more than fair value for downside protection. There is no way to measure the magnitude of this bias, or whether it is even present, however. This expected bias makes the market-implied outlook look slightly bullish.
The market-implied outlook to January 20, 2023 from January of 2022 exhibited slightly elevated probabilities of negative returns. The current outlook to January 2023 is slightly bullish, suggesting that the options market now has a somewhat more positive view on PRU into early next year.
With PRU trading at $101.45, the bid price for a January 20, 2023 call option with a strike price of $105 is $5.30. Buying the shares at $101.45 and selling the call option at $5.30 provides a premium yield of 5.2% over the next 5.3 months, in addition to an anticipated 2.37% in dividend yield over this period (2 payments of $1.20). The total income from buying the shares and selling the calls is 7.57% over 5.3 months, in addition to retaining up to 3.5% of potential price appreciation. If the shares end up over $105 when the options expire, this position provides about 11% in total return over 5.3 months. If the shares decline, the option premium income and dividends help to offset the losses.
Summary
There are two major sources of uncertainty for PRU that the company cannot control. The first is whether interest rates will continue to rise. Further increases should tend to boost earnings. The just-released inflation data, while lower than last month, is still very high. The Fed may raise rates more slowly than so far in 2022, but rates are expected to continue to rise. The second major uncertainty for PRU is the ongoing impacts of COVID on mortality and, as a result, on life insurance payouts. Against this backdrop, PRU is reasonably priced and the forward dividend yield is a robust 4.77%. The Wall Street consensus outlook for PRU is neutral, and the 12-month price target indicates that the shares are fully priced. The market-implied outlook to early 2023 is slightly bullish, although the expected volatility is moderately high. The market-implied outlook indicates a 1-in-5 chance of a price drop of 15.5% or more over the next 5.3 months, for example. The most obvious appeal of PRU will be to income investors, given the high dividend yield and dividend growth rates as well as the substantial income from selling covered calls. I am maintaining my buy/bullish rating on the shares.
Be the first to comment