


wildpixel
Investment Summary
Following our last publication on Inari Medical, Inc. (NASDAQ:NARI), where we discussed our trade thesis, the stock has unfortunately done a whole lot of nothing. You can see below the summary of price performance since this point.
As a quick reminder, here is the trade thesis, taken directly from our last NARI publication [you can read it here, we suggest you do]:
BUY 2,530 NARI SHARES at $79.05/SHARE for 2,500bps [$200k principal] // 70bps value asymmetry- PAY $74 at 9.35x book value; 28% return objective to $100
Unfortunately, we were hoping for more from NARI on the chart by this point. Nevertheless, we’re back today with a review of the investment thesis, and we’ve made little to no changes to our outlook. After the company’s Q3 numbers we remain constructive on the stock and locked our suggested price objectives again at the $90–$100 range.
Net-net, we remain buyers of NARI and will hold our position until we see a >15% pullback from the current share price.
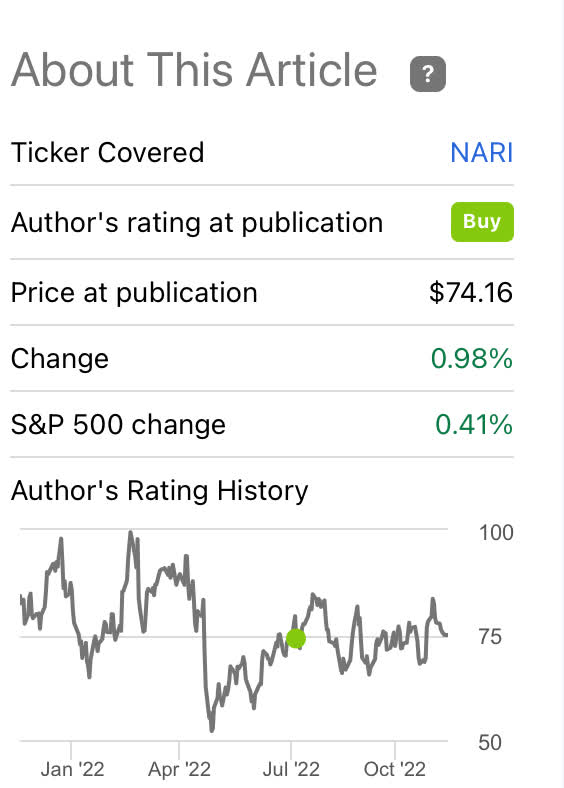
Data: Seeking Alpha
First review of Q3 financial results
Turning to NARI’s Q3 numbers, we note strengths across the P&L from procedural growth across its ClotTriever (“CT”) and FlowTriever (“FT”) portfolio. Management also noted that it’s introduced several new complementary products to both product lines.
As such, we saw that revenue share for CT landed at 31% with the remaining 61% booked from FT turnover. This was about the same split compared to this time last year.
Switching to specific operational highlights, we saw a healthy level of torque building in the company’s flywheel. Our takeouts are as follows:
- NARI exited the quarter with ~275 territories under its umbrella. You may or may not remember that management established the 275 number as a goal earlier in the year. In fact, it completed its largest hiring spree in Q2, but wound the pace of hiring back last quarter. Moreover, the company affirms that as its sales force expands, this results “in smaller and smaller territories”. We believe this places NARI well to penetrate its growth markets and accelerate its existing accounts.
- Revenue growth of 32% YoY came in to $96.2mm, a sizeable gain from ~$73mm a year ago. The growth was underlined by the acceleration in customer accounts and sales forces expansion, as mentioned. As such, quarterly OpEx increased 38.34% YoY to $94.9mm from the larger variable expenditure tied to revenue growth. A comprehensive view of NARI’s quarterly operating results from FY19–date is seen in Exhibit 1.
Exhibit 1. Sequential build up in revenue = fundamental momentum, by estimation
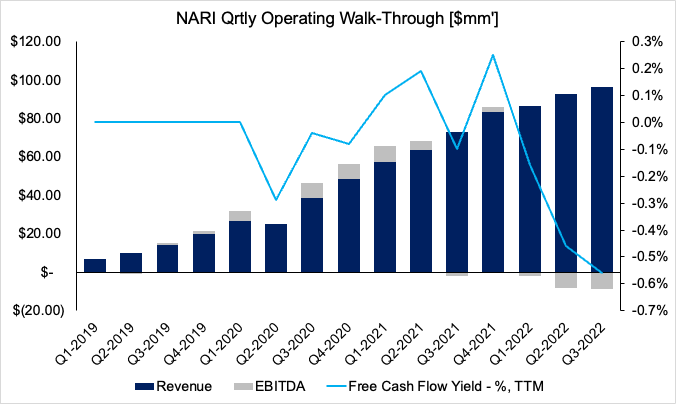
Data: HBI, NARI SEC Filings
Management raised FY22 revenue guidance to $373–$375mm, from a previous $360-$370mm. It also expects to be “consistently profitable” by H1 FY24. Given its growth percentages at the top-bottom lines to date, we believe this to be a fair and reasonable expectation.
We project NARI to print a series of operating losses into FY23, before stretching EPS up to $0.24 by FY24 [Exhibit 2]. You can see our full projections for NARI’s income into FY24 in Appendix 1, located at the end of this report.
Exhibit 2. NARI FY22–24’ EPS growth assumptions. By the looks of it, FY24 looks to be an inflection point.
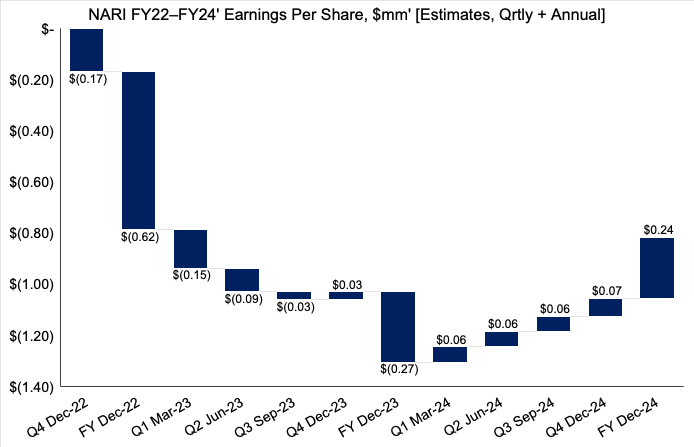
Data: HBI
NARI: The technical picture
Before we jump into specific technical studies for NARI, it’s important to understand the current macro backdrop.
Yields at the long end of the curve continue to hover at ~350–400bps as of November. There’s been a slight reversal in yields since the double bottom in treasuries in October, leading the stock/bond correlation lower at the same time [Exhibit 3, bottom frame].
The good news is that the slight flattening of yields looks to have helped growth stocks find a momentary bottom, if not then at least helped their latest snapback rally [Exhibit 3, top window, red line].
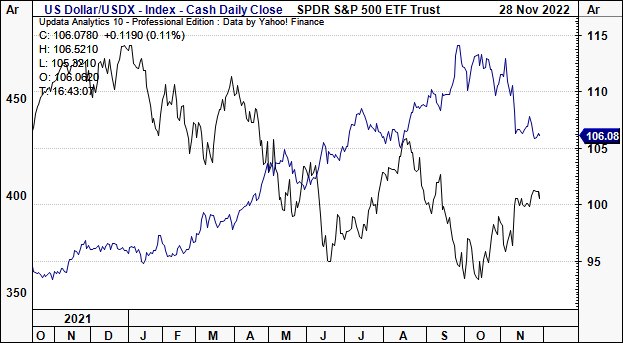
Exhibit 3. Question now turns to where yields, macro-indicators head next, and what this means for equities
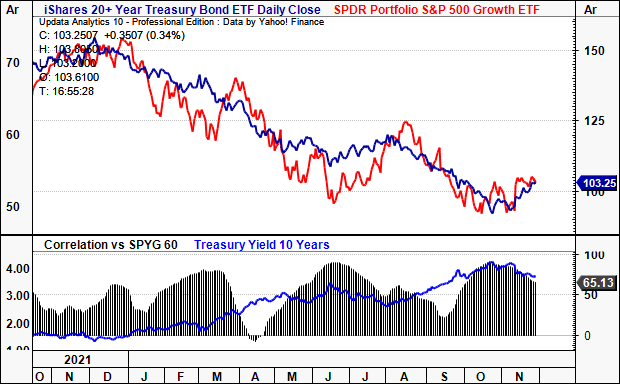
Data: Updata
We’re also seeing a cooling of the USD from its September highs, as traders rush to evaluate the latest set of economic data around inflation, rates, central bank tightening and of course, economic growth.
That’s all okay in our eyes as the USD [Shown below via the DXY] is a widely accepted proxy for investor risk appetite. The rally of 2022 suggested investors were fleeing to quality assets, perhaps in fear of a wider collapse in asset prices. Plus, cash has embedded optionality, allowing investors flexibility in the current regime, whilst collecting a yield of c.4% if holding USD liquidity in the form of short-dated T-bills for the savvy investor.
One can clearly see the corresponding impact to equity markets with the latest consolidation.
Exhibit 4. USD to S&P 500 covariance, last 12 months
Data: Updata
Despite the near-term reversal, the spread between value and growth remains at its highest since March this year [Exhibit 5]. Here, we benchmarked the S&P 500 growth and value indices as proxies respectively, shown in red and blue respectively in the chart below.
We accept this could be a risk in our NARI thesis, seeing as investors are positioning arguably more defensive that in broad market rallies in past times. By the way, there are multiple derivatives strategies [both in futures and options] to hedge this downside risk.
Exhibit 5. Value/Growth spread remains wide for 2022 standards and looks to be diverging further. Could be a key risk to NARI positioning.
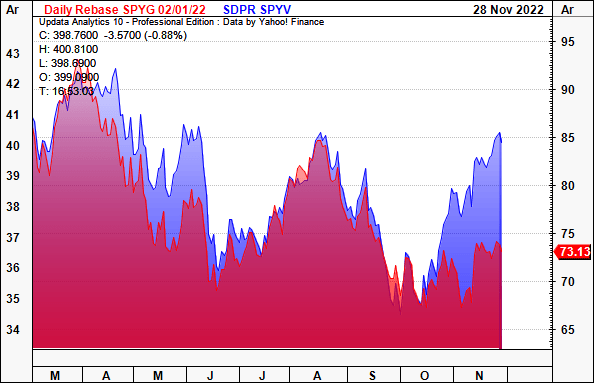
Data: Updata
Switching to NARI’s technicals, the following series of studies outlines our key findings. Last time, we made note of key Fibonacci retracement levels, along with various other market data showing relative strength to the benchmark and the broad healthcare sector [see: previous report, Exhibits 3, 9, 10] .
Turning to Exhibit 6, we note the stock has caught a strong bid since June 2022 and traded in an ascending channel for 28 weeks. Prior to this, it was trading sideways for the good part of a year, backing and filling until the December 2021/January 2022 selloff.
Whilst the ascending base has been forming since June this year, at the same time, it has faced resistance from the top, failing to break the ceiling of the descending wedge shown below. The mouth of the wedge is squeezing with short-term velocity from a strong base of support, where the stock has also bounced from its 50DMA nicely since September.
You’ll also see that each week there’s been volatility between weekly openings/closes across the entire testing period.
Exhibit 6. NARI 18-month price evolution [weekly bars, log scale]
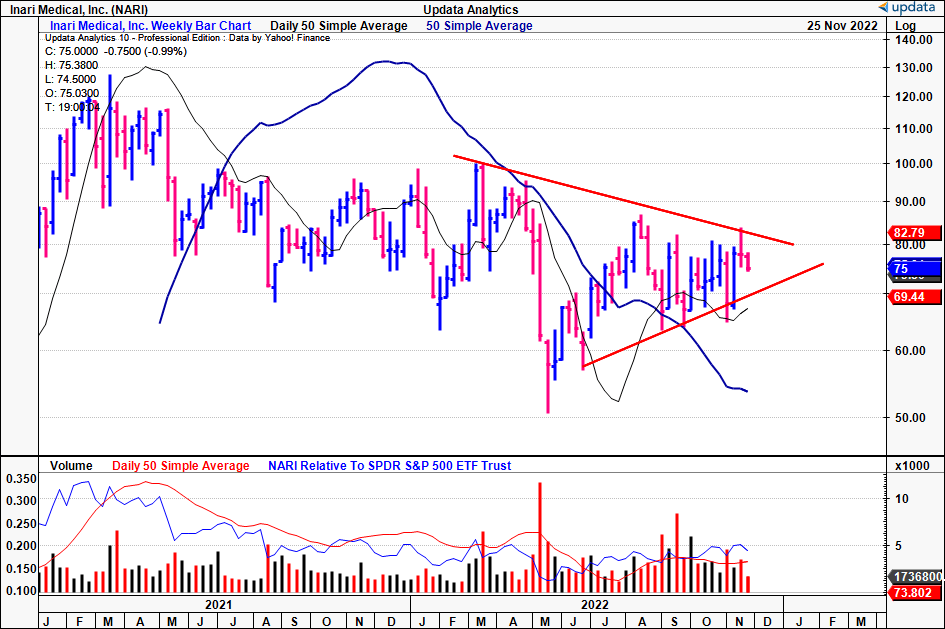
Data: Updata
Adding a bullish tilt, we see the stock trading above cloud support with the lag line currently testing the cloud. Prior to this it spent time backing and filling within the cloud before a breakout and reversal to its current position. Moreover, we see that on-balance volume has been treading north at gradual pace. Momentum studies demonstrate the lack of upside/downside capture across this YTD.
To us this demonstrates the challenges NARI has faced on the chart this year. Since our last report, we’ve yet to see substantial buying support to see the stock rally back to previous highs.
Exhibit 7. Testing cloud support with OBV trending north at gradual pace
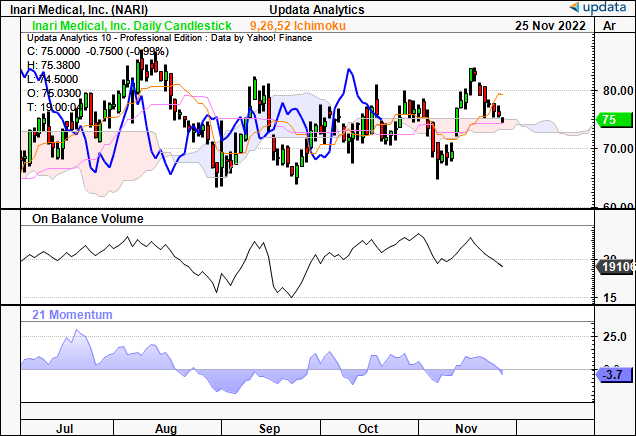
Data: Updata
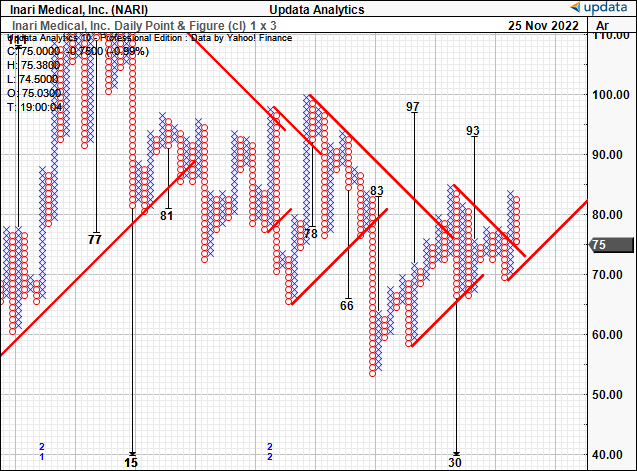
Alas the question really becomes one of price visibility looking ahead. Last time, we saw upside targets to $97 on the point and figure analysis, a figure that still remains in place [Exhibit 8].
Since then, the stock has pushed above the latest outer resistance line and we now see additional upside targets to the c.$95 range, adding greater confidence to this estimate.
With that data in mind there seems to be good corroboration around the $90–$100 mark, as we had discussed previously.
Consequently we retain our buy thesis on the stock, and reaffirm our suggested price range of $90–$100.
Exhibit 8. Multiple upside targets still pointing to $90–$100 range
Data: Updata
Net-net, we retain our buy thesis on NARI and look forward to sharing results from our position looking ahead. We still see upside value to the $90–$100 range.
Appendix 1. NARI FY22–24’ estimates of income [qrtly, annual, internal forecasts].
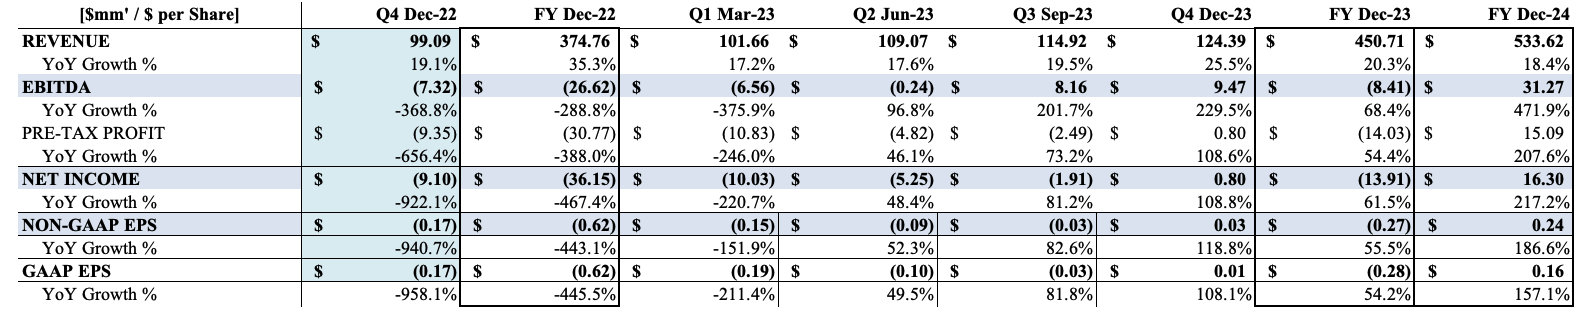
Data: HBI Estimates
Be the first to comment