

fotofrog/E+ via Getty Images
In an SA article in June 2017, I argued that the strategic 60/40 portfolio is a risky investment, especially when long-duration ETFs are used to take advantage of convexity.
Bond yields are rising after a long period of quantitative easing and asset purchases. The commodities rally and surge in inflation have caused significant losses to strategic 60/40 allocations year-to-date. Both commodity prices and higher inflation will not disappear quickly; it may take several years or even a decade for normalization. Therefore, it is highly unlikely that 60/40 allocations will provide sufficient returns to justify the risks. Alternatives are required, and these will probably involve market timing.
Alternatives have been known for many years and include other strategic allocations, tactical allocations, or allocations to other markets, such as commodities and forex, via exposure to CTA programs. However, there has not been a consensus on a preferable strategy and, more importantly, a large-scale adoption. If the days of the 60/40 are numbered, many investors will have to find alternatives. Many also believe that the rise in yields is “transitory” and the bond market rally will resume shortly. They may be right, but if they are wrong, this will have a profound impact, since it concerns a large number of investors.
Below, I first look at the performance of three 60/40 portfolios with different bond durations, and I compare them to an alternative strategic allocation and three popular market timing strategies.
All results are based on backtests and do not include commissions, or slippage. The last date of the backtests is June 17, 2022.
60/40 Portfolio Performance
Short Duration: 60% SPY (SPY) – 40% AGG (AGG)
Yearly Performance of 60/40 Portfolio in SPY and AGG (Price Action Lab Blog – Norgate Data)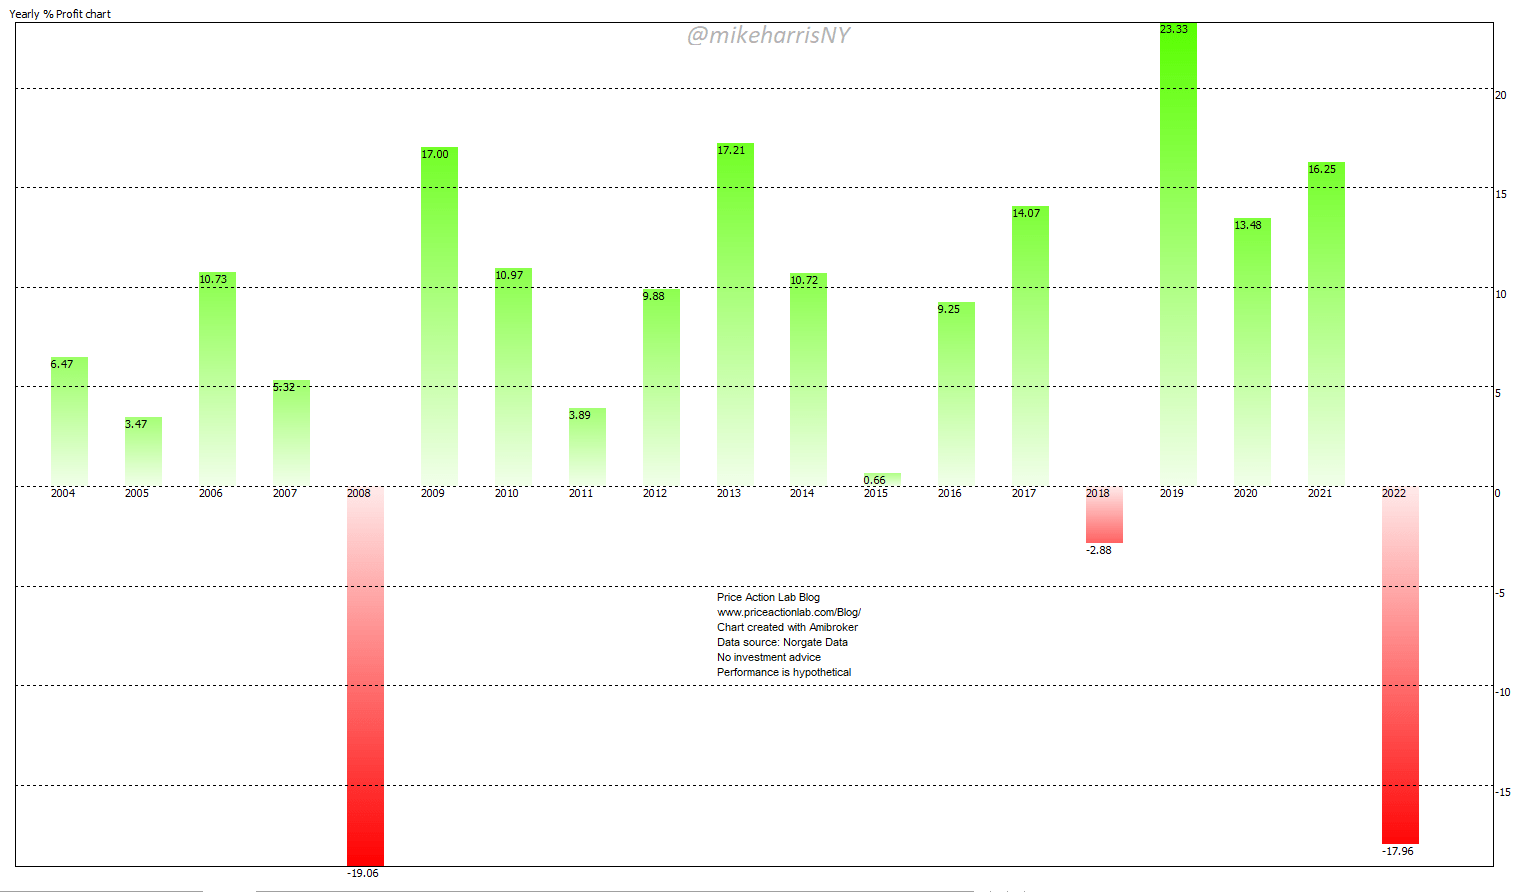
The unrealized year-to-date loss of 18% is close to the realized 19% loss in 2008. These two large losses indicate that the distribution of returns of this seemingly innocent portfolio is leptokurtic with fat left tails. For those of you who are not familiar with the terminology, it means losses may be larger in the future and have a higher probability than expected.
Medium Duration : 60% SPY – 40% IEF (IEF)
Yearly Performance of 60/40 Portfolio in SPY and IEF ( Price Action Lab Blog – Norgate Data)
The year-to-date loss of 18.3% is the largest compared to yearly losses. This is an unrealized loss but large enough to scare conservative investors. In 2008, this portfolio fell by about 15% and this means that current conditions for this allocation are worse than those during the GFC.
Long Duration : 60% SPY – 40% TLT (TLT)
Yearly Performance of 60/40 Portfolio in SPY and TLT (Price Action Lab Blog – Norgate Data)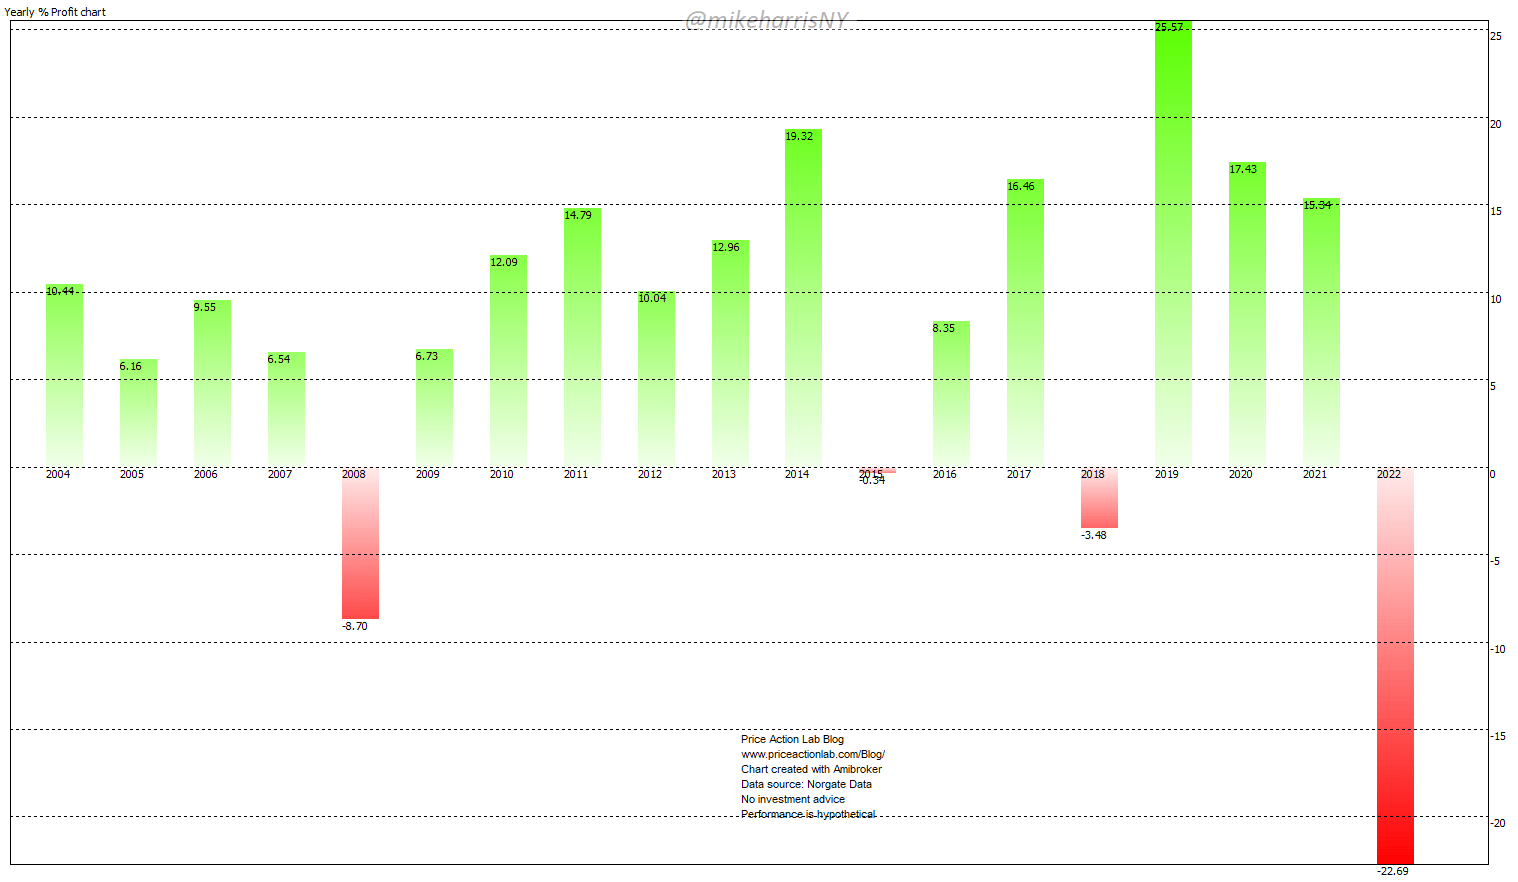
This strategic allocation has been popular due to the high convexity offered by long-duration bonds. High convexity offers larger returns when yields are falling but long duration is unprofitable during fast-rising yields. As a result, this strategic allocation is down 18.3% year-to-date with the largest yearly realized loss of about 8.7% in 2008. The left tail of the distribution is fatter in this case, meaning that even larger losses are possible in the future.
An Alternative: All Seasons Strategic Allocation
There have been several variations of this allocation. Here I use the following: 40% TLT, 30% VTI (VTI), 15% IEF, 7.5% IAU (IAU), and 7.5% DBC (DBC).
Yearly Performance of All Seasons Portfolio (Price Action Lab Blog – Norgate Data)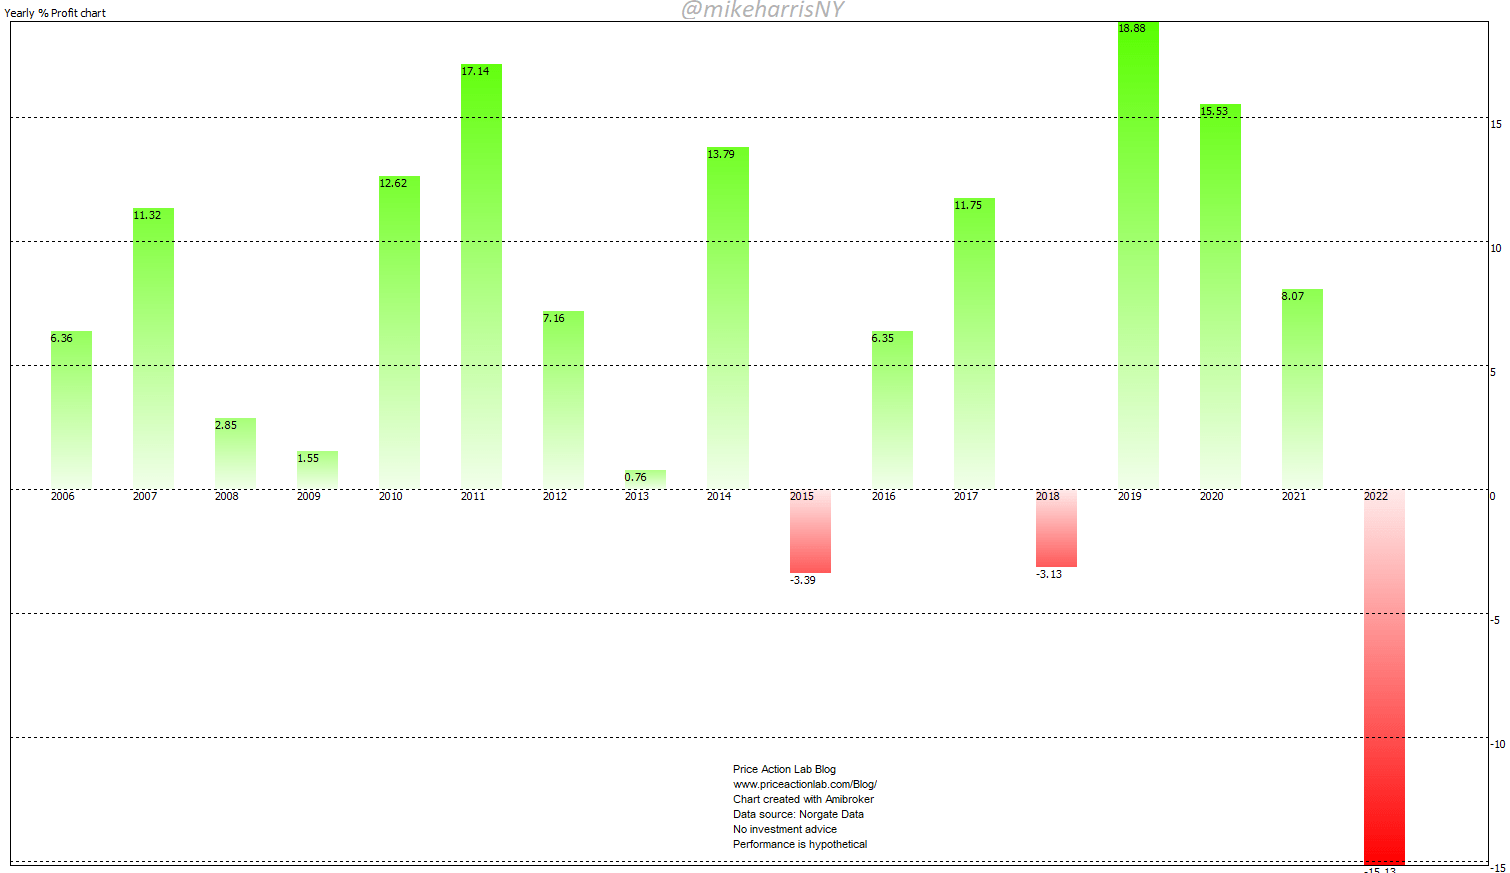
This is a classic case of a strategy that starts failing due to changing market conditions. Long-duration bonds are overweighed, and commodities are underweighted during the wrong time. The left fat tail kicked in with a year-to-date loss of 15% versus a maximum loss of 3.4% in 2015. Is this the end of the allocation? It is hard to say but the large year-to-date loss is surprising.
Classic 12-Month Price Series Momentum in SPY ETF
This is a timing strategy. It goes long when the price is above the 12-month moving average and closes the position when the price falls below the average.
Yearly Performance of 12-Month Momentum in SPY ETF (Price Action Lab Blog – Norgate Data)
Also, in this case, we see a large unrealized loss year-to-date of 13%. We do not know whether the yearly loss will be higher or lower. For now, this timing strategy has not behaved well. The risk with this strategy is a prolonged sideways market. If this happens, it can lose up to 30% in a few years, or even more, depending on the type of market chop. In my opinion, without some hedging, this is a high-risk strategy.
12-Month Price Series Momentum in SPY and IEF ETFs
Instead of using only SPY, we also use IEF and allocate 50% of available equity when there is a signal to each asset.
Yearly Performance of 12-Month Momentum in SPY and IEF ETFs (Price Action Lab Blog – Norgate Data)
The performance is better than when using only SPY, although the unrealized year-to-date loss of 7.3% is larger than previous yearly realized losses. This strategy sacrifices returns for lower drawdown, and as we will discuss below, it offers conditions for leveraged alpha.
12-Month Price Series Momentum in SPY, TLT, and GLD ETFs
Instead of using only SPY, we also use TLT and GLD (GLD) and allocate one-third of available equity when there is a signal to each asset.
Yearly Performance of 12-Month Momentum in SPY, TLT, and GLD ETFs (Price Action Lab Blog – Norgate Data)
As compared to the previous two timing allocations, the realized 2015 loss is larger, but year-to-date the unrealized loss is lower at 5.9%. This allocation also offers potential for leveraged alpha.
Putting it all together
Below is a performance table for the four strategic and three timing allocations discussed above. CAGR is the annualized return and Max. DD is the maximum drawdown.
| YTD | CAGR | MAX. DD | |
| 60/40 SPY/AGG | -18% | 6.7% | -33.8% |
| 60/40 SPY/IEF | -18.3% | 7% | -30% |
| 60/40 SPY/TLT | -22.7% | 7.9% | -28% |
| All Seasons | -15.1% | 6.5% | -16.5% |
| SPY Momentum | -13% | 7.6% | -22.6% |
| SPY, IEF Momentum | -7.3% | 5.6% | -10.9% |
| SPY, TLT, GLD Momentum | -5.9% | 6% | -11.7% |
Conclusion
The conclusion of this brief article is deduced from the above table:
- A period of high uncertainty and even large losses may be ahead for some popular strategic allocations.
- It is highly likely the future alternatives to 60/40 are timing strategies.
- Alpha may be available through leverage and higher risks.
Be the first to comment