

gguy44
In 2013, we developed our Business Cycle Index from the following basic economic data:
- 10-year treasury yield (daily)
- 3-month treasury bill yield (daily)
- S&P500 (daily)
- Continues Claims Seasonally Adjusted (weekly)
- All Employees: Total Private Industries (monthly)
- New houses for sale (monthly)
- New houses sold (monthly)
The complete data-set is available on FRED from 1967 onwards. When combining the components for the index the “real time” aspect was considered, i.e. the data was only incorporated into the index at its publication date and not at the date shown in the series
The BCI on its own does not provide recession signals, but after further manipulation of the series two indicators are extracted that reliably signal looming recessions:
- The six-month smoothed annualized growth rate of an economic series is a well-established method to extract an indicator from the series. We use this method to obtain BCIg (growth). Here BCIg is the calculated growth rate with 6.0 added to it, which generates, on past performance, an average 11-week leading recession signal when BCIg falls below zero.
- We also found that the BCI retreats in a well-defined manner from its cyclical peak prior to recessions. This allowed the extraction of the alternative indicator BCIp (peak), and its variant BCIw (weeks). Past performance shows that on average 20 weeks prior to a recession, the BCIp value crossed 25 to the downside.
Figure 1 plots BCIp, BCI, BCIg and the S&P 500 together with the thresholds (red lines) that need to be crossed to be able to call a recession. Here we note that BCIp now at 18.5 has crossed the 25 threshold firmly to the downside. Historic data of the past recession shows that at this value, the economy never recovered to avoid a recession.
iMarketSignals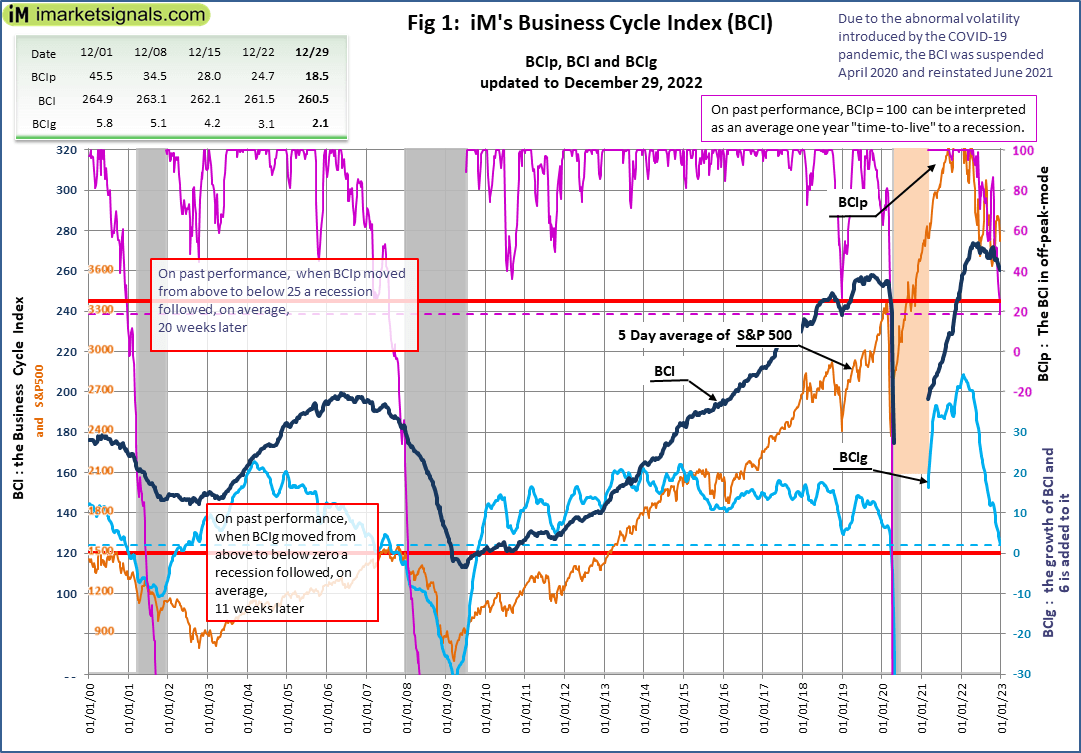
In our 2014 article iM’s BCIw: A Weeks to Recession Indicator, we show how the BCIp (deviation from previous peak of BCI) indicator can be transformed to a BCIw (weeks to next recession) derived from the previous BCIp tracks to the NBER defined recession. The below Figure 2 plots the BCIw tracks to the past recession together with the current value of BCIw with its endpoint on the best fit average value of the past recessions. From this graph we identify that the BCI predicts the next recession to be at the earliest 12 weeks away but not later than 25 weeks.
iMarketSignals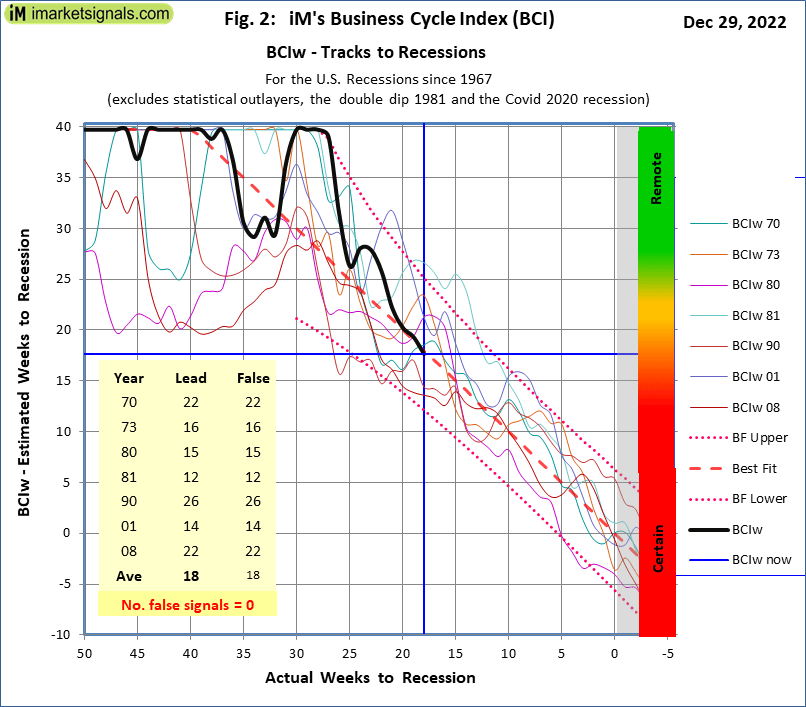
The two indicators BCIg and BCIp could be used as a sell signal for ETFs that track the stock markets, like SPY, IWV, VTI, etc. or stocks in general.
In Table 1, we record for each recession the pre-recession peak of the S&P500, the value on the day of the BCIg signal, and the subsequent lowest value of the inter-recession trough. From these, we calculate the loss avoided by exiting the market on the day of the BCIg signal.
|
Table 1: Loss avoidance in SPY when exiting on BCIg recession warning. |
||||||||
|
Note |
1 |
2 |
3 |
4 |
5 |
6 |
7 |
8 |
|
Recession |
Peak |
Signal |
Trough |
(P-T)/P |
(S-T)/S |
(P-T) |
(S-T) |
(S-T)/(P-T) |
|
Jan-70 |
106.16 |
93.24 |
69.29 |
36.1% |
25.7% |
36.87 |
23.95 |
65.0% |
|
Dec-73 |
120.24 |
103.36 |
62.28 |
48.2% |
39.7% |
57.96 |
41.08 |
70.9% |
|
Feb-80 |
115.2 |
100.3 |
98.22 |
17.1% |
2.1% |
16.98 |
2.08 |
12.2% |
|
Aug-81 |
140.52 |
128.64 |
102.42 |
27.1% |
20.5% |
38.1 |
26.22 |
68.8% |
|
Aug-90 |
368.95 |
332.92 |
295.46 |
19.9% |
11.3% |
73.49 |
37.46 |
51.0% |
|
Apr-01 |
1520.77 |
1326.82 |
965.8 |
36.8% |
27.2% |
554.97 |
361.02 |
65.1% |
|
Jan-08 |
1565.15 |
1508.44 |
676.53 |
56.8% |
55.2% |
888.62 |
831.91 |
93.6% |
|
Average all recessions |
34.6% |
25.9% |
60.9% |
|||||
|
Column Notes:
|
||||||||
Following the BCIg signals from our recession indicator, one would have avoided on average about 61% of the total market decline from pre-recession peaks to inter-recession troughs, as indicated in the last column of Table 2. One can see in column 5 that exiting the market at the signal dates would have avoided losses averaging about 26%. Had one known the market peak, one could have avoided the 35% average decline as shown in column 4. Prior to the 2008 recession, the exit signal from BCIg occurred almost when the market peaked.
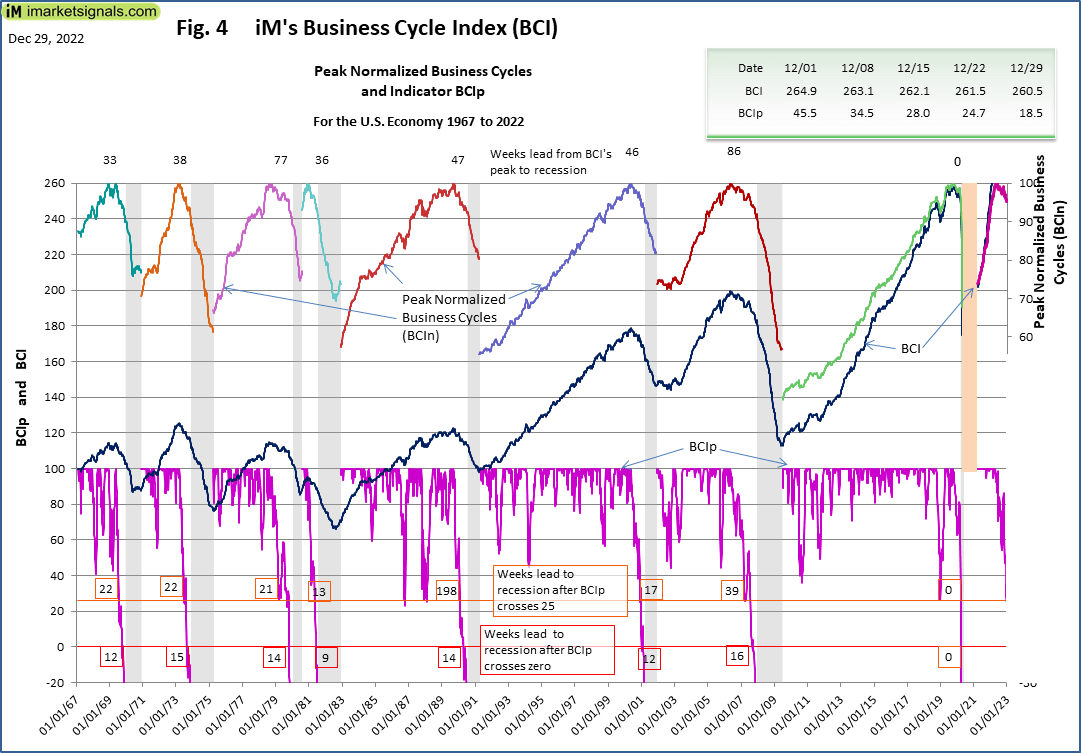
Figure 3 plots the history of BCI, BCIg and the LOG (S&P 500) since July 1967, and Figure 4 plots the history of BCIp, i.e., 56 years of history, which includes eight recessions, each of which the BCIg and BCIp managed to indicate timely; the weeks leading to a recession are indicated on the plots.
iMarketSignals iMarketSignals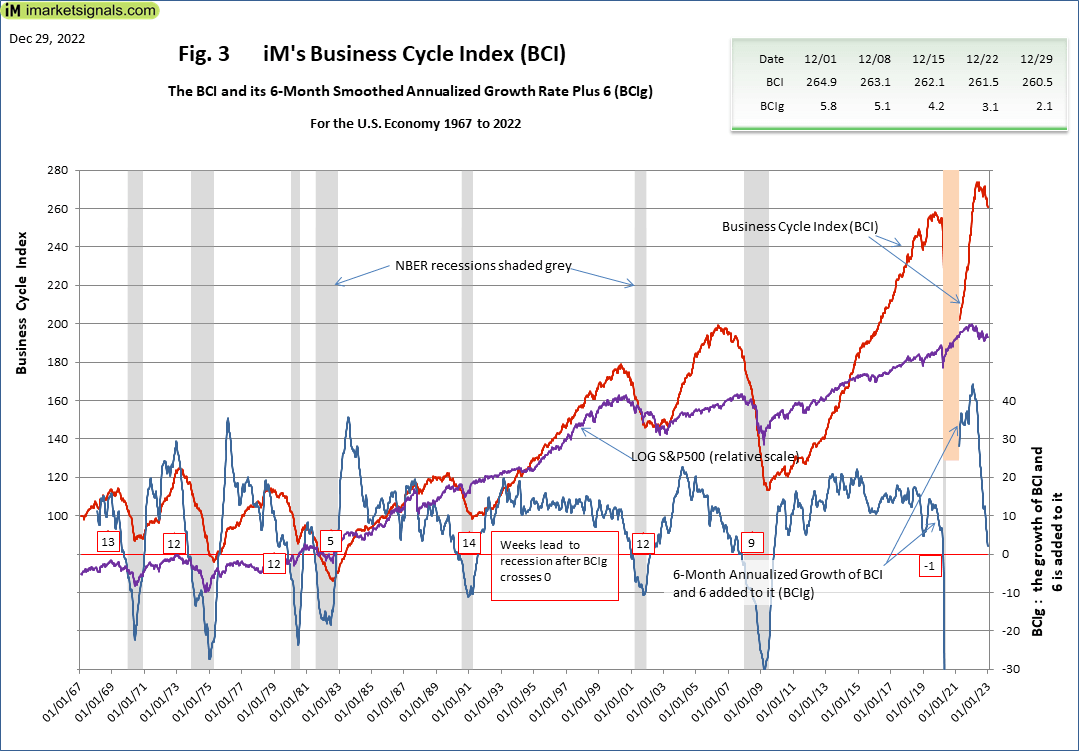
Be the first to comment