Pgiam/iStock via Getty Images
Economic analysis is only half of the investment equation; the other half is investor sentiment. This is because group emotions of fear and greed can often drive stock prices 50% to 100% above or below their economic value. So, the study of investor sentiment is vital and is why we focus exclusively on what investors are thinking and doing about the economic picture through surveys and investment activity. We leave the economic picture to others.
This article is part of a continuing series of articles (here) on how to use sentiment and investor activity in exchange-traded funds (“ETFs”) to help determine the direction of the stock market. Since ProShares has over 130 ETFs with more than $50 billion in assets – many with 2X and 3X leverage – it is the perfect fund family to use for this purpose.
The Short-Term Master Sentiment Indicator
We recently created a short-term Master Sentiment Indicator. The ST-MSI is like the original Master Sentiment Indicator (most recent article on MSI) in that it’s a composite made from other sentiment indicators.
However, the indicators making up ST-MSI are different than the original. The indicators in the ST-MSI change daily while those in the original MSI change weekly. The original MSI was designed to signal bull and bear markets. The ST-MSI was designed to indicate intermediate and shorter-term movements.
The ST-MSI is made from seven indicators of investor sentiment:
- Two Hulbert daily investment advisor sentiment surveys
- The VIX and VXN
- Five day moving average of equity and total CBOE puts to calls ratios
- The ratio of buying in all ProShares bull and bear funds
The Short-Term Master Sentiment Indicator (Michael McDonald) ST-MSI Composite table of sentiment indicators (Michael McDonald)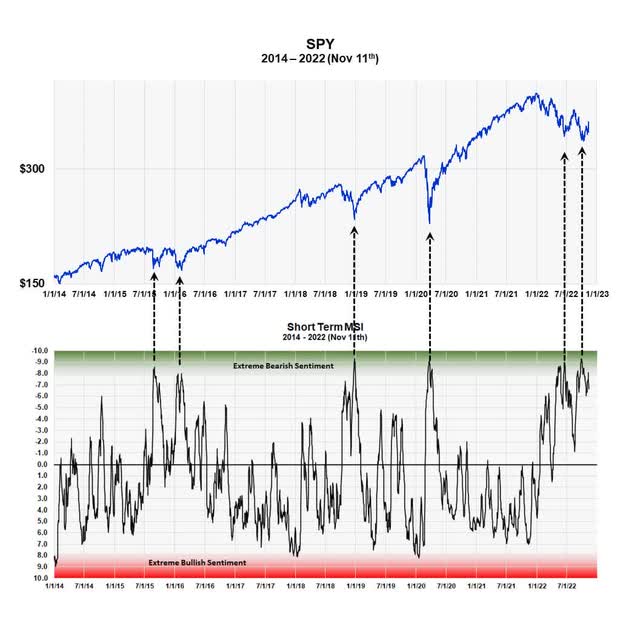
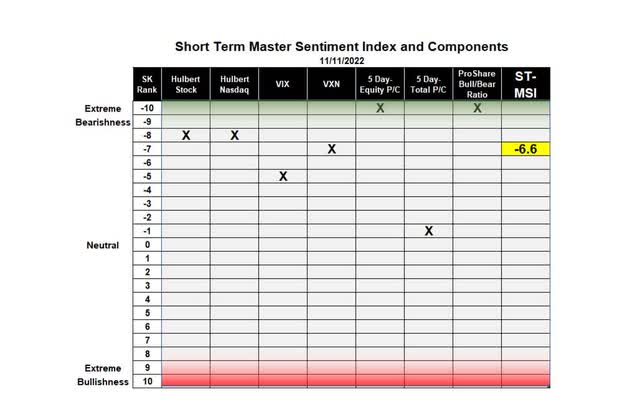
The graph plots the ST-MSI against the S&P Spider index from 2014 to present. The corresponding table displays our current reading for each of the seven indicators that make up the ST-MSI. The yellow number in the last column of the table is the current value of ST-MSI.
It is clear from the chart that we recently had two moments of extreme bearish sentiment – June 16th and September 27th. These readings were of similar degree to four other moments in the last eight years, all indicated by dotted, arrowed lines. History shows these occurred at major market lows.
Our Sentiment Scale or Ranking
The ranking scale from minus 10 to plus 10 allows us to combine different indicators onto the same Sentiment scale in a mathematically consistent way. The green zone in both the chart and table represents extreme levels of bearish sentiment while the red zone represents extreme bullish sentiment. There is no sudden demarcation line but a graduated area that shows greater or lesser degrees.
A complete explanation of the scale and the red and green zones is found in our earlier article: Master Sentiment Indicator.
The VIX and VXN
Two indicators that go into the ST-MSI are the VIX and VXN, which are the short-term implied volatility metrics of the S&P 500 and the NASDAQ 100. They’re implied volatility and not real volatility since they’re calculated using option values are not the actual short-term volatility of the indices.
They are useful, however, since option speculators often pay extremely high prices for put options at the very bottom of the market. These high put prices push up the implied volatility, which often reach their highest values right at the bottom of the market. They become another contrary opinion indicator, therefore. I wrote about this in 2011 (VIX Explanation).
The VIX and VIX Ranking (Michael McDonald) The VXN and its Ranking (Michael McDonald)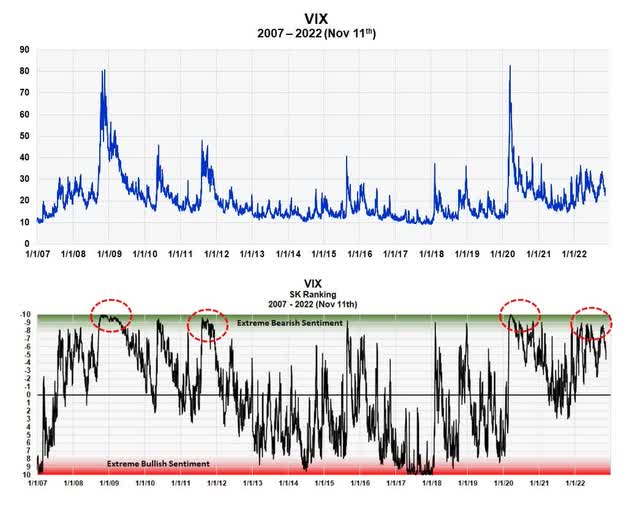
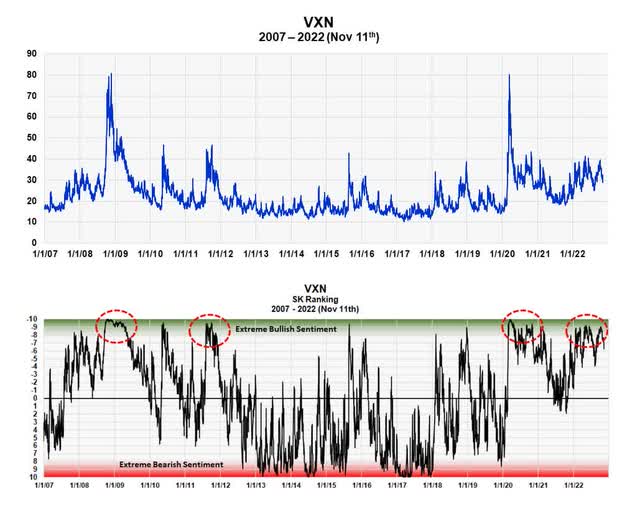
These graphs plot the VIX and VXN from 2007 to present. Notice how similar the two graphs are. This is because the indices contain many of the same stocks.
Each extreme peak in the VIX or VXN occurred at a major stock market low. When using these indexes, we found it better to put the VIX and VXN on our percentage ranking scale, since it allows us to combine them with other sentiment indicators to form a composite. This is the red-green charts below the actual indices.
Although we haven’t had an extreme, singular peak in the indices during this bear market, we have highlighted with four red circles something we think is important. These circles highlight moments when the volatility indexes stayed at extremely, pessimistic readings for extended periods of time. As you can see, the three previous times in the last fifteen years was at major stock market lows.
VIXY
The ProShares VIX Short-Term Futures ETF (BATS:VIXY) provides long exposure to the S&P 500 VIX Short-Term Futures Index, which measures the returns of a portfolio of monthly VIX futures contracts with a weighted average of one month to expiration. Speculators use it to try to profit from those spikes in the VIX and VXN. They also use it as a hedge against a market decline, since the VIXY often rises more than stocks decline when the stock market is correcting. In this capacity it has not performed well during this bear market.
If we are right about the direction of the current stock market, VIXY is not a good investment or hedge at this time and should be sold. Buying activity in the VIXY ETF seems to also confirm this.
Shows buying levels in VIXY compared to the SPY (Michael McDonald)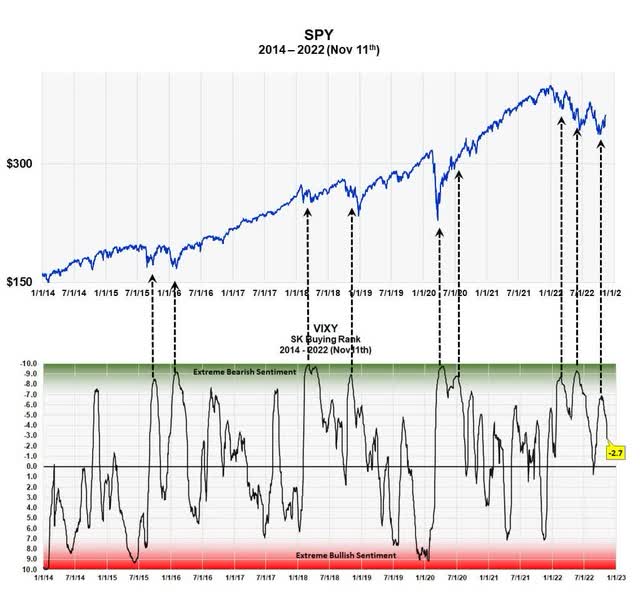
This last chart shows the levels of buying in VIXY as a percent of assets. It’s graphed on the same ranking scale as all the other indicators. It’s compared against the S&P 500 spider ETF.
High purchase levels in VIXY seem to also occur at market lows in SPY. This is indicated by the nine black dotted lines. There have been three peaks in buying during this bear market, each at a short-term market bottom.
Summary
Both the VIX and VXN, plus our new, short-term sentiment indicator, point to higher stock prices.
Because of this the ProShares VIXY ETF should be sold or avoided.


Be the first to comment