

Darren415
In this article, we take a look at the emerging monetary policy rate environment and its implications for income portfolios. Specifically, the Fed is committed to further rises in the policy rate, which will likely remain elevated for a while as inflation moves back towards its 2% target. The Fed is also willing to push the economy into recession in order to achieve its objective. This should lead to both rising and elevated short-term rates as well as higher credit spreads. To take advantage of this environment, we are tilting to funds with decent-quality, modest-duration assets which also feature fixed-rate liabilities.
Higher For Longer Is The New Normal
Although a lot of investor focus is caught up with the latest change in the Fed policy rate, it can be useful to zoom out a little bit and take in the bigger picture of the US monetary policy.
First, the expectation of the terminal Fed policy rate has continued to increase. The market thought it saw a Fed pivot in June when the expectation of the terminal rate fell from around 4% to below 3.5%. However, Powell soon disabused it by taking an increasingly hawkish posture on the back of persistent inflation. This has pushed the market to price in a 4.5% terminal rate as of this writing.
Bloomberg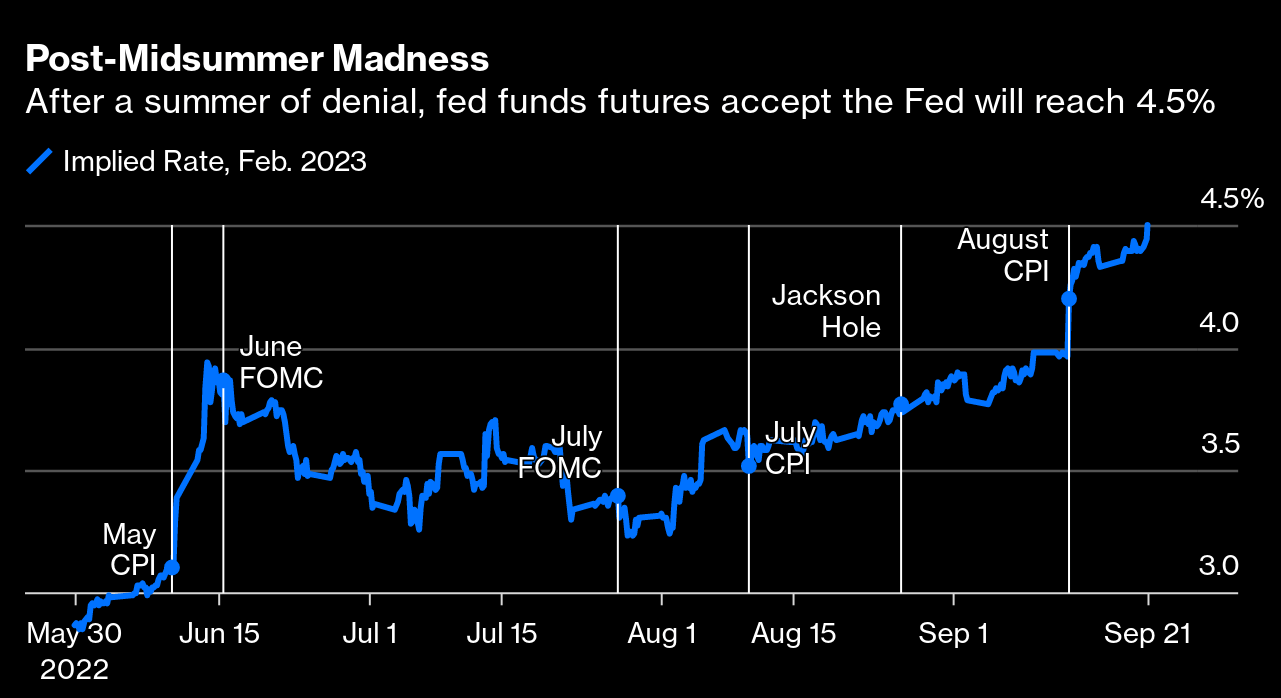
In one sense, we can’t blame the market for this. The Fed’s own projection in June was for the policy rate to peak around 3.75%. However, relatively persistent inflation caused the Fed to hike its estimate to 4.6% with some Fed governors expecting a figure just below 5%.
Bloomberg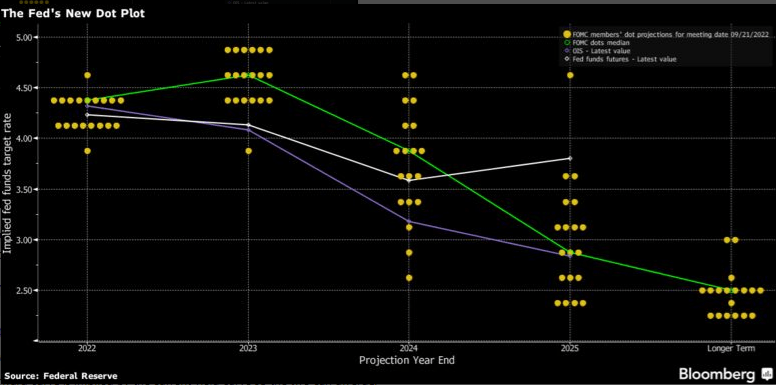
Second, we can expect the terminal policy rate to remain elevated for a considerable amount of time. This is in part because it has taken 8 months on average for the rate to be cut from its peak. And while leading indicators have moved lower, the current macro picture is still fairly strong.
Ned Davis Research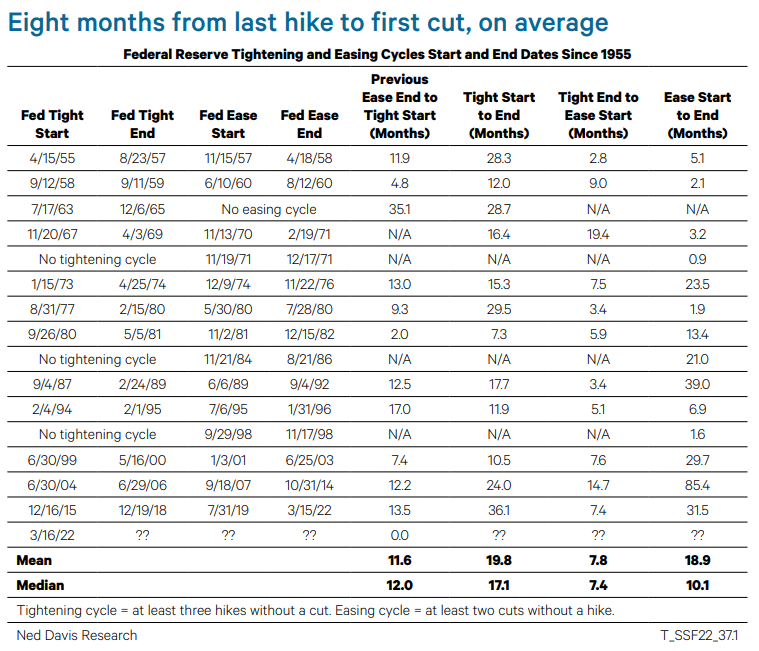
The Fed’s favorite yield curve recession indicator which is the spread between the 3-month Treasury bill and the expected 3-month rate in 18 months is not inverted yet and indicates it may take some time for a recession to bail the Fed out by cooling inflation and allow it to move rates lower.
Bloomberg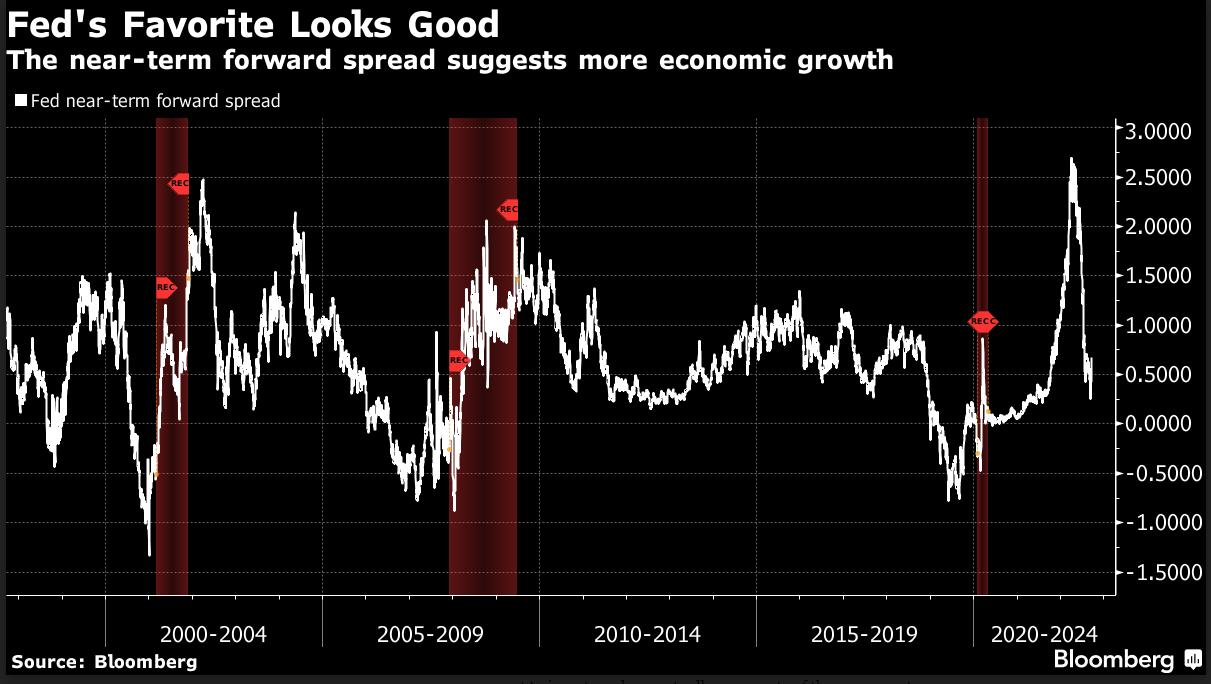
Three, while the current macro picture is not very dire, the Fed is willing to push the economy much lower in order to rein in inflation. At the press conference following the latest hike, Powell said, “We have got to get inflation behind us. I wish there were a painless way to do that. There isn’t.” It’s clear that the Fed is focusing much more on the inflation side of its mandate at present. This suggests that a moderate recession is very likely, and if that’s true, we should expect credit spreads to rise from current sub-5% levels closer to 6-7%.
Finally, there is enormous uncertainty about where the policy rate will settle in the longer term. Looking at the dot plot above, the Fed’s own estimates for 2025 range from 2.4% to 4.6%. Where the policy rate will be in a few years has a direct implication for longer-term rates. The consequence here is that we can have little confidence where longer-term rates move significantly higher or lower from here over the next couple of years.
Some Ideas
A “higher for longer” Fed policy rate environment has a number of implications for income investors. One key implication is that the typical fixed-income leveraged CEF will be able to generate an increasingly smaller amount of income from the leveraged portion of its portfolio.
For example, a fund with an 8%-yielding portfolio (not far from where HY corporate bonds trade) and a floating-rate credit facility will only be able to pass on 1.5% of its overall yield on its leveraged assets at the peak policy rate. This is because at a 4.5% Fed Funds rate the cost of its credit facility will be around 5.5% (equivalent to LIBOR + 1% which is roughly what credit funds pay on their repo/credit facilities) and a typical credit CEF has around 1% of total fees on all assets.
In other words, a typical high-yield corporate bond leveraged CEF will only pass on less than a fifth of the total yield it earns on its leveraged assets. For perspective, leveraged assets make up around a third of a typical credit CEF total assets.
Many investors are not blind to this dynamic. A typical response has been to instead tilt to floating-rate funds, particularly, loan funds. This can make sense, however, it has two downsides. First, this tends to push investors into bank loan funds – a sector which will continue to come under significant pressure from escalating interest expense. The sector has also worsened in quality over the past few years due to an increase in cov-lite documentation, EBITDA add-backs, sidecars and other gimmicks.
And second, it doesn’t address the higher cost of leverage. Specifically, even though a loan CEF does benefit from rising short-term rates on the asset side, the higher cost of leverage still eats away at the income it passes on to investors.
This is why in the current environment we like leveraged funds that have, at least in part, fixed-rate liabilities or those that have hedged their liabilities. It also means that, within this subset, investors don’t have to avoid funds with predominantly fixed-rate assets as their income levels will hold up much better in a period of rising rates. We also put some more focus on decent-quality assets, given the likely recession that the credit market has not yet fully priced.
Within the CEF space, we continue to like the mostly investment-grade bond CEF Angel Oak Financial Strategies Income Term Trust (FINS) which trades at a 13.7% discount and an 8.6% current yield. FINS has about half of its liabilities in relatively low-coupon fixed-term notes and about 2/3 of its assets in floating-rate bonds.
We also like the Cohen & Steers Tax-Advantaged Preferred Securities & Income Fund (PTA) trading at an 11% discount and an 8.6% current yield. The fund’s assets are mostly fixed-rate preferreds, however, the fund has fixed the rate on 85% of its liabilities. About 2/3 of the fund’s holdings are in securities rated BB and above.
We are also focused on the BDC space, particularly, among the higher-quality underwriting companies. Most BDCs have a roughly half-fixed/half-floating liabilities profile and 90-100% floating-rate assets – an attractive profile in this environment.
In the sector we continue to like the Golub Capital BDC (GBDC), trading at an 81% valuation and 9.8% yield as well as the Oaktree Specialty Lending Corp. (OCSL), trading at an 86% valuation and an 11.4% yield.
Finally, for investors less comfortable with leverage, it makes sense to consider unleveraged funds like ETFs. Here, we like the short-maturity SPDR Bloomberg Short Term High Yield Bond ETF (SJNK) which has an 11.1% portfolio yield-to-worst, though its trailing-twelve-month distribution yield is far more modest at 5.3%. SJNK features a low 2.4 duration and takes advantage of the inverted yield curve by holding bonds that mature in the range where yields top out. Due to its relatively low duration, it should also outperform more standard corporate bond funds if longer-term rates or credit spreads move higher.
Be the first to comment