

SimonSkafar/E+ via Getty Images
Illinois Tool Works (NYSE:ITW) is a diversified industrial company with business segments that span many sectors of the economy. Their reporting segments are food equipment, testing and measurement, welding, polymers and fluids, construction products, automotive, and specialty products. ITW’s segments are fairly even in terms of revenue generation with the smallest segments coming in around 12% and the largest at 19%.
ITW FY 2021 Revenue Segments Breakdown (ITW FY 2021 Annual Report)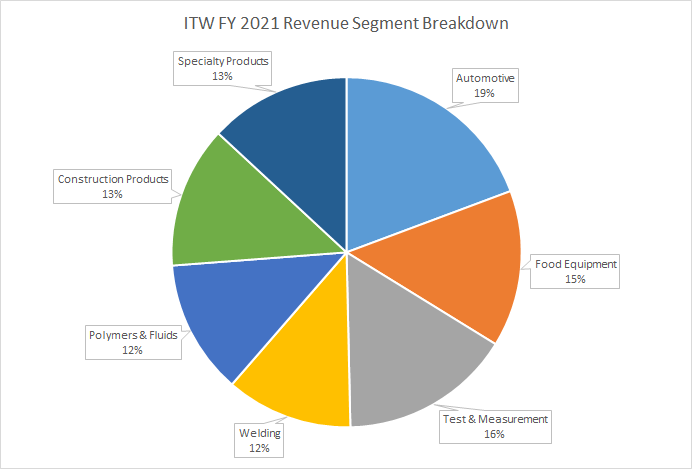
During their Q1 FY 2022 earnings release ITW showed strong results compared to FY 2021. Each reporting segment except for automotive showed organic growth of at least 11%; although margins were under pressure.
For FY 2022 management expects pretty strong results with organic growth of 7-10% and impressive free cash flow growth of 10-20%. ITW’s long-term targets are for organic revenue growth between 3-5% with annual EPS growth of 7-10%.
ITW’s business is customer oriented by focusing on the needs and problems of their clients first rather than an internally developed R&D process. That relationship with their clients builds a close tie between ITW and their customers which keeps bringing those clients back to ITW when they have an issue. ITW also has a wide ranging patent portfolio that saw 1,800 applications in 2021 and over 19,000 patents in total.
ITW’s share price has declined 28% since reaching nearly $250 per share in January. When I last looked at ITW I came to the conclusion that the valuation was quite steep; however, the pullback appears to have opened up an opportunity for investors.
Dividend History
The dividend growth investment strategy is the one that appealed most to me when I began investing on my own. The strategy is pretty straight-forward: find businesses with a history of paying and growing their dividend payment, don’t pay too much, and let the business take care of itself.
Illinois Tool Works Dividend History (ITW Investor Relations)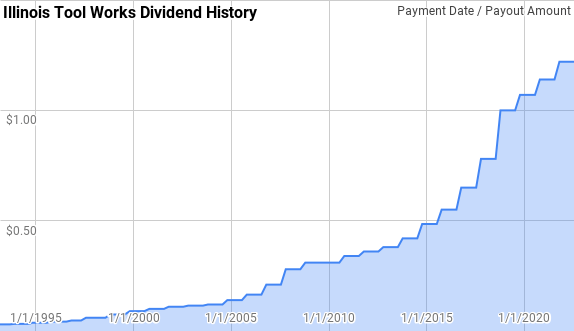
According to the CCC list, ITW has increased their dividend payment for 59 consecutive years giving them the title of Dividend Champion. That’s a streak that dates back to the early 1960s which is truly incredible. Every year, despite whatever was going on in the economy ITW has been there rewarding owners with higher dividends.
Dating back to 1993, ITW has given annual raises that range from 2.4% to 29.1% with an average of 14.1% and a median of 13.8%.
During that same period there’s been 24 rolling 5-year periods with annualized dividend growth ranging from 6.3% to 19.9% with an average of 14.2% and a median of 15.2%.
Over that timeframe there’s also been 19 rolling 10-year periods with ITW’s annualized dividend growth rate between 11.3% and 16.3% with an average of 13.5% and a median of 13.1%.
The rolling 1-, 3-, 5-, and 10-year period annualized dividend growth rates from ITW since 1993 can be found in the following table.
| Year | Annual Dividend | 1 Year | 3 year | 5 Year | 10 Year |
| 1993 | $0.1225 | ||||
| 1994 | $0.1350 | 10.20% | |||
| 1995 | $0.1550 | 14.81% | |||
| 1996 | $0.1750 | 12.90% | 12.62% | ||
| 1997 | $0.2150 | 22.86% | 16.78% | ||
| 1998 | $0.2550 | 18.60% | 18.05% | 15.79% | |
| 1999 | $0.3150 | 23.53% | 21.64% | 18.47% | |
| 2000 | $0.3700 | 17.46% | 19.84% | 19.01% | |
| 2001 | $0.4100 | 10.81% | 17.15% | 18.56% | |
| 2002 | $0.4450 | 8.54% | 12.21% | 15.66% | |
| 2003 | $0.4650 | 4.49% | 7.92% | 12.77% | 14.27% |
| 2004 | $0.5000 | 7.53% | 6.84% | 9.68% | 13.99% |
| 2005 | $0.5850 | 17.00% | 9.55% | 9.60% | 14.20% |
| 2006 | $0.7050 | 20.51% | 14.88% | 11.45% | 14.95% |
| 2007 | $0.9100 | 29.08% | 22.09% | 15.38% | 15.52% |
| 2008 | $1.1500 | 26.37% | 25.27% | 19.85% | 16.26% |
| 2009 | $1.2400 | 7.83% | 20.71% | 19.92% | 14.69% |
| 2010 | $1.2700 | 2.42% | 11.75% | 16.77% | 13.13% |
| 2011 | $1.3800 | 8.66% | 6.27% | 14.38% | 12.90% |
| 2012 | $1.4600 | 5.80% | 5.60% | 9.92% | 12.62% |
| 2013 | $1.5600 | 6.85% | 7.10% | 6.29% | 12.87% |
| 2014 | $1.7450 | 11.86% | 8.14% | 7.07% | 13.31% |
| 2015 | $2.0050 | 14.90% | 11.15% | 9.56% | 13.11% |
| 2016 | $2.3000 | 14.71% | 13.82% | 10.76% | 12.55% |
| 2017 | $2.7300 | 18.70% | 16.09% | 13.33% | 11.61% |
| 2018 | $3.3400 | 22.34% | 18.54% | 16.45% | 11.25% |
| 2019 | $4.0700 | 21.86% | 20.95% | 18.46% | 12.62% |
| 2020 | $4.3500 | 6.88% | 16.80% | 16.75% | 13.10% |
| 2021 | $4.6400 | 6.67% | 11.58% | 15.07% | 12.89% |
Source: Author; Data Source: Illinois Tool Works Investor Relations
The dividend payout ratio is a quick way to gauge the safety of the dividend by examining how much of the profits or free cash flow are being paid out to shareholders. It also lets you know if the dividend payout ratio could potentially rise turbocharging the future dividend growth. All else being equal a lower payout ratio is better than a higher one.
ITW Dividend Payout Ratios (ITW SEC filings)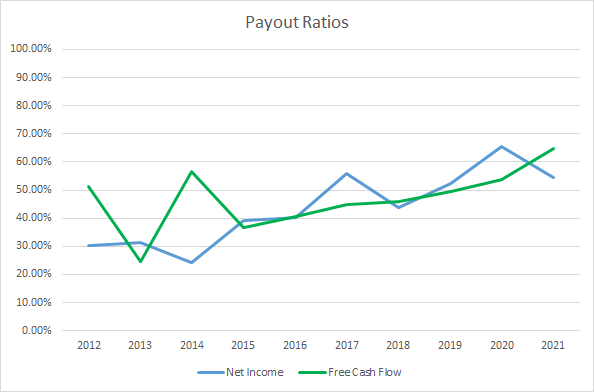
ITW’s payout ratios have been on the rise over the last decade as dividends have grown faster than the underlying business’ profits and free cash flow. The 10-year average net income payout ratio for ITW is 44% with the 5-year average at 54%. Likewise, the average free cash flow payout ratios are 47% and 52%, respectively.
Quantitative Quality
A lengthy dividend growth history is one data point I use to try to identify a quality business. There are several other financial metrics that I monitor to try and decide whether the business makes sense from a qualitative standpoint to be added to my portfolio.
ITW Revenue Profits and Cash Flow (ITW SEC filings)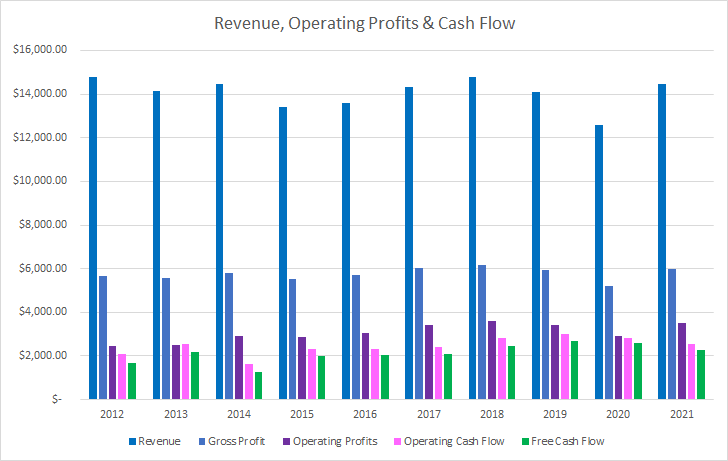
The biggest thing that stands out is that there’s been very little growth for ITW during the last decade despite a slow, but steadily growing economy. Over the last decade ITW has seen a -2.3% decline in total revenues or roughly a 0.3% annualized reduction. Gross profits have fared better rising 5.5% in total or 0.6% annualized.
Operating profits handily outperformed increasing 41.3% in total or 3.9% annualized; although the total improvement still leaves a lot to be desired. Similarly, operating cash flow increased just 23.4% or 2.4% annualized. However, free cash flow did rise 33.8% or 3.3% annually over the last decade.
In order for me to feel comfortable investing in a business I want a solid track record of at least stable, and preferably increasing, margins over time. For most businesses I want to see free cash flow margins greater than 10%.
ITW Margins and CCR (ITW SEC filings)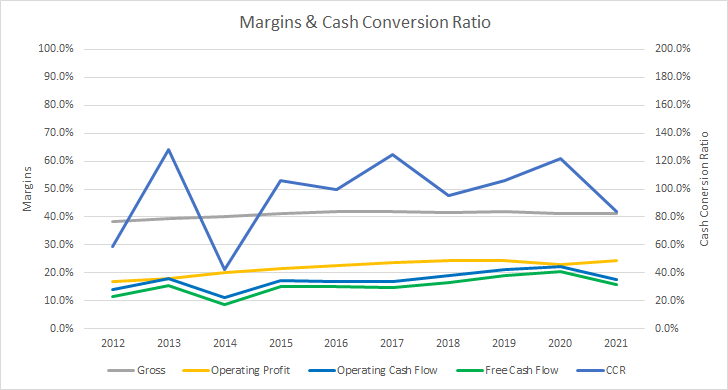
ITW’s gross margins have trended slightly higher as would be expected with gross profits outgrowing revenues over the last decade. The 10-year average gross margin for ITW is 40.9% with the 5-year average at 41.7%.
Similarly, ITW’s free cash flow margins have been on the rise as well with just one year coming in sub-10%. Over the last decade ITW has averaged a 15.2% free cash flow margin with an average of 17.3% over the most recent 5-years.
In addition to the margins, I track how efficient the business is at turning their asset or capital base in to free cash flow. The free cash flow return on invested capital, FCF ROIC, represents how much cash flow the business generates compared to their invested capital. Similar to the margins I expect to see stable or improving FCF ROICs over time.
ITW Free Cash Flow Returns (ITW SEC filings)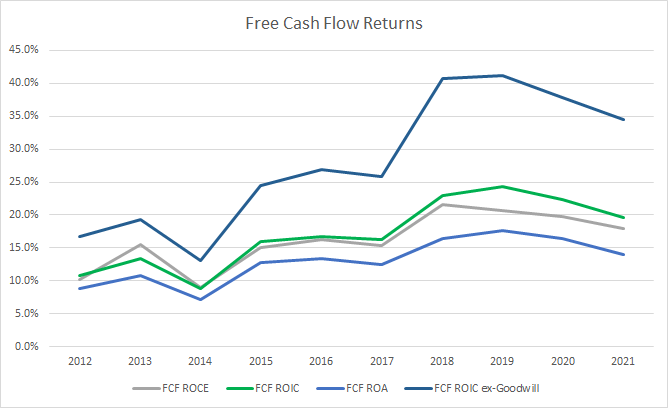
ITW has maintained a FCF ROIC greater than 10% in all but one year of the last decade. The 10-year average FCF ROIC for ITW is 17.1% with a 5-year average of 21.1%.
To understand how ITW uses its free cash flow I calculate three variations of the metric, defined below:
- Free Cash Flow, FCF: Operating cash flow less capital expenditures
- Free Cash Flow after Dividend, FCFaD: FCF less total cash dividend payments
- Free Cash Flow after Dividend and Buybacks, FCFaDB: FCFaD less net cash used on repurchasing shares
ITW Free Cash Flows (ITW SEC filings)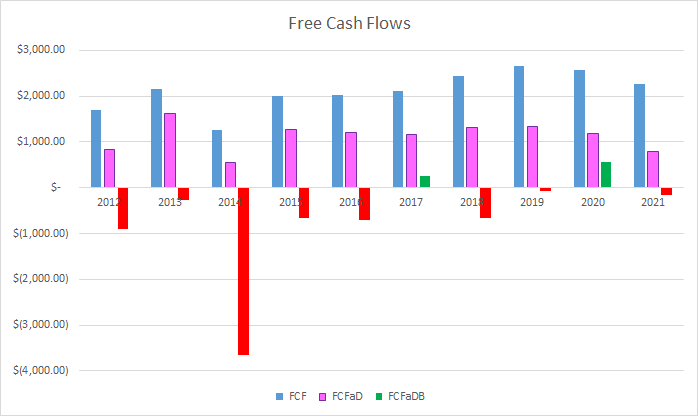
During the last ten years ITW has generated a total of $21.2 B in FCF and paid out $9.9 B to shareholders via dividend payments. The cumulative FCFaD comes to $11.3 B. ITW has been very aggressive with share repurchases spending $17.6 B in total over the last decade in net buybacks. That puts the cumulative FCFaDB at -$6.3 B for the last decade.
Share repurchases can be a great way for businesses to return excess cash to shareholders. Reducing the shares outstanding increases the ownership stake of remaining share owners.
ITW Shares Outstanding (ITW SEC filings)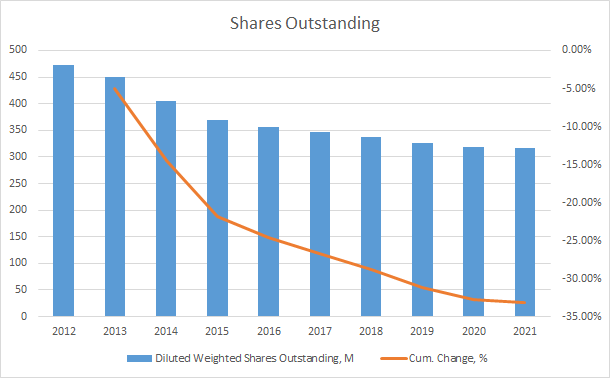
As we saw in the FCF chart above, ITW has spent heavily to reduce their share count. During the last decade ITW’s shares outstanding declined from 473.2 M in FY 2012 to 316.4 M in FY 2021. That works out to a total reduction of 33.1% or 4.4% annually.
When I invest in a business my intention is to own my stake for years and potentially decades. As such the balance sheet and leverage that a business takes on is important to track especially so given the rise in interest rates thus far in 2022. Time will tell if that trajectory will carry on or if we will stabilize around current levels; however, rising interest rates place a burden on the future earnings and cash flow of a business if they don’t have the capacity to pay off their debt when the bill comes due.
ITW Debt to Capitalization (ITW SEC filings)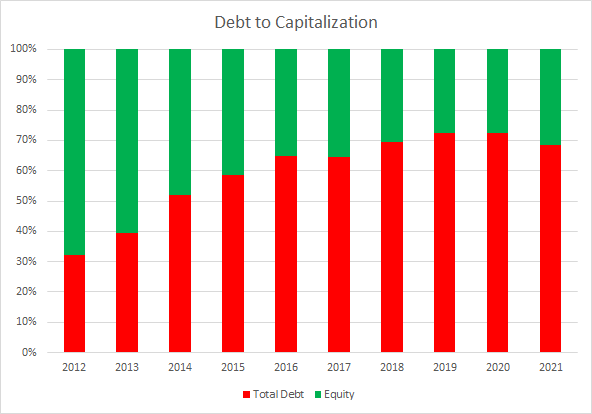
ITW’s debt to capitalization ratio has ramped up significantly over the last decade from ~32% in FY 2012 to 68% for FY 2021. However, it has stabilized in the 70% area for the last four years. The 10-year average debt-to-capitalization ratio for ITW is 59% with the 5-year average coming to 71%.
When trying to determine the risk of the debt load that a business carries, I place more emphasis on the net debt ratios. The net debt ratios look at the net debt on the balance sheet compared to some measure of profits or cash flow.
ITW Net Debt Ratios (ITW SEC filings)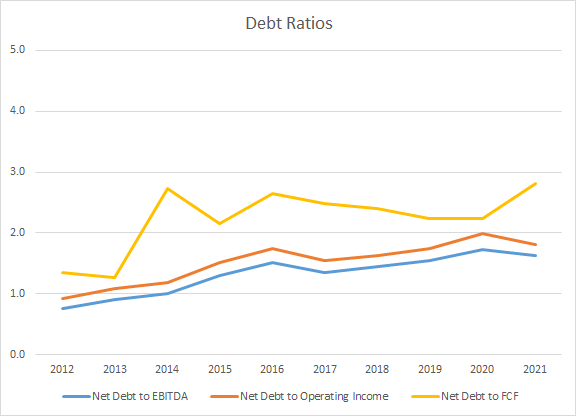
ITW’s net debt ratios have been rising although they still appear to be at manageable levels. The 10-year average net debt-to-EBITDA, net debt-to-operating income, and net debt-to-FCF ratios are 1.3x, 1.5x, and 2.2x, respectively. Accordingly, the 5-year averages are 1.5x, 1.7x, and 2.4x.
Valuation
When valuing potential investments I approach it from different viewpoints using different valuation methods. The methods that I use are the minimum acceptable rate of return, “MARR”, analysis, dividend yield theory, and a reverse discounted cash flow analysis.
On average analysts expect ITW to have FY 2022 EPS of $9.13 and FY 2023 EPS of $10.01. They also expect ITW to be able to show 10.6% annual EPS growth over the following 5-years. I then assumed that ITW would be able to grow EPS at a 5% rate for the following 5 years. Dividends are assumed to target a 50% payout ratio.
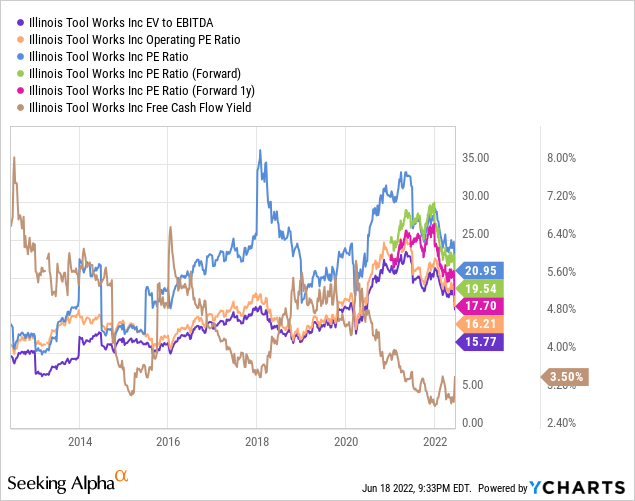
In order to determine the future share price we need to come up with an estimate of the terminal/exit multiple. Over the last decade investors have typically valued ITW’s earnings between ~10x and ~25x.
The following table shows the potential internal rates of return that an investment in ITW could generate provided the assumptions laid out above are reasonable forecasts for how the future plays out. Returns assume that dividends are taken in cash and that shares are purchased for $178.25, Friday’s closing price.
| IRR | ||
| P/E Level | 5 Year | 10 Year |
| 25 | 19.7% | 12.8% |
| 22.5 | 17.2% | 11.7% |
| 20 | 14.4% | 10.6% |
| 17.5 | 11.4% | 9.3% |
| 15 | 8.0% | 7.8% |
| 10 | -0.1% | 4.3% |
Source: Author
Additionally I use the MARR analysis framework to work backwards in order to determine the necessary purchase price to generate the returns given the assumptions above. My base hurdle rate is a 10% IRR and for ITW I’ll also examine 12% and 8% returns.
| Purchase Price Targets | ||||||
| 10% Return Target | 12% Return Target | 8% Return Target | ||||
| P/E Level | 5 Year | 10 Year | 5 Year | 10 Year | 5 Year | 10 Year |
| 25 | $257 | $221 | $238 | $190 | $279 | $259 |
| 22.5 | $234 | $204 | $217 | $175 | $254 | $238 |
| 20 | $211 | $186 | $196 | $161 | $229 | $217 |
| 17.5 | $189 | $169 | $175 | $146 | $204 | $197 |
| 15 | $166 | $152 | $154 | $131 | $179 | $176 |
| 10 | $120 | $117 | $111 | $102 | $129 | $135 |
Source: Author
Dividend yield theory is a valuation method based around reversion to the mean. It operates under the assumption that investors will generally value a business around a normal dividend yield given the future prospects of the business. For ITW I’ll use the 3-year average forward dividend yield as a proxy for the fair value.
Illinois Tool Works Dividend Yield Theory (ITW Investor Relations and Google Finance)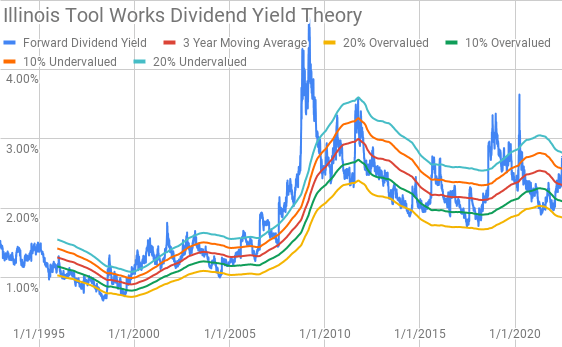
ITW currently offers a forward dividend yield of 2.74% compared to the 3-year average of 2.34%.
A reverse discounted cash flow analysis can be used to figure out what you need to believe about the future growth and margins for a business in order for it to generate the cash flows necessary to support the current valuation.
I use a simplified DCF model built on revenue growth, an initial free cash flow margin of 15.0% that improves to 18.5% over the forecast period, and a 3.0% terminal growth rate. Under those assumptions and with a 10% return requirement ITW needs to grow revenues at a 9.9% annualized rate between FY 2022 and FY 2031. Lowering the required return to 8% reduces the revenue growth to just 4.5% annualized through FY 2031.
Conclusion
ITW is a diversified industrial that I’ve had my eye on but I couldn’t justify adding shares due to the valuation. While growth has been hard to come by for ITW during the last decade they’ve been able to maintain strong margins and returns on capital. Share repurchases have been the big boost to per share growth adding roughly 4.6% annually over the last ten years.
Dividend yield theory suggests a fair value for ITW between $190 and $232. The MARR analysis based on a 10% IRR target 5-years out and a terminal multiple between 15x and 20x puts the fair value range between $166 and $211. Reducing the return target to 8% increases the fair value range to $179 to $229.
The reverse DCF analysis suggests that 10% returns are likely to be difficult to come by unless you expect a massive increase in ITW’s growth and/or margins. However, 8% returns do seem more achievable with just a 4.5% annualized revenue growth rate.
Of course share buybacks have clearly been a lever that ITW has pulled and will likely continue to do so. However, I do expect buybacks to slow from the rapid pace seen in the last decade. For every $1 spent on buybacks from free cash flow during that time an additional ~$0.50 had to be financed through asset sales, cash, or debt.
Going forward I would expect buybacks to still play a role; however, at a slower pace. Based on the 3-year average FCFaD ITW could repurchase ~1.4% of outstanding shares at the current market valuation.
With the payout ratio up over 50% of both earnings and free cash flow my expectation would be that dividend growth will track more in line with growth of the underlying business. The last 3 raises have come in at 7%, 6.5% and 7%.
In the short term there’s plenty of headwinds for ITW as interest rates have been on the rise and calls for a recession grow louder. As such ITW’s share price has pulled back 28% since it’s high reached in early 2022. However, over the long term I believe that ITW will continue to do fine as new construction and maintenance/upkeep can only be put off for so long. Once rates stabilize at some level construction spending will resume benefitting ITW.
The biggest concern that I have is what has fundamentally changed with the business that will allow them to reach their long term objectives that include 3-5% annual organic growth and 7-10% annual EPS growth. Especially in light of how the last decade has gone with essentially flat revenues and some minor growth further down the financial statements due to better operational efficiency.
ITW is getting interesting at the current share price and very well could find its way into my portfolio once cash becomes available in my account. Returns appear to be quite attractive should ITW hit on their long term objectives. ITW doesn’t necessarily appear all that cheap at current levels; however, for a high quality business such as ITW a reasonable valuation is all you really need.
Be the first to comment