

scanrail/iStock via Getty Images
This ETF review series aims at evaluating products regarding the relative past performance of their strategies and quality of their current portfolios. As holdings and weights change over time, updated reviews are posted when necessary.
IGRO strategy and portfolio
The iShares International Dividend Growth ETF (BATS:IGRO) has been tracking the Morningstar Global ex-US Dividend Growth Index since 05/17/2016. It has a portfolio of 398 stocks, a 12-month distribution yield of 2.99% and a total expense ratio of 0.15%. Dividends are paid quarterly.
As described in the prospectus by iShares, eligible companies must:
- pay a qualified dividend,
- have at least five years of uninterrupted annual dividend growth,
- have an earnings payout ratio of less than 75%,
- not be in the top decile of the Morningstar Global Markets ex-US Index ranked on dividend yield.
The fund invests mostly in large and mega cap companies (86% of asset value). About 42% is in Europe and the second region is Asia with 34%. The next chart lists the top 10 countries, representing an aggregate weight of 87%. Canada is the heaviest one with almost 21%, closely followed by Japan at about 19%. China and Hong Kong weigh 9% together, so direct exposure to geopolitical and regulatory risks related to China is moderate.
IGRO countries (Chart: author; data: Fidelity)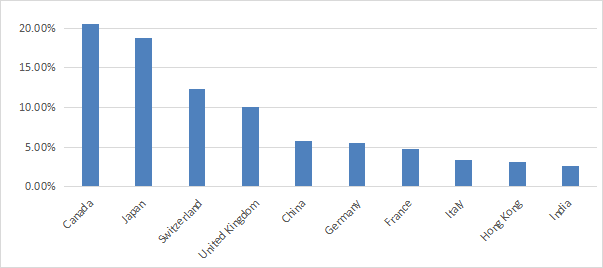
The fund is overweight in financials (23.3%). Then, come healthcare (13.5%), industrials (12.9%) and consumer staples (11.9%). Other sectors are below 10%.
IGRO sectors (Chart: author; data: iShares)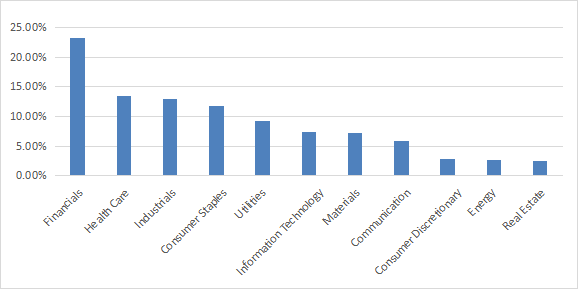
The price-to-earnings ratio looks cheap: 13.42. However, valuation metrics are naturally attractive, but unfortunately unreliable, in the fund’s heaviest sector. As a reference, the iShares Global Financials ETF (IXG) has a P/E of 9.98.
The top 10 holdings, listed below, represent 27% of asset value. No holding weighs more than 3.1% as of writing, so risks related to individual stocks are low.
|
Name |
Weight (%) |
Country |
Exchange |
Ticker* |
|
NOVARTIS AG |
3.08 |
Switzerland |
SIX Swiss Exchange |
NOVN |
|
NESTLE SA |
3.00 |
Switzerland |
SIX Swiss Exchange |
NESN |
|
SANOFI SA |
2.95 |
France |
Nyse Euronext – Paris |
SAN |
|
UNILEVER PLC |
2.92 |
United Kingdom |
London Stock Exchange |
ULVR |
|
ENEL |
2.81 |
Italy |
Borsa Italiana |
ENEL |
|
ROCHE HOLDING AG |
2.81 |
Switzerland |
SIX Swiss Exchange |
ROG |
|
ROYAL BANK OF CANADA |
2.44 |
Canada |
Toronto Stock Exchange |
RY |
|
TORONTO-DOMINION |
2.38 |
Canada |
Toronto Stock Exchange |
TD |
|
IBERDROLA SA |
2.35 |
Spain |
Bolsa De Madrid |
IBE |
|
SAP |
2.34 |
Germany |
Xetra |
SAP |
* Ticker in primary exchange. Some holdings have ADRs listed in the U.S. To find them, copy and paste the name in Seeking Alpha’s search box.
Past performance compared to competitors
The next table compares IGRO performance since 6/1/2016 with three international dividend growth ETFs:
- The Invesco International Dividend Achievers ETF (PID), reviewed here.
- The Vanguard International Dividend Appreciation ETF (VIGI), reviewed here.
- The WisdomTree Global ex-U.S. Quality Dividend Growth (DNL), reviewed here.
|
since 6/1/2016 |
Total Return |
Annual.Return |
Drawdown |
Sharpe |
Volatility |
|
IGRO |
36.85% |
4.95% |
-35.30% |
0.24 |
15.69% |
|
PID |
55.76% |
7.06% |
-43.36% |
0.36 |
18.50% |
|
VIGI |
50.25% |
6.47% |
-30.29% |
0.34 |
14.35% |
|
DNL |
61.90% |
7.70% |
-35.92% |
0.35 |
16.72% |
Data calculated with Portfolio123, reinvesting dividends.
IGRO is the worst performer of the group in total return and in risk-adjusted performance (Sharpe ratio). Moreover, most international funds have underperformed the U.S. market in this period: SPY has returned 112.7% in the same time (12.3% annualized).
In 2022 to date, IGRO is second to PID in total return in the same group (see next chart).
IGRO vs. competitors in 2022 (Portfolio123)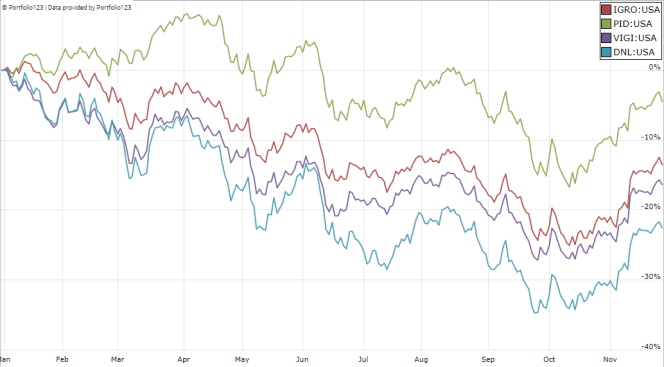
Takeaway
IGRO holds about 400 dividend stocks, mostly large caps from developed countries. The top 2 countries, Canada and Japan, weigh 40% together. Europe represents about 42% of asset value. The fund is overweight in financials. Therefore, valuation ratios are skewed and the fund may not be as cheap as it looks. The yield is quite attractive for a dividend growth fund, but total return since inception is significantly behind at least 3 other global dividend growth ETFs. For transparency, a dividend-oriented part of my equity investments is split between a passive ETF allocation (IGRO is not part of it) and my actively managed Stability portfolio (14 stocks), disclosed and updated in Quantitative Risk & Value.
Be the first to comment