


DisobeyArt/iStock via Getty Images
Written by George Spritzer, co-produced by Alpha Gen Capital
This May Be A Good Time For Covered Call Funds
Covered call portfolio managers hold a portfolio of stocks and write call options against a portion of the portfolio to generate additional income.
The covered call segment of the closed-end fund market tends to outperform when:
- Implied volatility is relatively high: I use the VIX indicator to estimate whether option premiums are above or below average. The VIX is currently around 21, but has recently been above 30.
- In a sideways or a down market. You give up some upside, but get some downside protection in return.
Investment Objective: Voya Global Advantage and Premium Opportunity Fund (NYSE:IGA) combines an actively-managed quantitative equity investment strategy with option call writing to create a diversified portfolio with enhanced total return potential over a full market cycle.
Investment Strategy
- Sells call options on selected security indexes and/or ETFs, on approximately 50-100% of the total underlying value of the portfolio.
- Hedges major currency exposure to reduce volatility.
- The Fund uses fundamental analysis, and selects securities through solid long-term based analysis of a company’s sales, margins and capital use. The Sub-Advisers try to target a relatively high “active share” compared to the MSCI World Index (in other words, they are not just “closet” indexers).
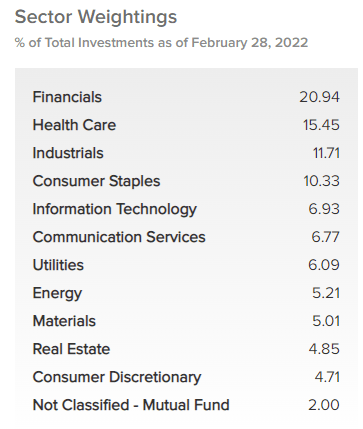
IGA Sector Weightings (IGA website)
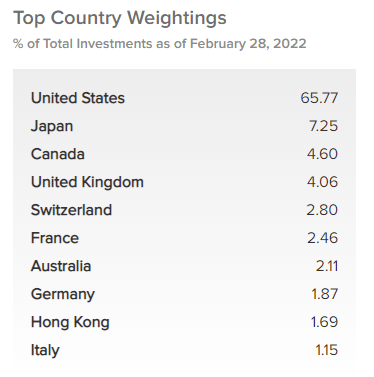
IGA Country Weightings (IGA website)
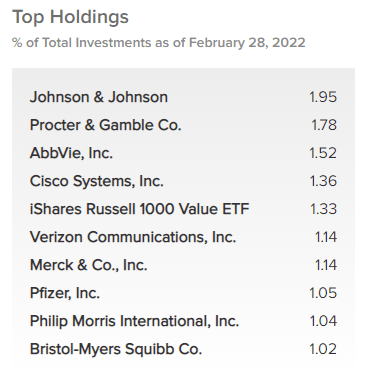
Top Holdings- IGA (IGA Website)
Under normal market conditions, IGA writes options on about 50% of its net assets. But this can vary with market conditions. As of Feb. 28, 2022, 49.94% of the portfolio was overwritten
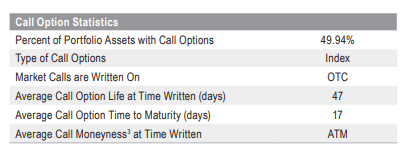
Option Statistics for IGA (IGA website)
IGA- Institutional Ownership
Institutional investors own about 21.4% of the shares outstanding. The top two institutional investors are Guggenheim Capital who owned $13.3 million and Morgan Stanley who owned $7.4 million as of 12/31/2021. Many of these shares are likely held by financial advisors in managed accounts.
There are no activist investor with large holdings, although Saba Capital did have a relatively smaller stake of $1.6 million.
Source: nasdaq.com
Correlation Analysis
Three month NAV Correlation with HGLB = 72%
Three month NAV Correlation with DEX = 37%
Three month NAV Correlation with ETW = 34%
Three month NAV Correlation with SPY = 42% S&P 500
Three month NAV Correlation with TLT = -7% 20 Year Treasury
Source: cefanalyzer
IGA- Investment Performance
Here is the total return NAV performance compared to its benchmark index since 2021. The benchmark index is the Morningstar US Market Total Return USD.
|
IGA NAV Performance |
Index performance |
|
|
2012 |
14.71% |
16.27% |
|
2013 |
15.05% |
33.13% |
|
2014 |
3.08% |
12.85% |
|
2015 |
0.40% |
0.69% |
|
2016 |
7.60% |
12.44% |
|
2017 |
18.14% |
21.47% |
|
2018 |
-6.88% |
-5.05% |
|
2019 |
17.25% |
31.22% |
|
2020 |
-6.31% |
20.90% |
|
2021 |
19.03% |
25.78% |
|
YTD |
-0.03% |
-4.16% |
NAV performance has been basically breakeven so far in 2022, and IGA has beaten its index and most of its peers. But over the longer term, IGA has consistently underperformed its US-based index, because of its option hedging and exposure to international stocks.
You may wonder why you would want to add IGA to a portfolio if it has consistently underperformed its US benchmark since 2012.
One reason why this may make sense is that US versus international stock performance tends to run in cycles that last around ten years. If this pattern continues, international stocks may be due to outperform US stocks over the next decade.
The covered call hedging of IGA has also hurt performance during years when the stock market is very strong. But we may be heading into a period where we will see more sideways or down market years as well.
IGA- Three Year Discount History
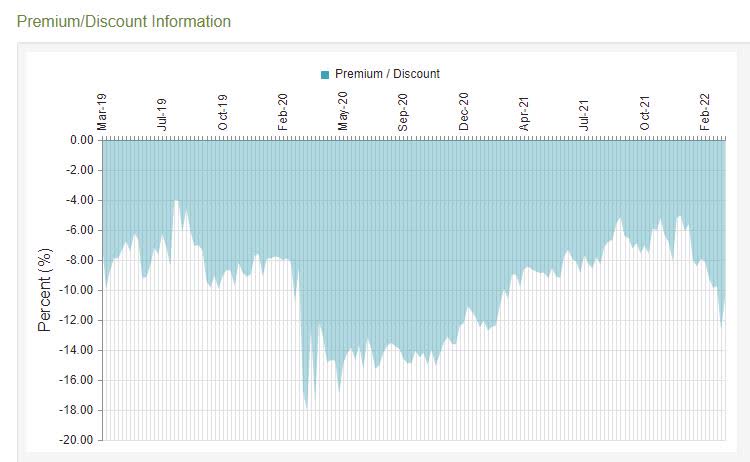
IGA Discount History (cefconnect.com)
As of April 5, IGA traded at a -10.91% discount. The current discount is well below the 6-month and one year averages.
Voya Global Advantage and Premium Opportunity
Ticker: IGA NAV Ticker: XIGAX
Inception Date: Oct. 26, 2005
Total Investment Exposure: 175.6 Million
Total Common Assets: 175.6 Million
Baseline Expense ratio= 0.97%
Leverage: None
Discount= -10.95%
Average 6 Month Discount= -7.68%
Annual Distribution Rate (market price) = 8.25%
Current Quarterly Distribution= $0.197
Annual Distribution= $0.788
IGA is a partially hedged way to bet on potential future outperformance of international stocks. It trades at an attractive discount.
IGA has an average daily trade volume of 35,000 shares or about $340,000. It usually trades with an average bid-asked spread of about two cents, but it can narrow to one cent or widen to three or four cents at times. I would definitely recommend using smaller limit orders when trading IGA.
IGA can be a good fund to add to a portfolio which may be top heavy in US tech securities. It runs a value-oriented global portfolio which adds diversification benefits. This may be a good time to add a lower beta alternative to straight equity index funds.
Be the first to comment