

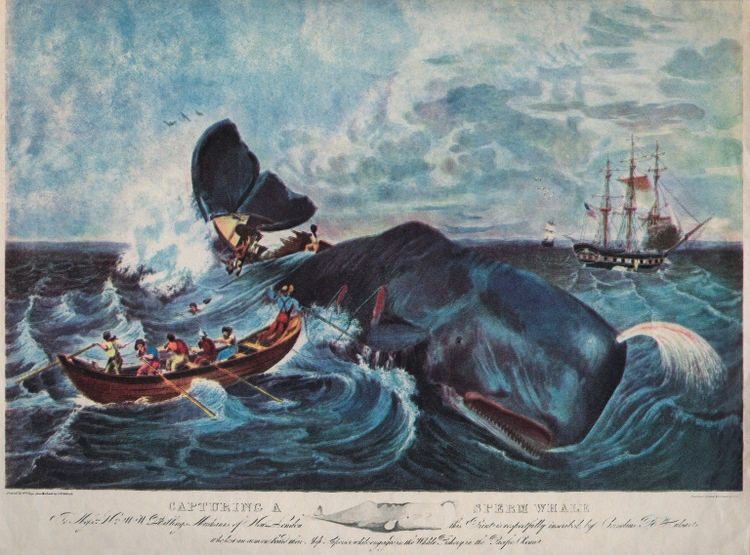
Hulton Archive/Hulton Archive via Getty Images
Introduction
Historically, whale oil was a notable energy source, a lubricant, and a crucial manufacturing feedstock. Whale oil was used as lamp fuel for lighting; as a high pressure lubricant in machinery; and in the production of soap, varnish, leather, and linoleum. Additionally, whale oil was extremely important in the manufacture of nitroglycerin for explosives in both world wars. Whalers, no doubt, were intrepid capitalists, and arguably took greater risks than today’s most aggressive growth investors.
While whale oil provided lighting, wood was the dominant energy source in early US history. In the early 1850’s fossil fuels emerged and overtook wood as the dominant energy source by the late 1800’s. In July 2020 US EIA provided this chart in its series Today in Energy; red annotations are by this author.
US Energy 1776 – 2019 (quadrillion btu)
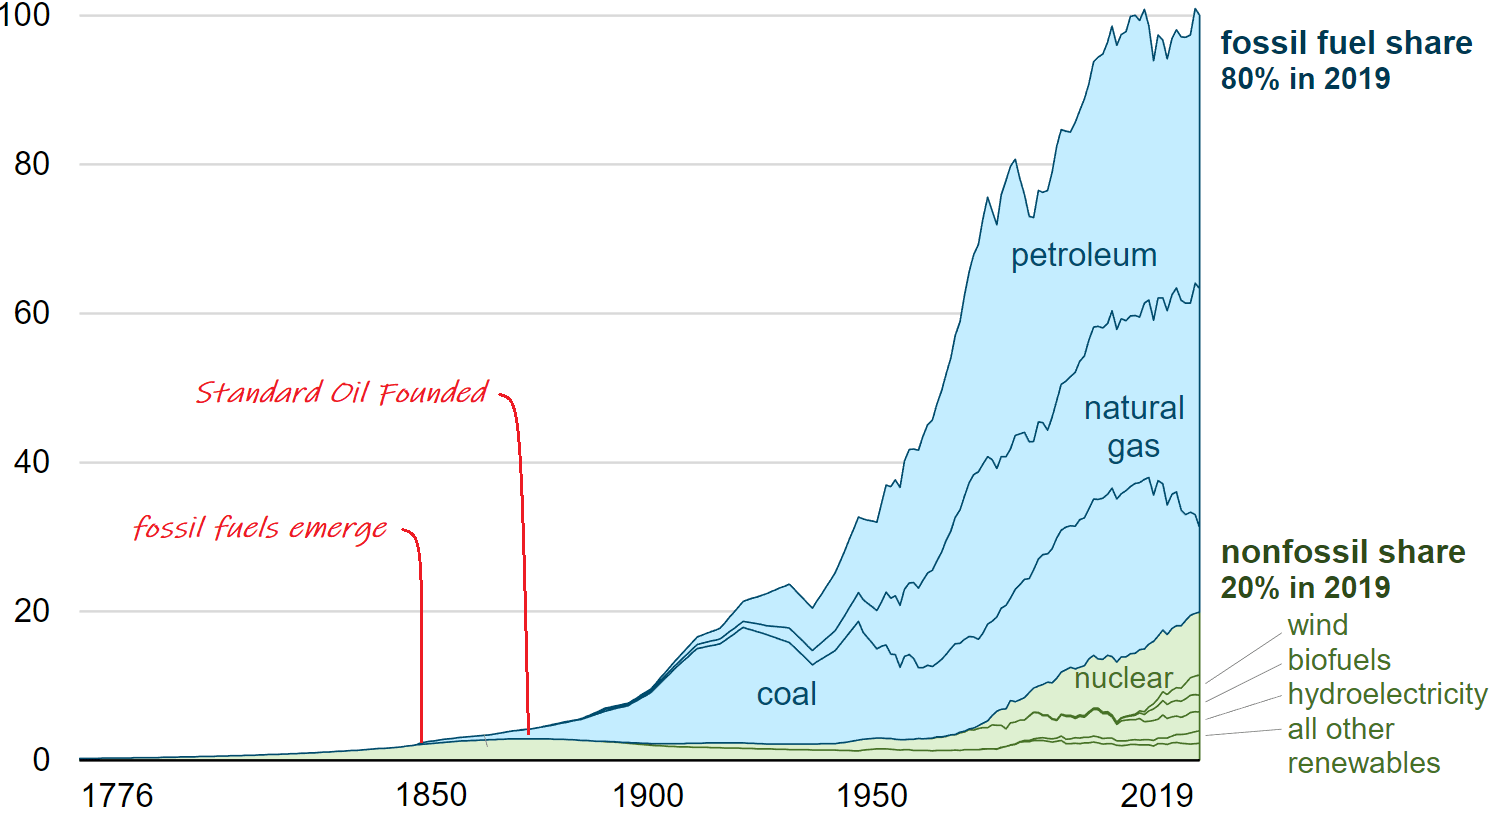
US EIA
From 1776 through 1850, US energy was nearly 100% renewable, wood was essentially the only energy source available. Fossil fuels including coal, petroleum, and natural gas emerged as energy sources around 1850 and remain about 80% of total US energy supply today. Renewable energy (besides wood) emerged around 1900 with hydroelectricity and is accelerating today with wind and solar generated electricity.
Wood cutters in 1850 and today’s energy investors are arguably in a similar position. Only the most foolish woodcutter threw away his axe in 1850 and let his neighbors’ homes grow cold; wood continued to grow as an energy source for several years post 1850. Likewise, oil and gas remain a viable investment and a critical resource today. However, while wood cutters didn’t go hungry, none created generational wealth either. There are no Gilded Age mansions named after woodcutters. However, John D. Rockefeller founded Standard Oil in 1870 and Rockefeller mansions still stand today in NYC and the Hudson River Valley.
Retrospectively, the most foolish investor can safely conclude that investing with John D Rockefeller in the early 1870’s would be a good idea. It would have been an even better idea to invest with Rockefeller in 1863 when he joined two partners in an oil refining business in Cleveland, Ohio. Broadly speaking, renewable energy is similar to oil in 1863. I’m neither foolish nor bold enough to predict what companies or technologies will offer the best return. I’m absolutely certain some equities in the sector will bottom to zero over the next several years while others produce spectacular returns.
Some of us may have the risk tolerance to stand in the bow of a small whaling boat and try to harpoon Moby Dick by investing in individual renewable energy equities. For the rest of us, adding a complimentary renewable energy ETF to a well-built portfolio is a sound option.
The Funds: ICLN, QCLN, and TAN
NASDAQ:ICLN, NASDAQ:QCLN, and NYSEARCA:TAN are the 3 largest renewable energy ETF’s by assets under management. All are based on renewable energy indexes: ICLN tracks S&P Global Clean Energy Index via representative sampling, QCLN tracks NASDAQ Clean Edge Green Energy Index with full replication, and TAN tracks MAC Global Solar Energy Index with full replication.
Fund Profiles
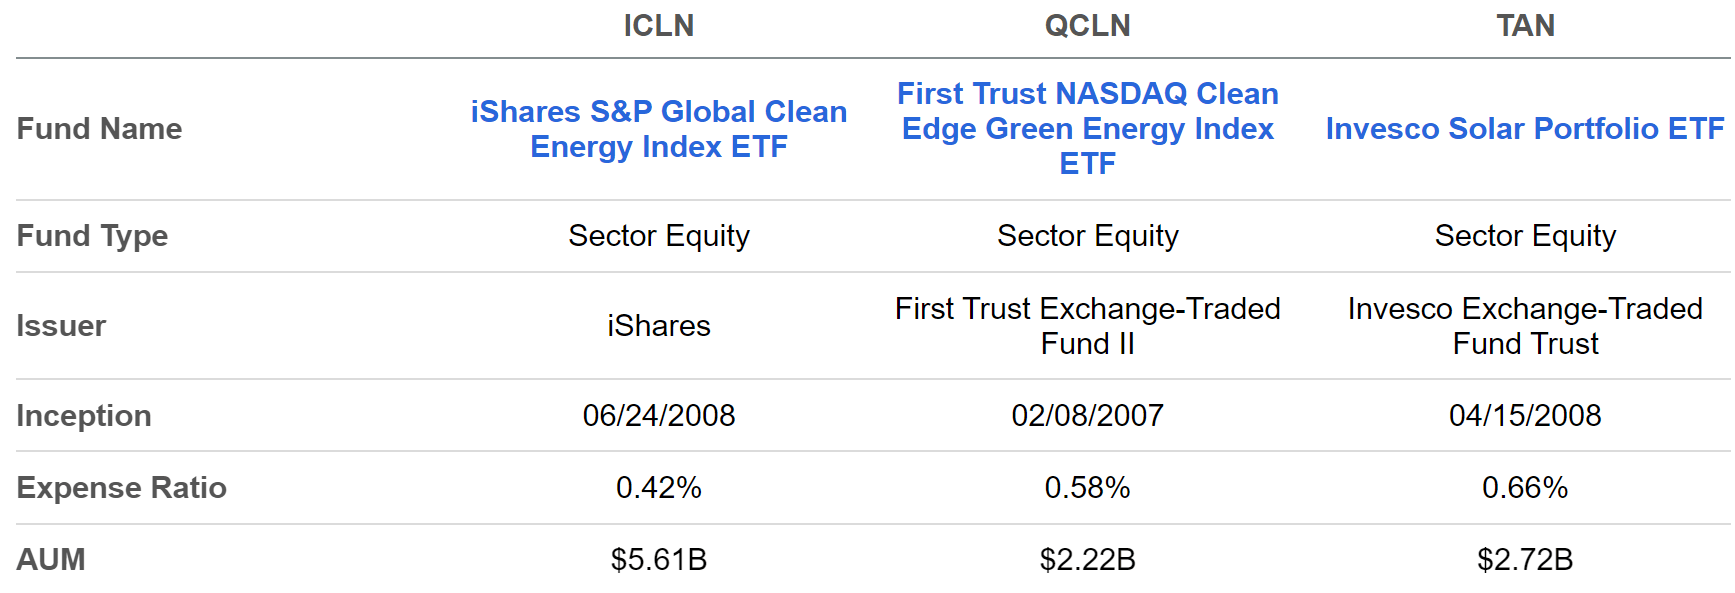
Seeking Alpha
ICLN, QCLN, and TAN, each have reasonable expense ratios under 0.7% and over $2B in assets under management.
Fund Quant Grades
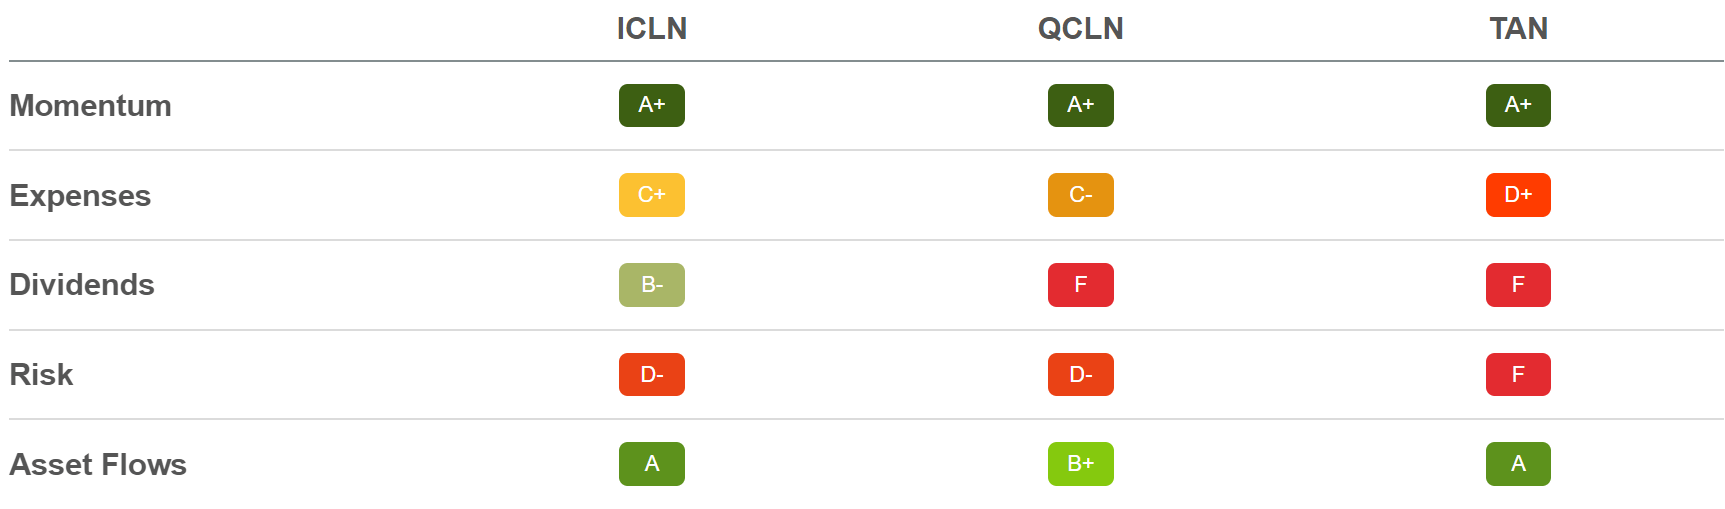
Seeking Alpha
All three funds have comparable Quant scores with excellent momentum and asset flows. ICLN stands out for dividends within the group; it currently has a 1.13% forward yield.
Holdings
Although all three funds follow clean energy indexes. Top 10 holdings, concentration, sector allocation, market cap distribution, and geographic distribution are notably different.
Top 10 Holdings
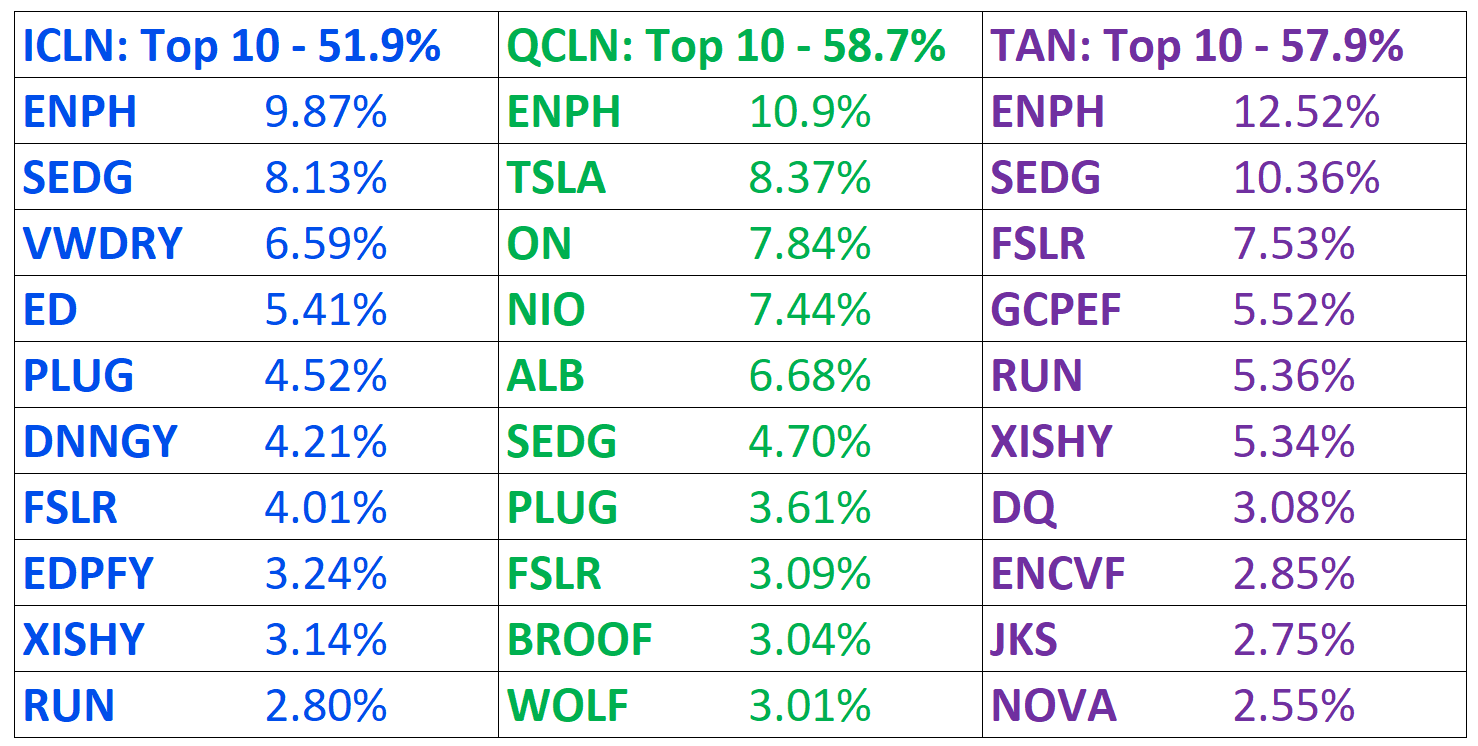
Seeking Alpha
ICLN, QCLN, and TAN are not alarmingly concentrated with top 10 total weights of 51.9%, 58.7% and 57.9% respectively. Enphase (ENPH) is the top holding of all three funds at between 10-13%.
Top 10 Holdings Distribution
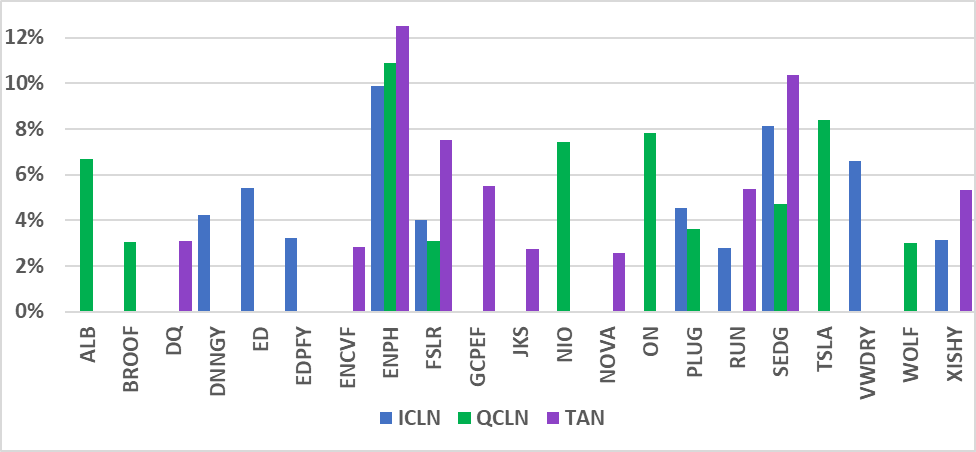
Author, Seeking Alpha Data
First Solar (FSLR) and SolarEdge (SEDG) are also common top ten holdings in all three funds. Plug Power (PLUG) is included in both ICLN and QCLN while Xinyi Solar Holdings (OTCPK:XISHY) is included in both ICLN and TAN.
Holdings Sector Allocation
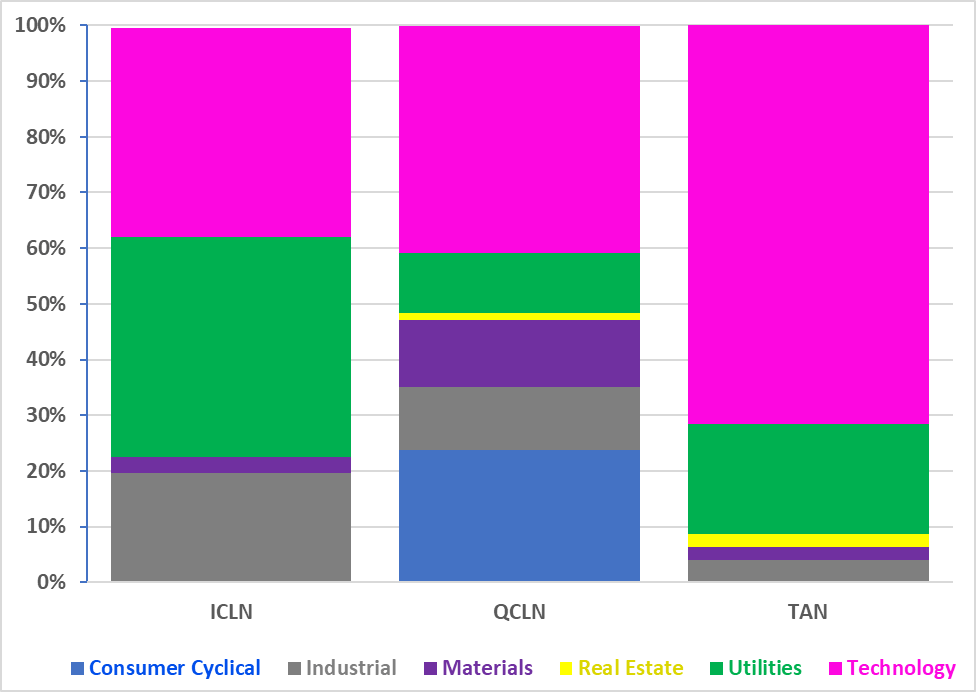
Author, Seeking Alpha Data
The three funds are surprisingly different in their sector allocations. TAN is mostly a technology fund with over 72% of its holdings in the sector while ICLN and QCLN are 38% and 41% technology, respectively. ICLN’s biggest sector exposure is utilities at 39% with this exposure contributing to its superior dividend Quant Score noted above. QCLN is the only fund with consumer cyclical exposure with 24% allocated to the sector and holdings including electric vehicle equities Tesla (TSLA) and NIO Inc (NIO).
Holdings Market Cap Distribution
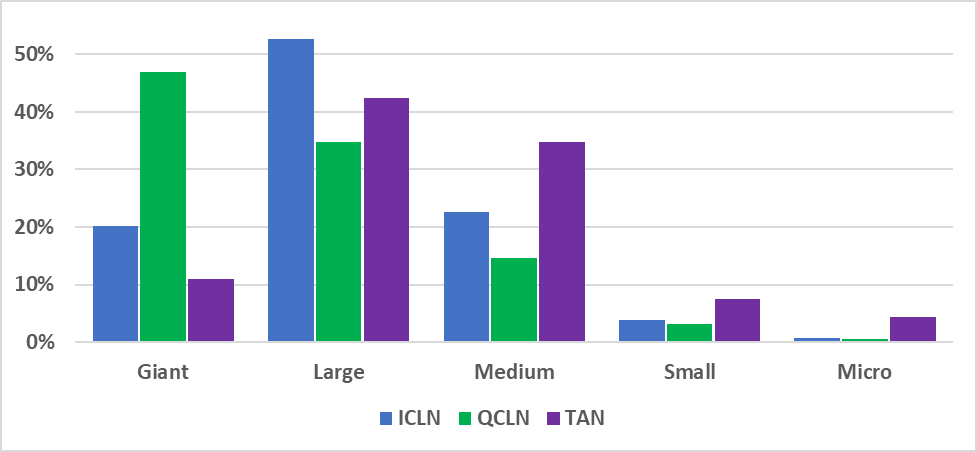
Author, Seeking Alpha Data
The three funds also exhibit notable differences in their market cap distributions. QCLN is most heavily weighted towards giant and large caps while TAN has the most medium, small, and micro-cap exposure. ICLN’s biggest exposure is large caps with substantial giant and medium exposures.
Holdings Geographic Distribution
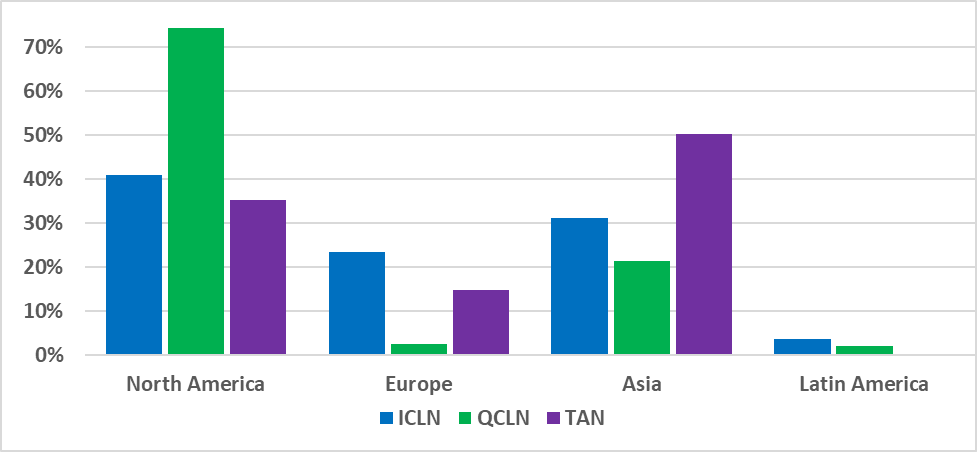
Author, Seeking Alpha Data
ICLN has the most equal geographic distribution while QCLN is most heavily weighted towards North America. TAN is most heavily weighted towards Asia with moderate exposure to North America and Europe.
Historic Return and Current Momentum
Historic Total Return
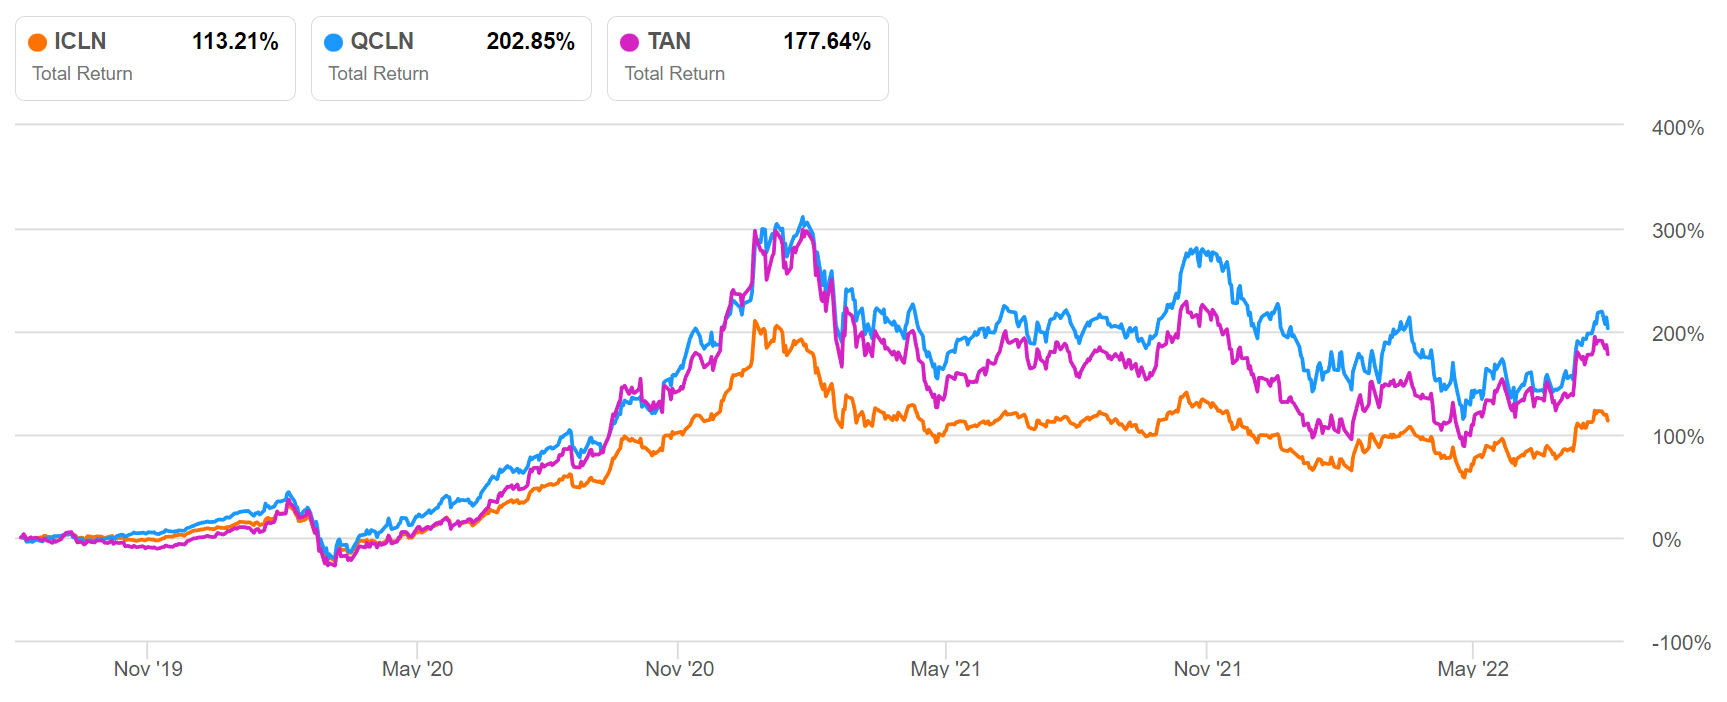
Seeking Alpha
ICLN, QCLN, and TAN total returns are plotted from August 2019 to present. Generally, one can observe that the funds are exceptionally volatile. The funds each dipped about 70% in the 2020 pandemic dip. They then rallied over 300% until they peaked in early 2021 and dipped over 100% from that peak before rebounding again in late 2021. Since late 2021, the funds have trended down until late July of this year when they rebounded on US political and legislative news. A whaling boat might be a less exhilarating ride.
ICLN Momentum
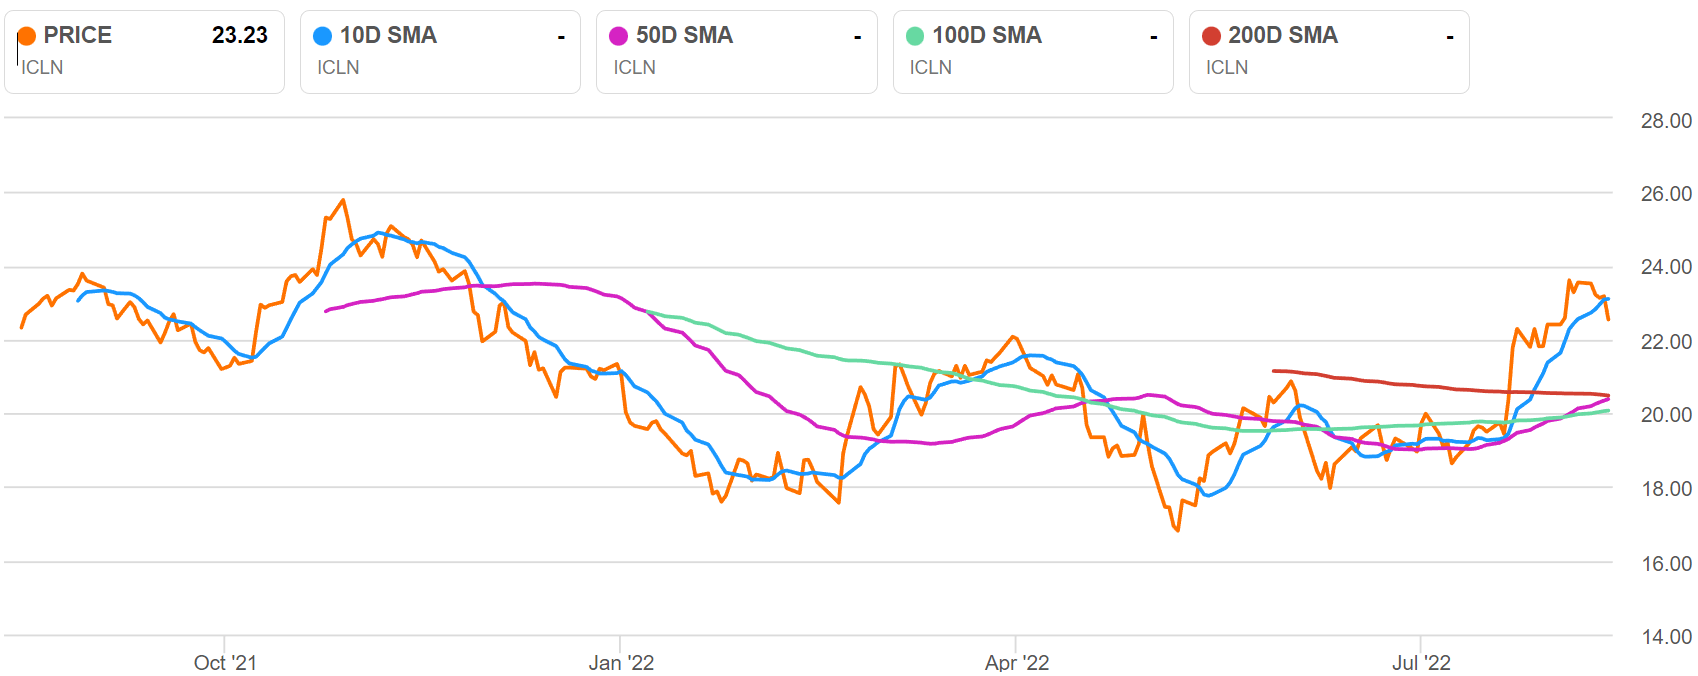
Seeking Alpha
ICLN momentum is plotted over 3 years and assumed to be representative within this discussion. Recently, the fund has spiked well above its 200, 100, 50, and even 10 day moving averages before beginning to retreat last week. The catalysts for this spike include a legislative compromise involving US senators Schumer and Manchin and passage of a climate bill in the US senate. Late last week, ICLN dropped about 5% from highs earlier in the week as market sentiment cooled.
More Recent News
For those investors who not willing to make decisions based on news that is over 150 years old, let’s move forward to the early 2000’s and the emergence of shale gas into the US energy supply.
US Energy 1776 – 2019 (quadrillion btu)
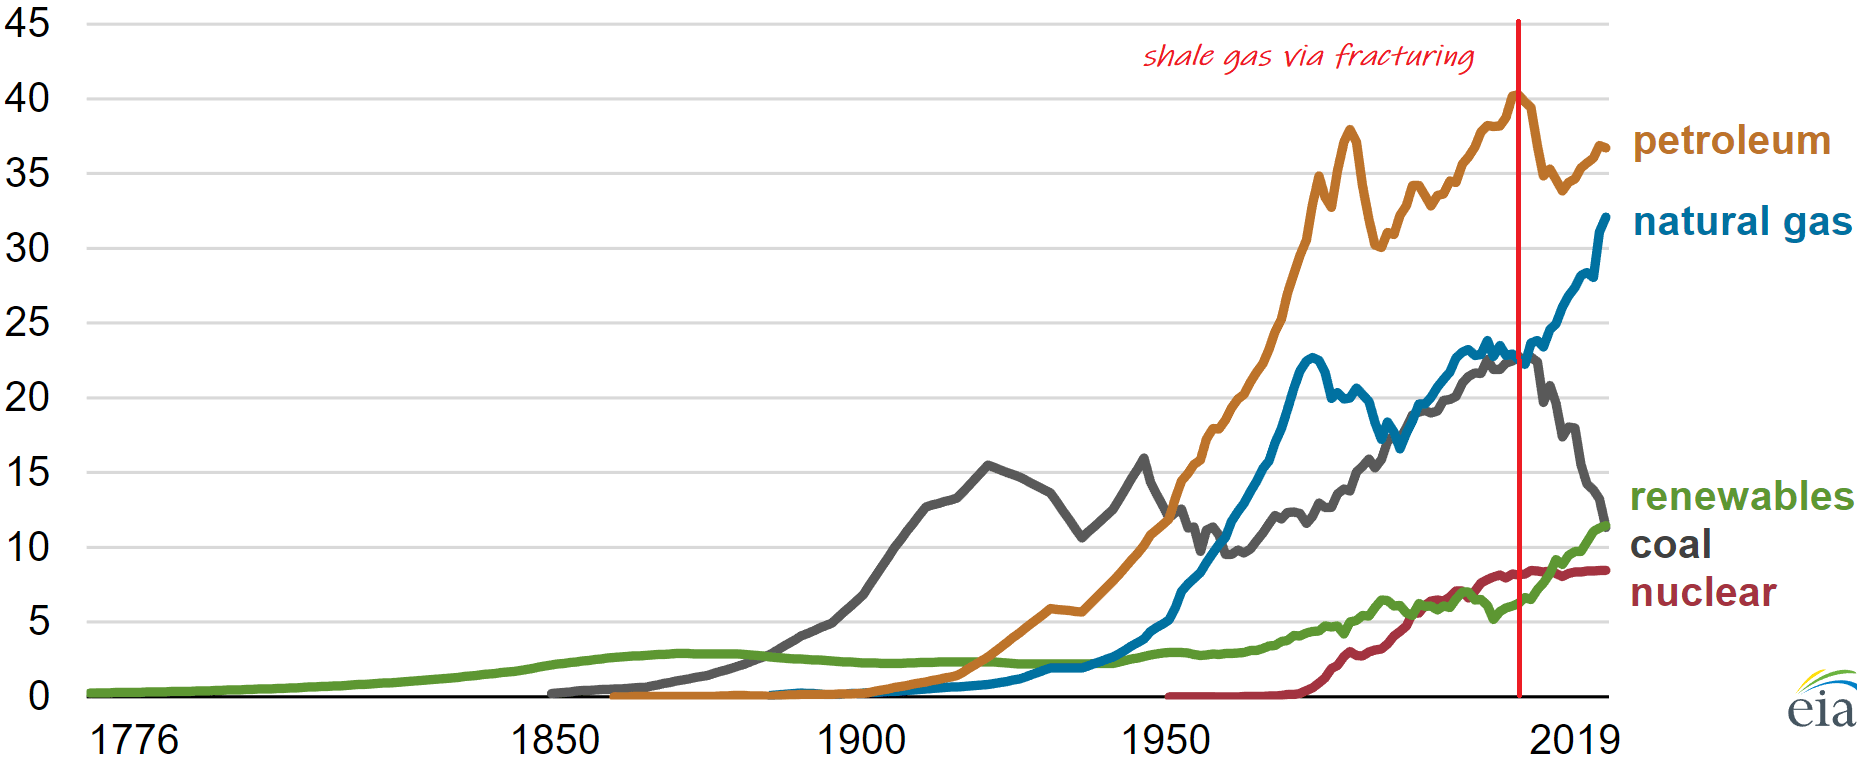
US EIA
These are the same data examined previously but plotted as individual trend lines rather than cumulative areas. Again, red annotations are by this author. We will discuss a more recent transformative shift in energy markets; shale gas.
Large-scale natural gas production from shale began around 2000, when shale gas production began in the Barnett Shale in north-central Texas. By 2005, the Barnett Shale was producing almost half a trillion cubic feet of natural gas per year. Soon, shale gas production began in the Fayetteville Shale in northern Arkansas, Haynesville in eastern Texas and north Louisiana, the Woodford in Oklahoma, the Eagle Ford in southern Texas, and the Marcellus and Utica shales in northern Appalachia.
The commercial production of shale was made possible by emerging technologies including horizontal drilling and hydraulic fracturing. The resulting cheap and abundant natural gas subsequently transformed US energy consumption. Sharp decline in coal consumption was the immediate result and natural gas continues to offset coal consumption today.
Renewable Energy Growth
The current trend in the US and globally includes more recent emerging technologies; renewable energy and electrification of transportation (EVs) and other sectors. EIA published the following data in its August 16th iteration of Today in Energy.
US Electricity Generation 2010-2023 (million gigawatt hours)
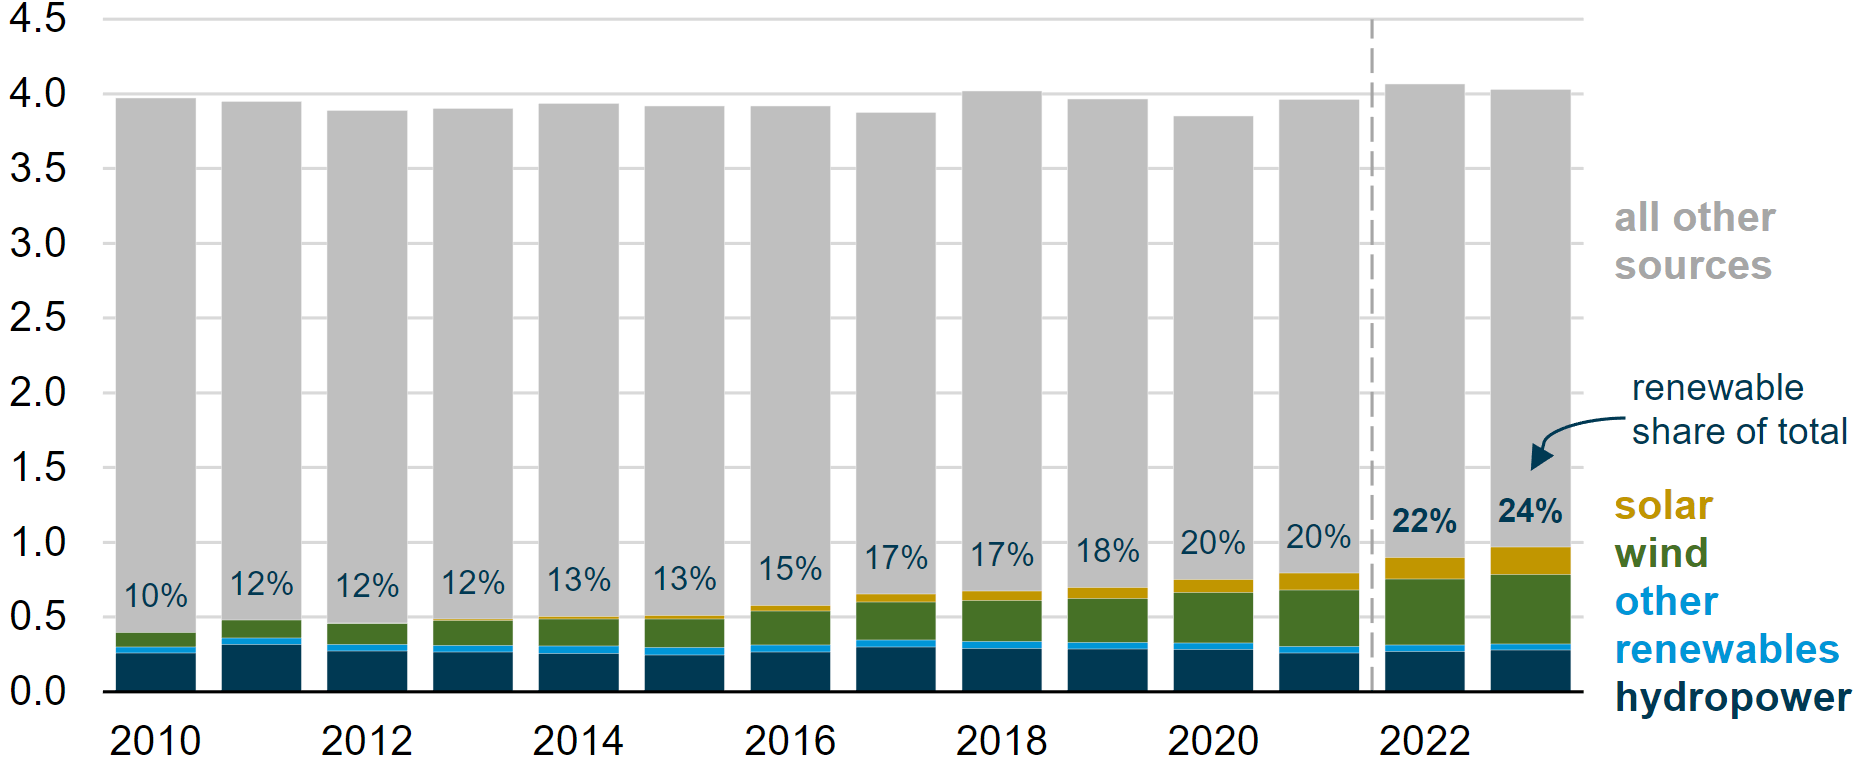
US EIA
Renewable electricity has increased over 100% since 2010 and is expected to grow another 10% next year. Renewable electricity generation including wind and solar is becoming increasingly price competitive with natural gas generation. Currently renewable electricity is subject to limitations including intermittency, baseload management, peak load response, and high storage costs. These challenges may be met with increased grid connectivity, storage advances, and other technologies.
Risks
ICLN, QCLN, and TAN will likely continue to be volatile funds subject to political whims and market frenzy. Governments and industry may lack the resolve to execute their own renewable energy initiatives with inflation and recession remaining prime concerns. I refer readers to my recent coverage of VDE for a more rigorous discussion of the renewable energy transition.
Current oil and gas prices are elevated with tight supply providing impetus for renewable energy investments. Further, the high cost of renewable energy investment appears more favorable when compared to current high oil and natural prices. Energy markets may fall and diminish these incentives.
Recommendations
I think every portfolio should have some exposure to renewable energy. I would recommend prudent investors allocate between 1 and 5% to this volatile sector depending on their own risk tolerance. A methodical investor will carefully choose between ICLN, QCLN, and TAN in order to carefully manage the exposure and diversification of an individual portfolio. Some investors may wish to add exposure to Asia with TAN while others may prefer QCLN’s North American concentration. Similarly, some investors may wish to add exposure to electric vehicles through QCLN while others do not.
Given current momentum, I do not recommend that investors initiate maximum positions in ICLN, QCLN or TAN at current market prices. I expect the funds to fall towards their longer-term moving averages in the weeks to come as market sentiment continues to cool.
The return of any investment is highly dependent on its initial entry price. I recommend investors accumulate the funds at or below the following levels: ICLN – $21.5, QCLN – $61.1, and TAN – $80.7.
If a man does not know to which port he is sailing, no wind is favorable – Lucius Annaeus Seneca
Be the first to comment