

Michael Derrer Fuchs
International Business Machines Corporation (NYSE:IBM) has just declared its Q3 earnings as covered by Seeking Alpha here. With a beat on both EPS and revenue, shares are trending higher after hours, up as much as 5% as of this writing. Please bear in mind, though, post-earning prices are very volatile and things may have turned south by the time you are reading this article. But fear not, this article is not about a quick trade.
We have a history of analyzing dividend coverage based on free cash flow after earnings as can be seen here.
Why cash flow over EPS
When evaluating dividend coverage, most investors and analysts tend to look at earnings per share (EPS). We prefer free cash flow (“FCF”) as a better indicator of financial health for these reasons:
- Earnings tend to be up and down depending on rare events and write-offs.
- Earnings are more prone to GAAP-related fluctuations.
- Cash flow is king.
Let us see how IBM’s dividend coverage looks after this recent quarterly result.
- Total shares outstanding: 903.18 M
- Current quarterly dividend per share: $1.65
- Quarterly FCF required to cover dividends: $1.490 billion
- FCF in Q3: $0.8 billion – According to the earnings release: “On a consolidated basis, in the third quarter, the company generated net cash from operating activities of $1.9 billion or $1.2 billion excluding IBM Financing receivables. IBM’s free cash flow was $0.8 billion.“
- Payout ratio using FCF: 186.25% ($1.998 billion divided by $2.9 billion)
- EPS reported: 1.81 cents
- Payout ratio using EPS: 91% ($1.65 divided by $1.81)
Wait, what? Is the dividend in danger given that EPS-based payout is so high at 91% and free cash flow based payout ratio is double that at a disastrous looking 186%? Not so fast. In the same earnings release, it says, “The company continues to expect about $10 billion in consolidated free cash flow.“
Let us run the same numbers above based on full year.
- Total shares outstanding: 903.18 M
- Current annual dividend per share: $6.60
- Annual FCF required to cover dividends: $5.960 billion
- Projected FCF for 2022: $10 Billion. IBM already has $7.83 billion in the first 3 quarters, including the just reported ~0.8 billion.
- Payout ratio using annual FCF: 59.60% ($5.960 billion divided by $10 billion)
- Projected forward annual EPS for 2022: $9.29
- Payout ratio using EPS: 71% ($6.60 divided by $9.29)
Phew, the annual numbers look a lot better and reaffirm a couple of our beliefs:
1. Free cash flow shows deeper pockets for companies that decide to use free cash flow to fund future growth activities. This is supported by the earnings release, which states:
“Our portfolio mix, business fundamentals, strong recurring revenue stream and solid cash generation allow us to invest for continued growth and return value to shareholders through dividends.“
2. Short-term fluctuations are normal even for a business as established as IBM.
To summarize, IBM’s dividend coverage after this quarterly result and projections is sound based on both FCF and EPS, with FCF projecting a more accurate picture.
Forward-Looking Thoughts and Conclusion
- IBM continues to see invest in its Hybrid Cloud strategy, and the numbers seem to be supporting the thesis. In the just reported quarter, IBM reported a revenue increase of 15% in this segment. Hybrid Cloud is expected to grow at 21% CAGR through the next few years.
- The company expects above its mid-single digit range for annual revenue growth, something not many companies can say in the current environment.
- In a market that severely punishes unprofitable tech companies, IBM is a safe bet. Not to forget the juicy yield. As shown below, the current yield of 5.40% is the highest in the last 5 years except for a couple of instances, one notably being the COVID lows.
- We continue being invested in IBM and will look at adding to our portfolio in the $120s and below subject to funds and market conditions.
IBM Yield (YCharts.com)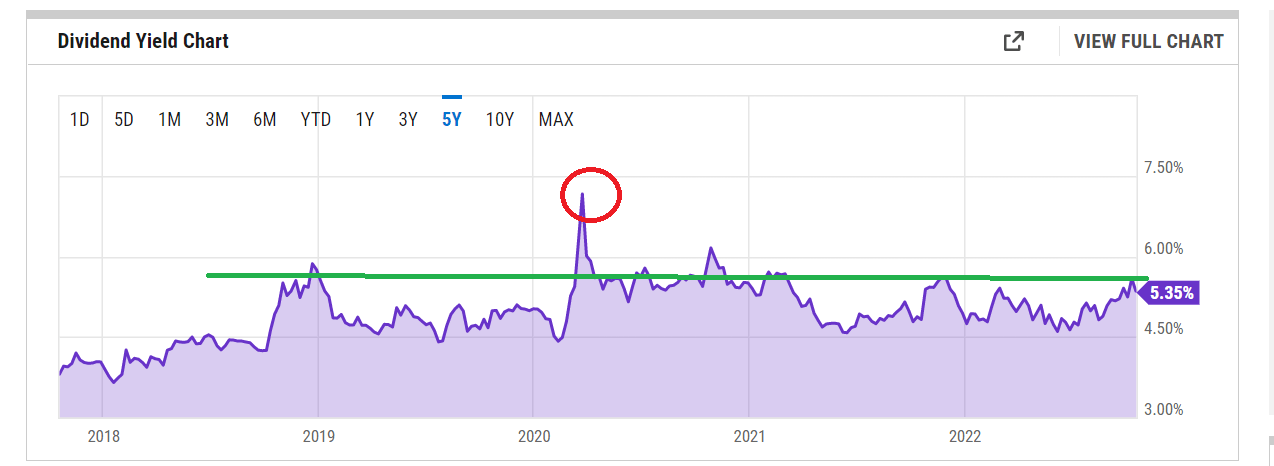
Be the first to comment