


David Ramos
IBM (NYSE:IBM) is something of an anomaly this year: A big tech company with a positive return. The shares have had a total 12-month return of 13.2% over the past 12 months, as compared to -26.4% for the information technology services industry group (as tracked by Morningstar), -18.8% for the S&P 500 (SPY) and -34.2% for the Nasdaq100 (QQQ). It’s important to understand that IBM is not directly comparable to major tech firms, however. A key distinction between IBM and other major tech firms is that IBM is more aligned with value attributes than growth attributes. The prices of value stocks depend more on current earnings and less on projected growth rates, as compared to growth stocks. Higher interest rates result in an increased discount factor applied to future earnings which, in turn, reduces the net present value of those future earnings. Value stocks are expected to hold up better than those of more growth-oriented stocks when interest rates go up and that is what has happened in 2022. The iShares S&P 500 Value ETF (IVE) has returned a total of -5.3% over the past 12 months vs. -30.6% for the iShares S&P 500 Growth ETF (IVW).
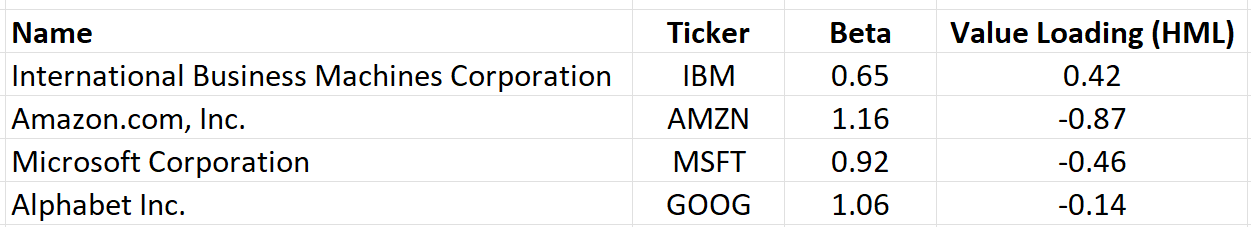
A straightforward way to measure whether a stock is aligned with value or growth is to run a Fama French 3-factor analysis. The 3 factors are beta, size, and value and are estimated with a regression calculation. I ran this analysis using three years of data (through October 2022, the latest available data) and the table below shows the beta and value loadings for IBM vs. Amazon (AMZN), Microsoft (MSFT) and Alphabet (GOOG). The contrast between IBM and these other tech giants is very clear. First, IBM has a beta that is well below those of these other companies. Second, IBM has a strong positive value loading, showing that IBM is a value stock, as compared to negative loadings for these other three stocks (consistent with a growth orientation). For context, IVE and IVE have betas of 0.87 and 1.08 (respectively) and value loadings of 0.36 and -0.27 over this same historical period. IBM’s forward P/E is 15.8, consistent with a value orientation.
Portfolio Visualizer
Beta and Fama French value factor loading for 36 months through October of 2022 (Source: PortfolioVisualizer.com)
The company is in the midst of a multi-year turnaround, guided by CEO Arvind Krishna’s vision for revitalizing the company. Along with professional services, IBM is focusing on artificial intelligence and hybrid cloud implementations. The company is making clear strides in the new direction, with healthy growth in consulting, hybrid cloud, and AI, but one wonders how much of the outperformance in 2022 is due to IBM’s value and defensive attributes rather than a reflection of a shift in the consensus view of the company’s longer-term prospects.
IBM has a forward dividend yield of 4.63% and has raised the dividend for 23 consecutive years. The trailing 3-, 5-, and 10-year dividend growth rates are 2.4%, 3.2%, and 7.7% per year, respectively. The decline in the dividend growth in recent years makes sense, given the company’s need to invest in the turnaround process.
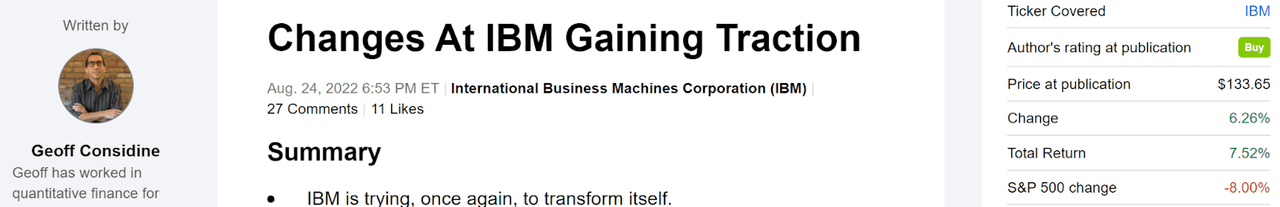
I last wrote about IBM on Aug. 24, 2022, almost exactly four months ago, and I upgraded the stock from a hold to a buy. The company had reported Q2 results on July 18, beating expectations on earnings and revenue. The prevailing view among Wall Street analysts was a mixed bag. ETrade calculated a Wall Street consensus buy rating, while Seeking Alpha had a Wall Street consensus hold rating. The average of the Wall Street consensus price targets from Seeking Alpha and ETrade corresponded to an expected total return of 14.5% over the next year. The market-implied outlook, a probabilistic price forecast that represents the consensus view from the options market, was bullish to the start and middle of 2023, with an expected volatility of about 25.5% (annualized). As a rule of thumb for a buy rating, I want to see an expected 12-month return that’s at least half of the expected volatility. Taking the Wall Street consensus price target at face value, IBM met this criterion. In the period since this post, IBM reported Q3 results, beating expectations on earnings and revenue, and IBM has returned a total of 7.5%, substantially outperforming the S&P 500.
Seeking Alpha
Previous post on IBM and subsequent performance vs. the S&P 500 (Source: Seeking Alpha)
For readers who are unfamiliar with the market-implied outlook, a brief explanation is needed. The price of an option on a stock reflects the market’s consensus estimate of the probability that the stock price will rise above (call option) or fall below (put option) a specific level (the option strike price) between now and when the option expires. By analyzing the prices of call and put options at a range of strike prices, all with the same expiration date, it’s possible to calculate the probable price forecast that reconciles the options prices. This is the market-implied outlook. For a deeper discussion than is provided here and in the previous link, I recommend this outstanding monograph published by the CFA Institute.
I have calculated updated market-implied outlooks for IBM and compared these with the current Wall Street consensus outlooks in revisiting my rating.
Wall Street Consensus Outlook For IBM
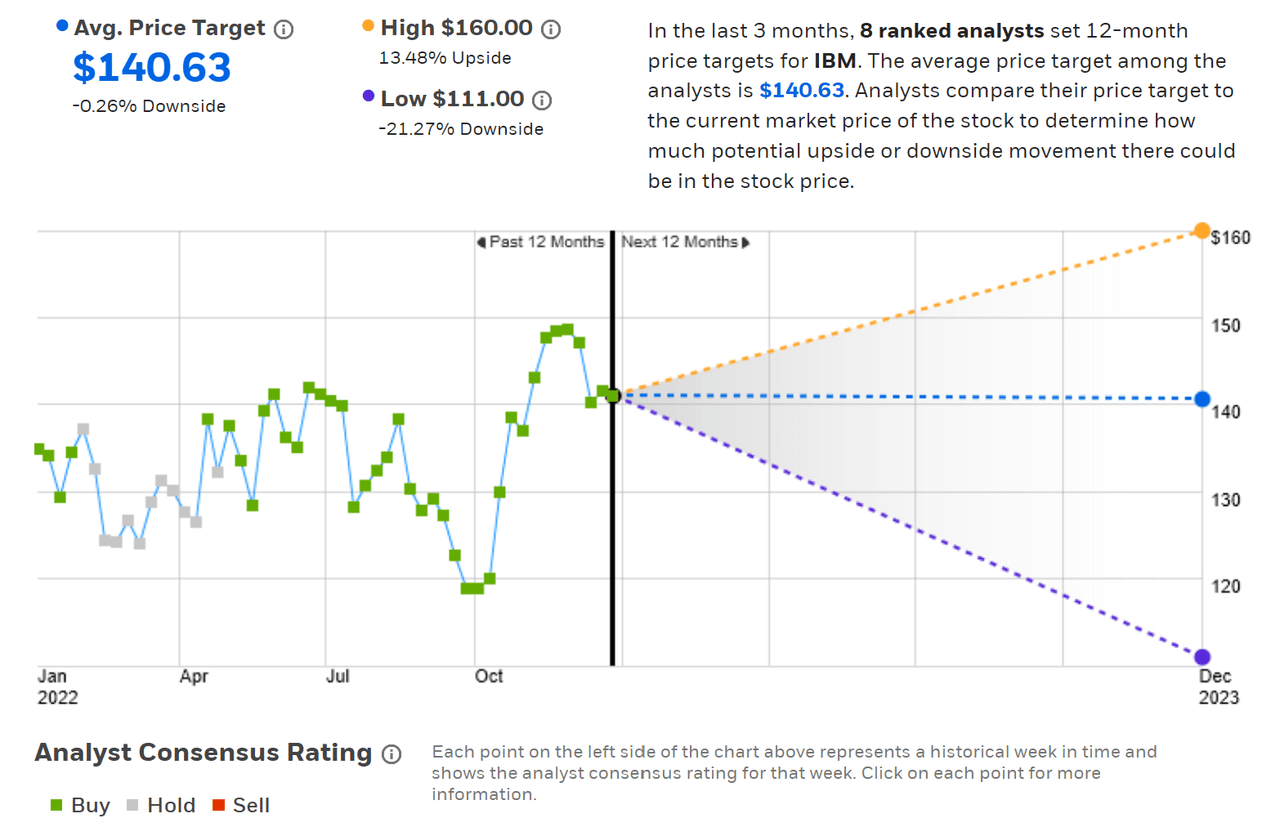
ETrade calculates the Wall Street consensus outlook for IBM using price targets and ratings from eight ranked analysts who have published opinions over the past three months. The consensus rating is a buy and the consensus 12-month price target is $140.63, 0.26% below the current share price. The consensus price target in August was $147.75. The combination of the rise in the share price and the drop in the consensus target result in almost no expected price appreciation over the next year.
ETrade
Wall Street analyst consensus rating and 12-month price target for IBM (Source: ETrade)
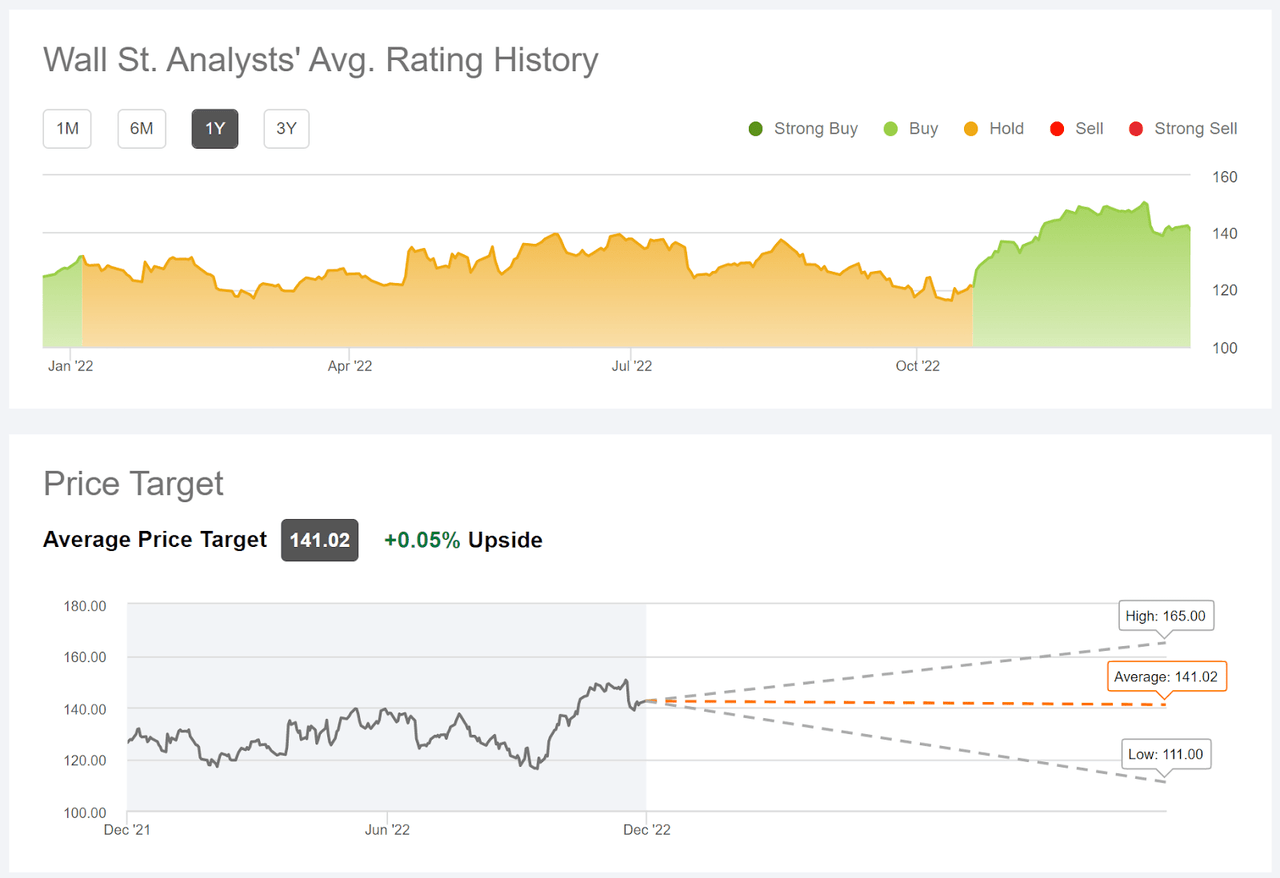
Seeking Alpha’s version of the Wall Street consensus outlook for IBM is calculated by aggregating the views of 16 analysts who have published ratings and price targets over the past 90 days. The consensus rating is a buy, having changed from a hold in October. The consensus 12-month price target is $141.02, almost identical to the current share price.
Seeking Alpha
Wall Street analyst consensus rating and 12-month price target for IBM (Source: Seeking Alpha)
The ETrade and Seeking Alpha calculations of the Wall Street consensus are very similar, with a buy rating and a consensus 12-month price target that’s equal to the current share price.
Market-Implied Outlook For IBM
I have calculated the market-implied outlook for IBM for the 5.6-month period from now until June 16, 2023 and for the 12.7-month period from now until Jan. 19, 2024, using the prices of call and put options that expire on these dates. I selected these specific expiration dates to provide a view to the middle of 2023 and for the full year.
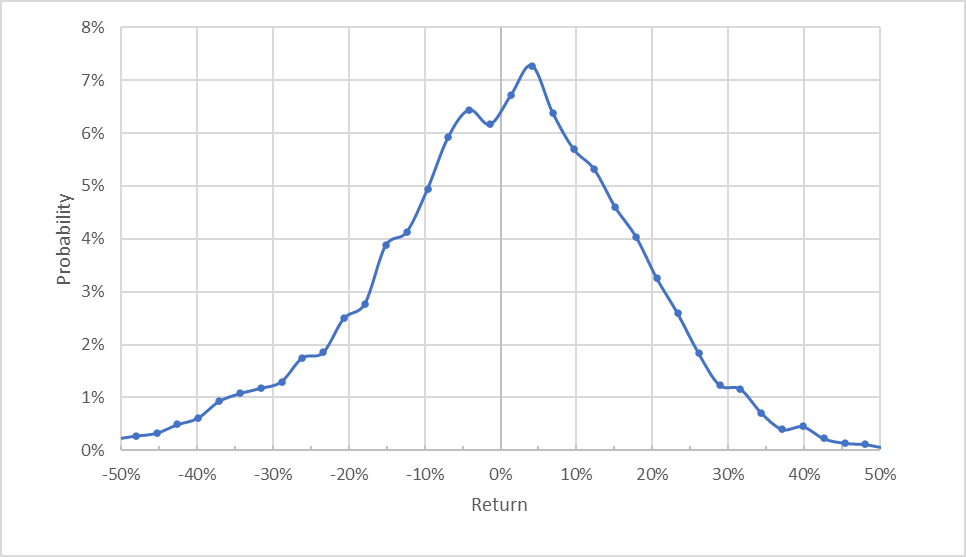
The standard presentation of the market-implied outlook is a probability distribution of price return, with probability on the vertical axis and return on the horizontal.
Geoff Considine
Market-implied price return probabilities for IBM for the 5.6-month period from now until June 16, 2023 (Source: Author’s calculations using options quotes from ETrade)
The outlook to the middle of 2023 is tilted to favor positive returns. The maximum probability corresponds to a price return of 4.1% over this period. The expected volatility calculated from this distribution is 26.7% (annualized).
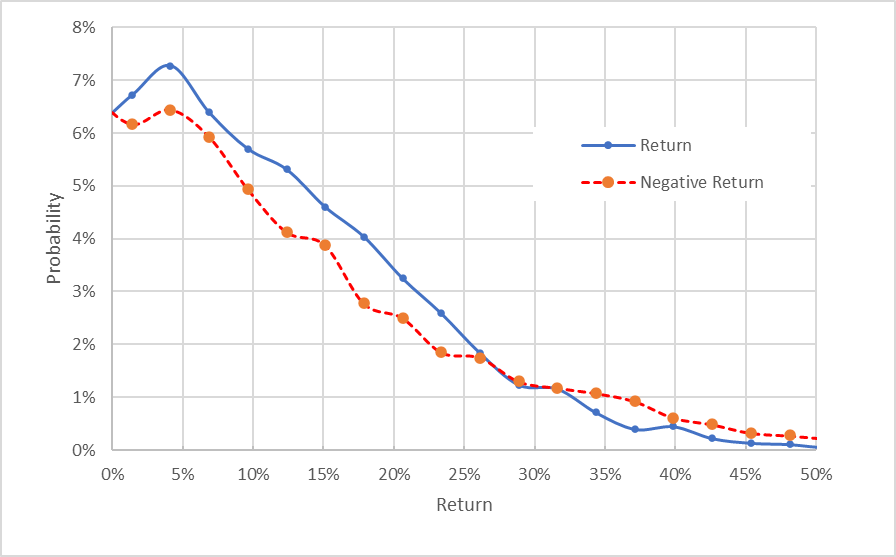
To make it easier to compare the relative probabilities of positive and negative returns, I rotate the negative return side of the distribution about the vertical axis (see chart below).
Geoff Considine
Market-implied price return probabilities for IBM for the 5.6-month period from now until June 16, 2023. The negative return side of the distribution has been rotated about the vertical axis (Source: Author’s calculations using options quotes from ETrade)
This view helps to see that the probabilities of positive returns are consistently higher than the probabilities of negative returns of the same size, across a wide range of the most-probable outcomes (the solid blue line is above the dashed red line over the left half of the chart above). The probabilities of extremely large negative returns are slightly elevated, but these outcomes are estimated to occur at low overall probability. This is a bullish outlook for IBM to the middle of 2023 and is very similar to the 4.9-month outlook from my previous analysis.
Theory indicates that the market-implied outlook is expected to have a negative bias because investors, in aggregate, are risk averse and thus tend to pay more than fair value for downside protection. There’s no way to measure the magnitude of this bias, or whether it’s even present, however. The expectation of a negative bias reinforces the bullish interpretation of this outlook.
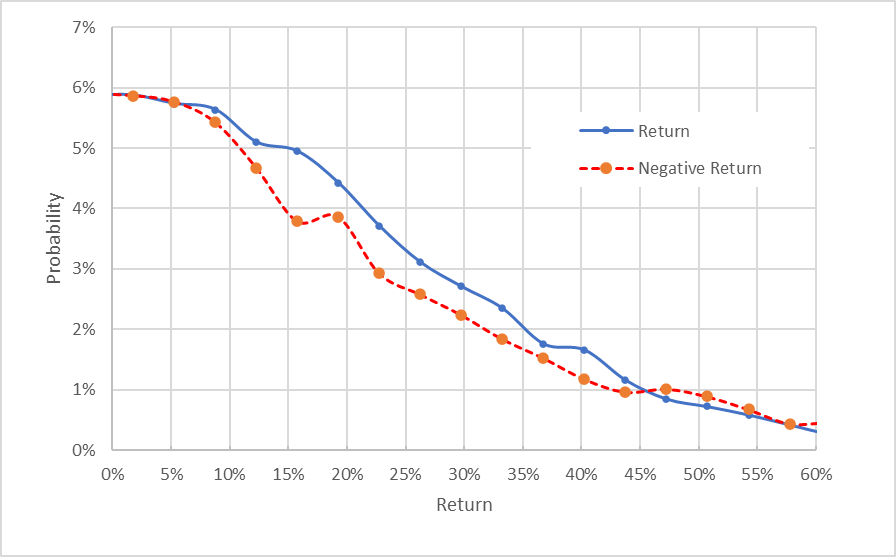
The market-implied outlook for the 12.7-month period from now until Jan. 19, 2024, also is bullish, with elevated probabilities of positive returns across the most-probable outcomes. The expected volatility calculated from this distribution is 26.3% (annualized).
Geoff Considine
Market-implied price return probabilities for IBM for the 12.7-month period from now until January 19, 2024. The negative return side of the distribution has been rotated about the vertical axis (Source: Author’s calculations using options quotes from ETrade)
The market-implied outlooks to the middle of 2023 and into January of 2024 are both bullish, with expected volatility of about 26.5%. The consistency of these outlooks with those from August is notable.
Summary
Shareholders have benefited from IBM’s progress in focusing on high-growth technologies, while continuing to strengthen the consulting side of the firm. The shares also have been boosted by the broad rotation from growth to value stocks, as a result of rising interest rates. The potential for a global macroeconomic slowdown in 2023 is a concern. While the Wall Street consensus rating is a buy, the consensus 12-month price target is almost identical to the current share price. This situation suggests that the prevailing Wall Street view is generally favorable, but that the shares are fully priced after the market-beating gains of 2022. The market-implied outlook for IBM is bullish to the middle of 2023 and into the start of 2024, with moderate expected volatility. The market-implied outlook suggests a meaningful probability of further gains in 2023. Even though the Wall Street consensus is for no upside over the next year, the firm’s solid earnings and revenue growth in the midst of the turnaround, combined with good fundamentals and the bullish market-implied outlooks leads me to maintain my buy rating.
Be the first to comment