

gorodenkoff
There are two main drivers of life expectancy and population growth on planet earth since the 1800s: increasing food production and advances in medical treatment. Without significant growth in both, global population would still be under 1 billion people, not the 8 billion number of today. And, if the world wants to live longer, with a better quality of life during those years, medical inventions like new prescription drugs will lead the way.
OurWorldinData.com – Global Population Growth, Past 12,000 Years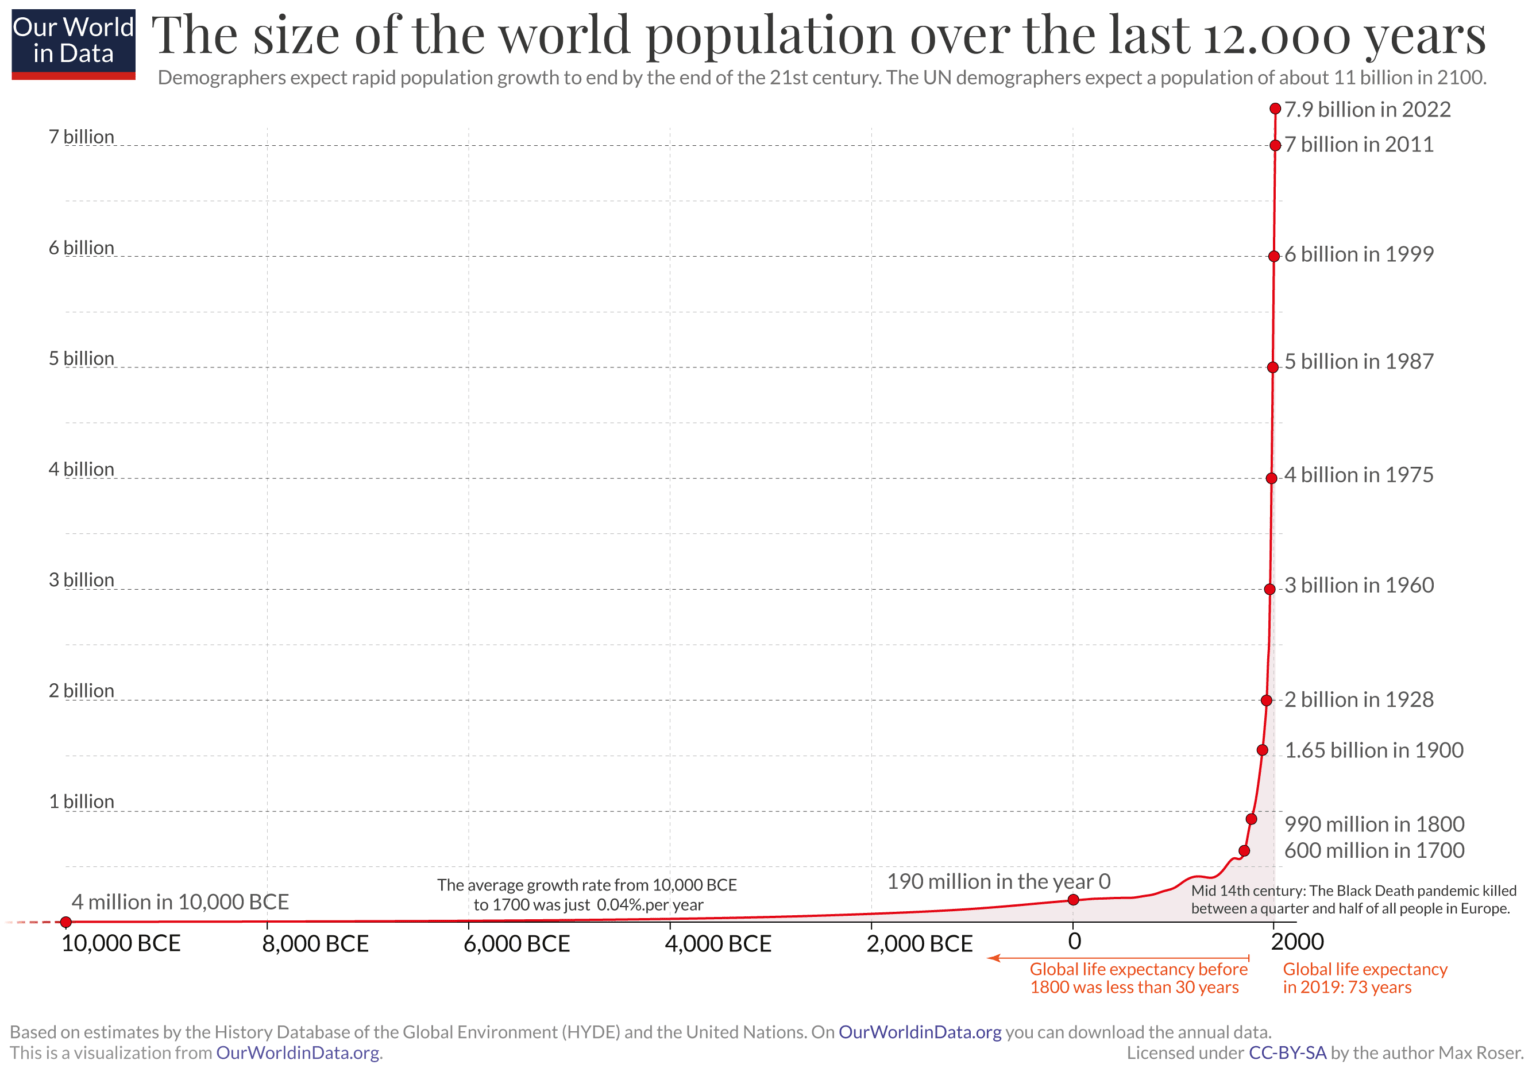
Believe it or not, companies operating in the field of pharmaceutical research & development often stand tallest during recessions in America and bear markets on Wall Street, because drug sales are fairly recession-proof, while the long-term research to improve our lives may be the least dependent on market/economic cycles and investor sentiment swings.
In this vein, I have been recommending more biotech and Big Pharma names the last couple of months. To be honest, I own many more in the health care sector than I have written about, and dig deeper into 5 or 10 new ideas daily. Another basic way to add exposure to the drug development industry is through the iShares Biotechnology ETF (NASDAQ:IBB). Started in early 2001, this diversified product focused on biotechnology inventions has an excellent track record of “outperforming” the S&P 500 index during recessions in particular. So, since I am worried about a 2023 economic downturn, why not add some related drug discovery/manufacturing shares and ETFs to your portfolio?
Screenshot: iShares Biotechnology ETF Webpage, January 10th, 2023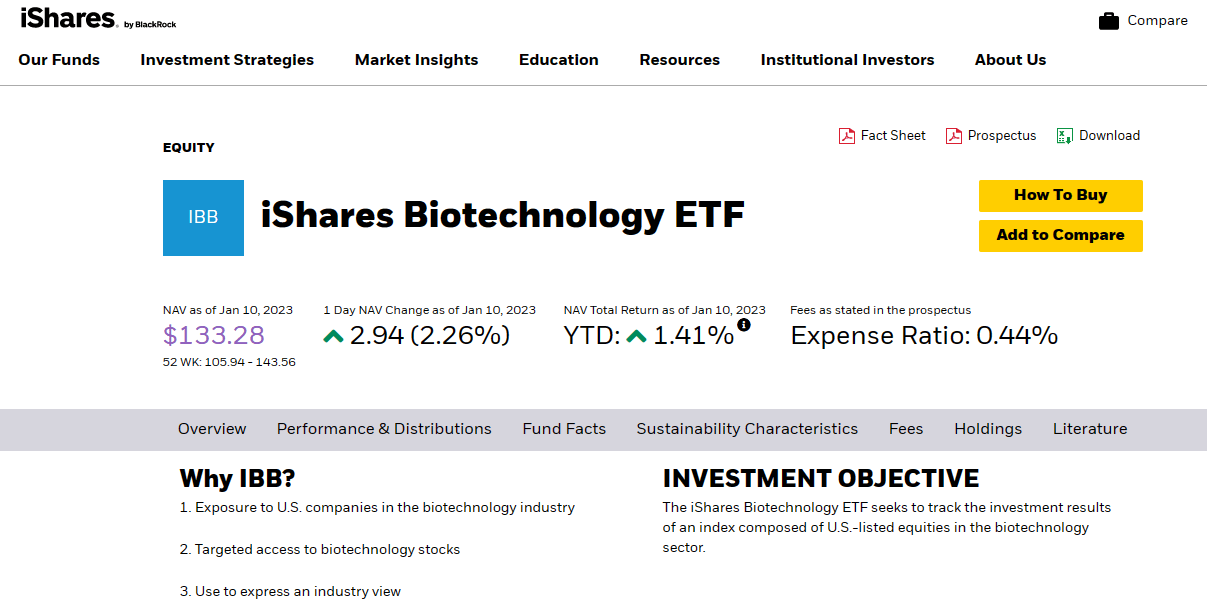
Positive Recession Performance
The main attraction for me is IBB has a stellar history of outperformance of the S&P 500 during recessions. And, the biotech industry has again begun to deliver better returns than the overall U.S. equity market since September. Below is a trailing 1-year graph of total returns, including dividends from IBB vs. the popular SPDR S&P 500 ETF (SPY).
YCharts – iShares Biotechnology vs. SPDR S&P 500 ETFs, Total Returns, 1 Year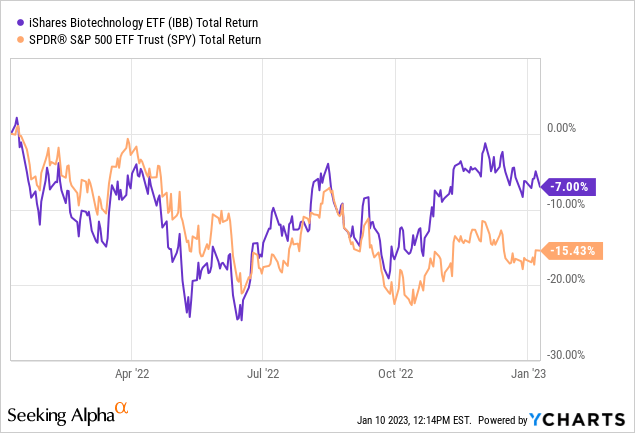
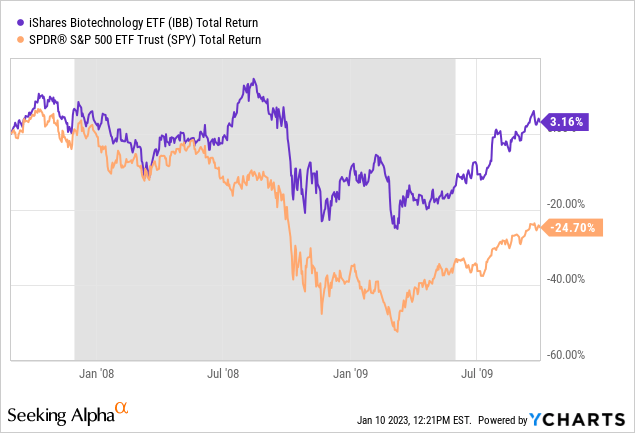
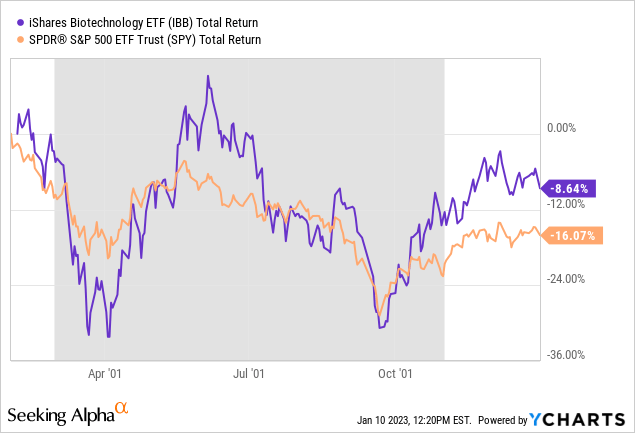
The trading history of iShares Biotechnology during recessions since inception is drawn below. The 2020 Pandemic Recession, 2008-09 Great Recession, and Dotcom Bust of 2001 are pictured. In each instance, IBB outperformed during the actual contraction in real GDP, and continued to hold its lead or build upon it for months thereafter.
YCharts – iShares Biotechnology vs. SPDR S&P 500 ETFs, Total Returns, January to July 2020 YCharts – iShares Biotechnology vs. SPDR S&P 500 ETFs, Total Returns, Sept 2007 to Sept 2009 YCharts – iShares Biotechnology vs. SPDR S&P 500 ETFs, Total Returns, 2001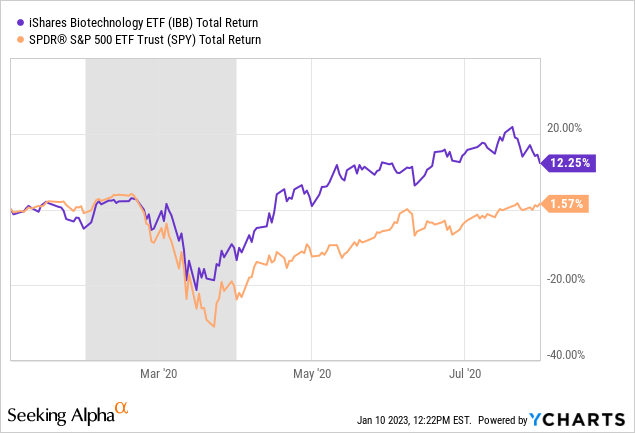
Top Holdings
The Top 10 holdings for position size in the ETF, representing about 52% of invested capital, are Gilead Sciences (GILD), Amgen (AMGN), Regeneron Pharmaceuticals (RGEN), Vertex Pharmaceuticals (VRTX), Moderna (MRNA), Biogen (BIIB), IQVIA Holdings (IQV), Mettler-Toledo (MTD), Illumina (ILMN), and Alnylam Pharmaceuticals (ALNY).
Effectively, the heaviest-weighted names were also the largest gainers in 2022, as the underlying index is based on market capitalizations (as one factor). Gilead, Amgen, Regeneron and Vertex now account for roughly 30% of IBB’s value.
Seeking Alpha Table – iShares Biotechnology ETF, Top 10 Holdings, January 6th, 2023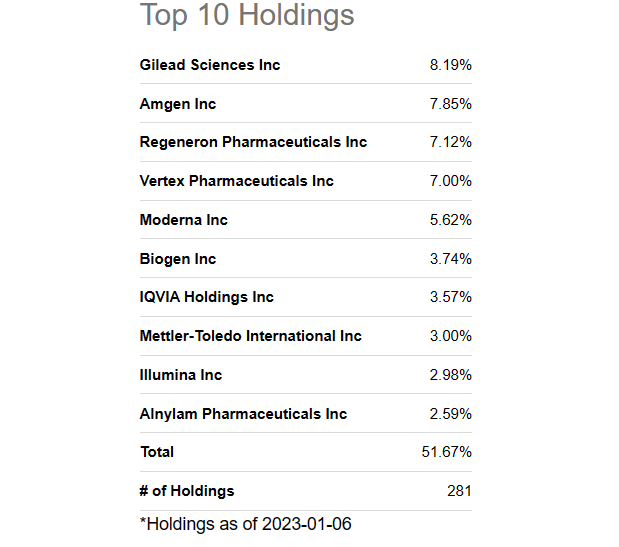
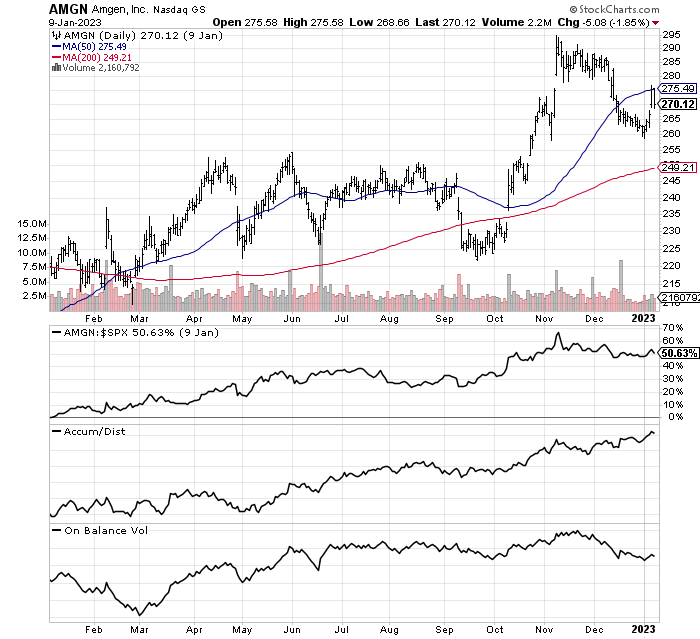
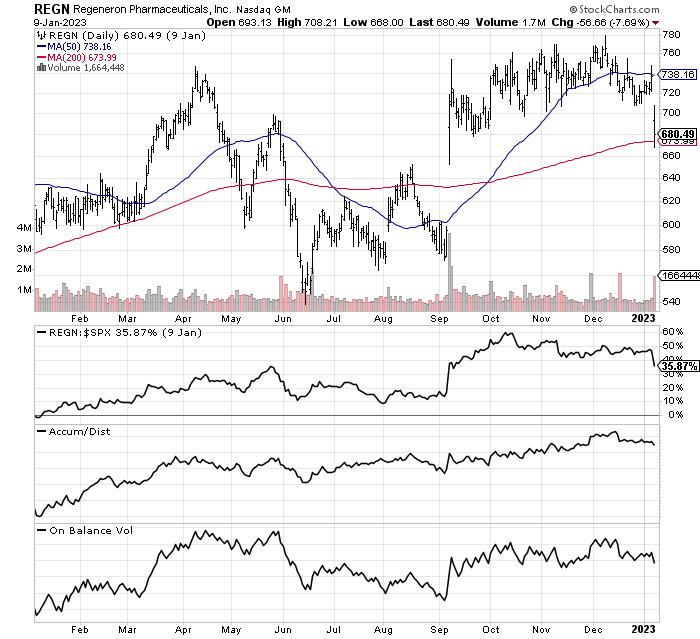
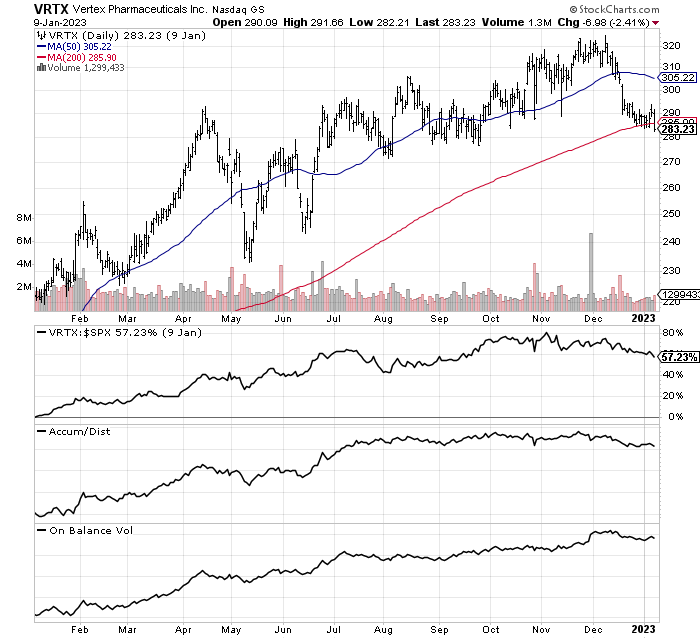
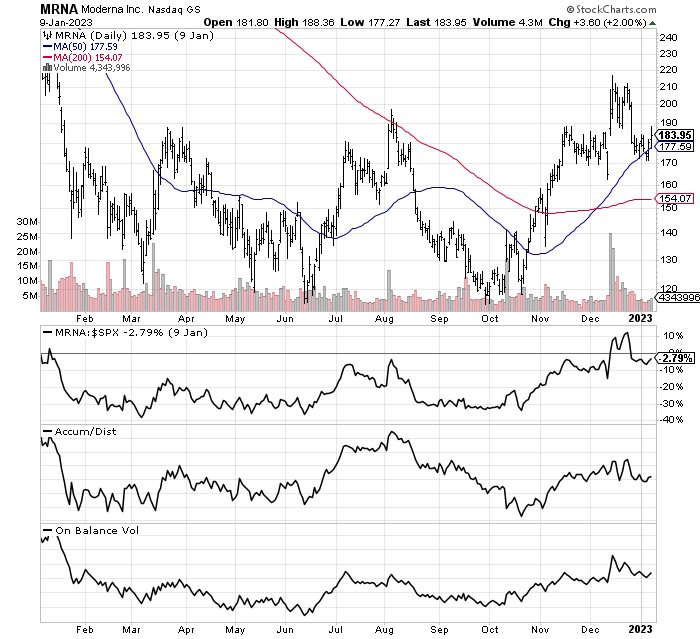
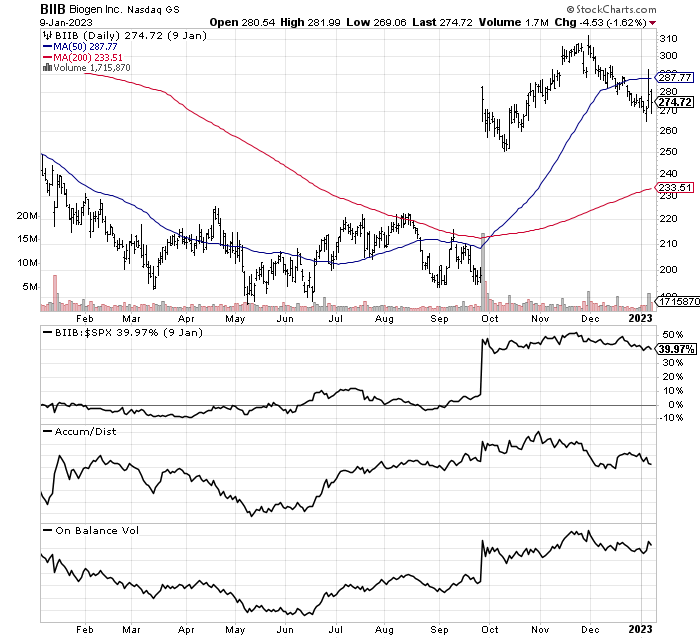
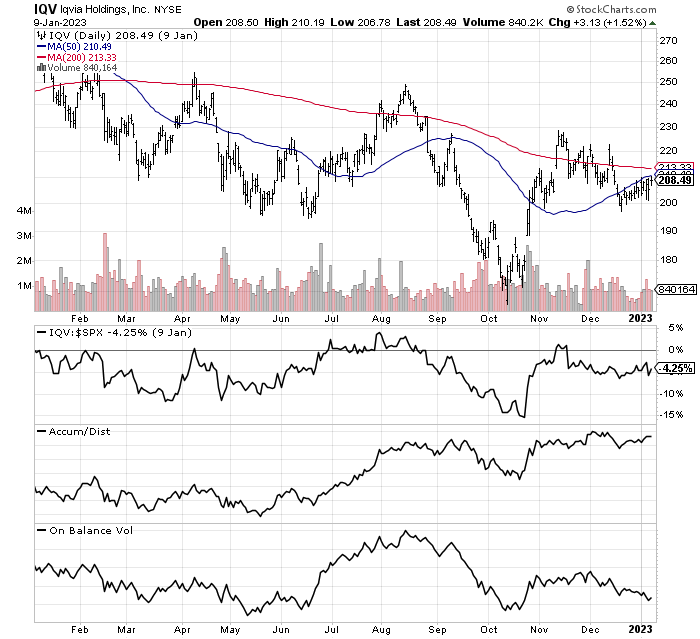
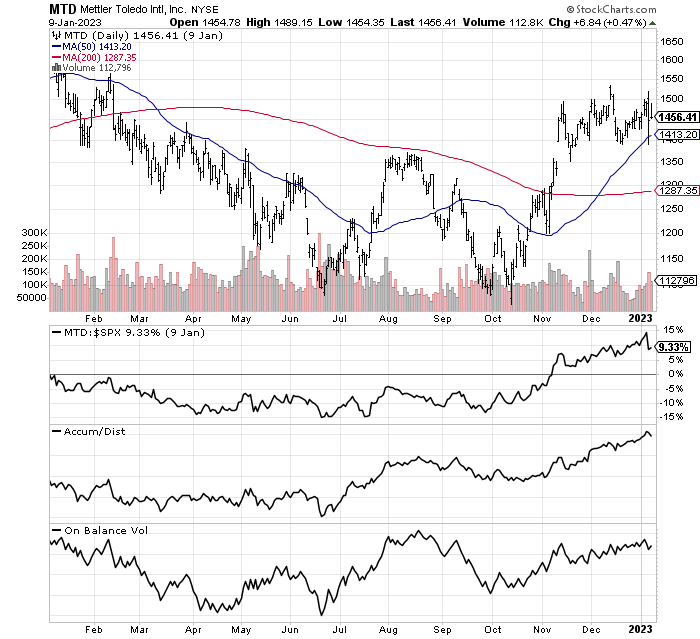
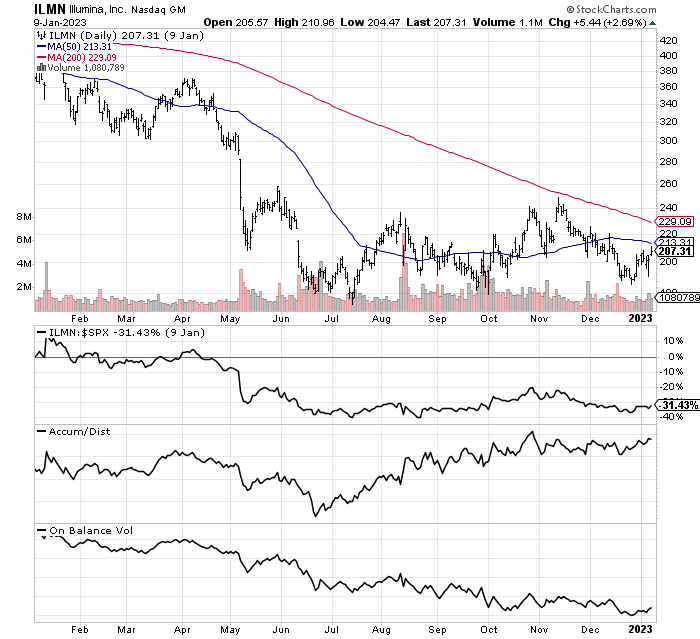
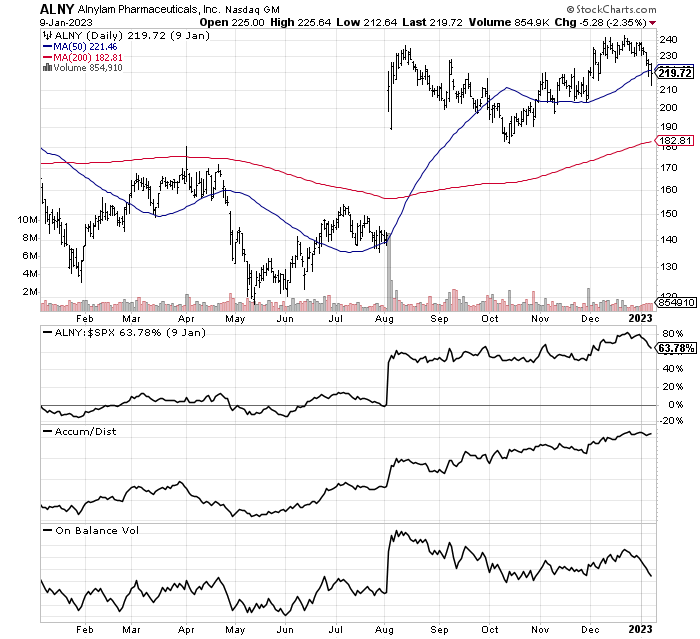
Below are 1-year graphs of daily trading activity in iShares Biotechnology, plus each of the Top 10 holdings. I have also plotted relative price strength vs. the S&P 500 index, plus movements in the Accumulation/Distribution Index and On Balance Volume. You can review for yourself the interplay between the momentum indicators for each stock.
iShares Biotechnology ETF
StockCharts.com – IBB, 12 Months of Daily Price & Volume Changes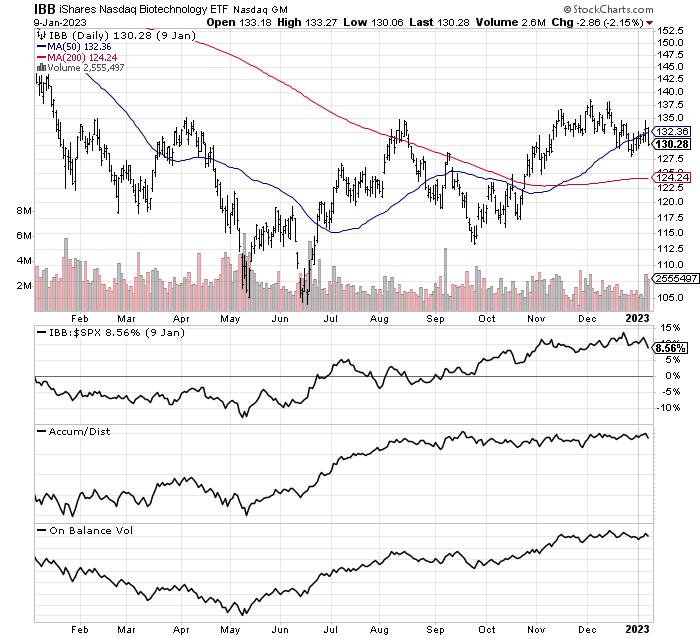
Top 10 Holdings
Of particular note, 7 out of 10 of the largest holdings have witnessed strong concurrent momentum trends since September in relative price strength vs. the market, plus the ADL and OBV lines. In addition, 6 out of 10 have experienced a rising trend in these three indicators over the last year of trading. It is getting incredibly difficult to find an industry-focused ETF with a similar positive momentum setup in its major holdings (measured over both 3-months and 12-months), after a prolonged bear market drop.
StockCharts.com – GILD, 12 Months of Daily Price & Volume Changes StockCharts.com – AMGN, 12 Months of Daily Price & Volume Changes StockCharts.com – REGN, 12 Months of Daily Price & Volume Changes StockCharts.com – VRTX, 12 Months of Daily Price & Volume Changes StockCharts.com – MRNA, 12 Months of Daily Price & Volume Changes StockCharts.com – BIIB, 12 Months of Daily Price & Volume Changes StockCharts.com – IQV, 12 Months of Daily Price & Volume Changes StockCharts.com – MTD, 12 Months of Daily Price & Volume Changes StockCharts.com – ILMN, 12 Months of Daily Price & Volume Changes StockCharts.com – ALNY, 12 Months of Daily Price & Volume Changes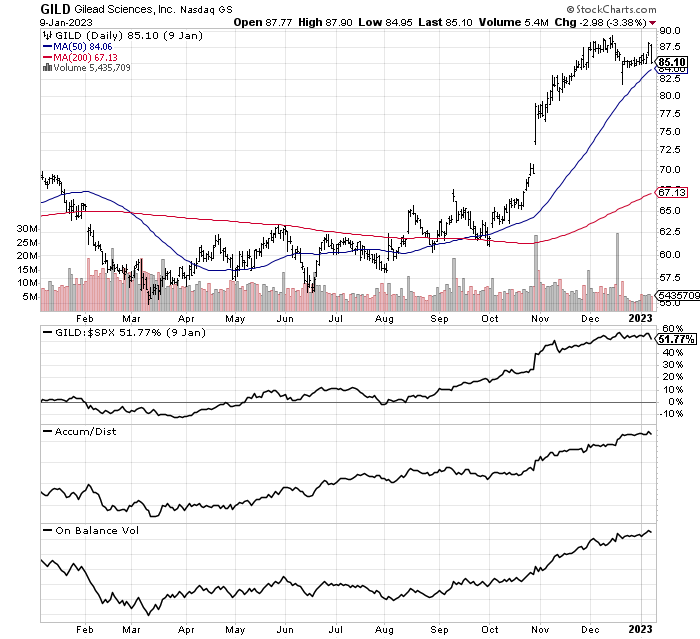
Final Thoughts
For retail investors wanting quick exposure to leading healthcare and medical development assets, iShares Biotechnology is a great choice to consider. The primary reason to seriously contemplate ownership today is biotech and pharma concerns regularly outperform during recessions.
What are the risks? The good news is this ETF is a diversified product, which reduces implied and actual risk of steep losses, especially if you hold it a few years. Outside of a stock market crash (as Wall Street remains well above average for total equity market worth on U.S. GDP output), the next biggest downside hurdle may not appear for a couple of years. In 2022, Congress and the President finally approved a price “negotiation” process for federal government Medicare payments on prescription drugs, which was first debated in 1993 when President Clinton entered office.
The current push for drug price fixing was contained in the Inflation Reduction Act of 2022. If there is any good news, negotiations and implementation will be done in phases. The pricing schedules will not begin until 2026, on 10 yet to be selected drugs out of the top 100 sellers. All 100 will not become eligible until 2030 under current law (adding 10-20 more pharmaceuticals each year).
Undoubtedly, drug manufacturers and developers will see lower profits than otherwise from the Medicare negotiation plan, but I do not foresee a real effect on industry shareholders until 2025 regarding how Wall Street values lower-growth business models. Remember, high drug prices are often referred to as a “necessary evil” to give profit incentives for research & development. The creation of new pharma inventions has been a hallmark of our modern economy for many decades, while supporting better lives for all of us. One undeniable drawback of government price-fixing is the rate of discovery for exciting and beneficial medical therapies may fall dramatically by 2030.
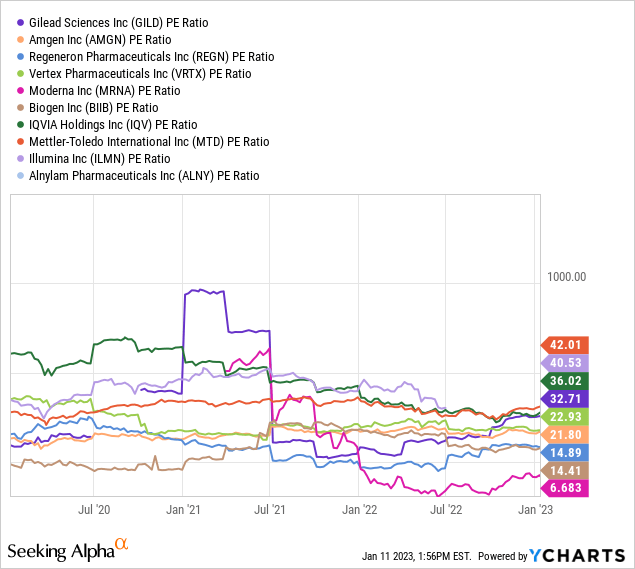
What’s the upside potential in IBB? The Top 10 biotech firms sport a 1-year forward P/E around 17x for a median average. This number is not particularly high vs. trading the last several decades. Measured against the trailing P/E of 22x for a median average in early 2023, or general U.S. market averages projected in the 15x to 20x P/E range for this year (depending on analyst and industry surveyed), the usual biotech growth-based “premium” valuation is nonexistent today. If inflation and interest rates decline with a recession, while investor demand for safety-minded investments grows, +20% to +30% in potential upside may be approaching this year in IBB.
YCharts – IBB Top 10, Price to Forward Estimated Earnings, 12 Months YCharts – IBB Top 10, Price to Trailing Earnings, 3 Years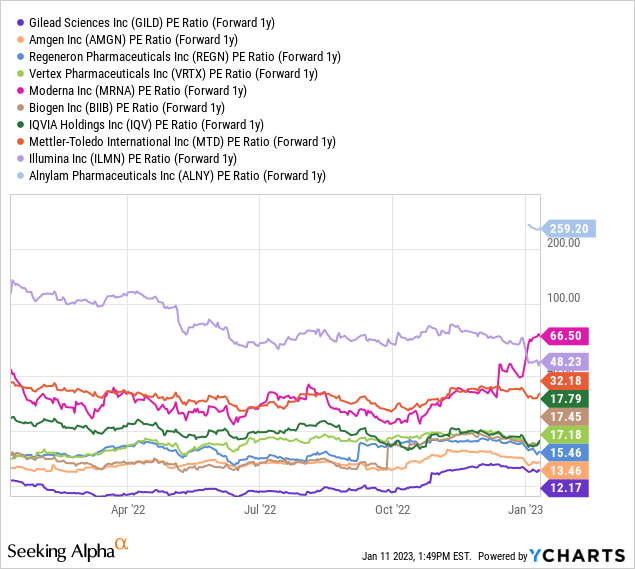
In summary, I am modeling a worst-case scenario of -20% in losses vs. best-case upside of +30% for a 12-month total return in IBB. I would not call this risk/reward setup a roaring buy situation, but a solid pick in a recessionary, still overvalued Wall Street environment.
Thanks for reading. Please consider this article a first step in your due diligence process. Consulting with a registered and experienced investment advisor is recommended before making any trade.
Be the first to comment