

The sailfish can reach 68 miles per hour and looks like a swordfish with a Mohawk. They love high dividend yields and big discounts to book value. That last part probably wasn’t true, but who can tell? Luis Beristain/iStock via Getty Images
Get ready for charts, images, and tables because they are better than words. The ratings and outlooks we highlight here come after Scott Kennedy’s weekly updates in the REIT Forum. Your continued feedback is greatly appreciated, so please leave a comment with suggestions.
We’re running through these picks faster than a sailfish chasing a squid. Not familiar with the sailfish? Search it later. No time to explain.
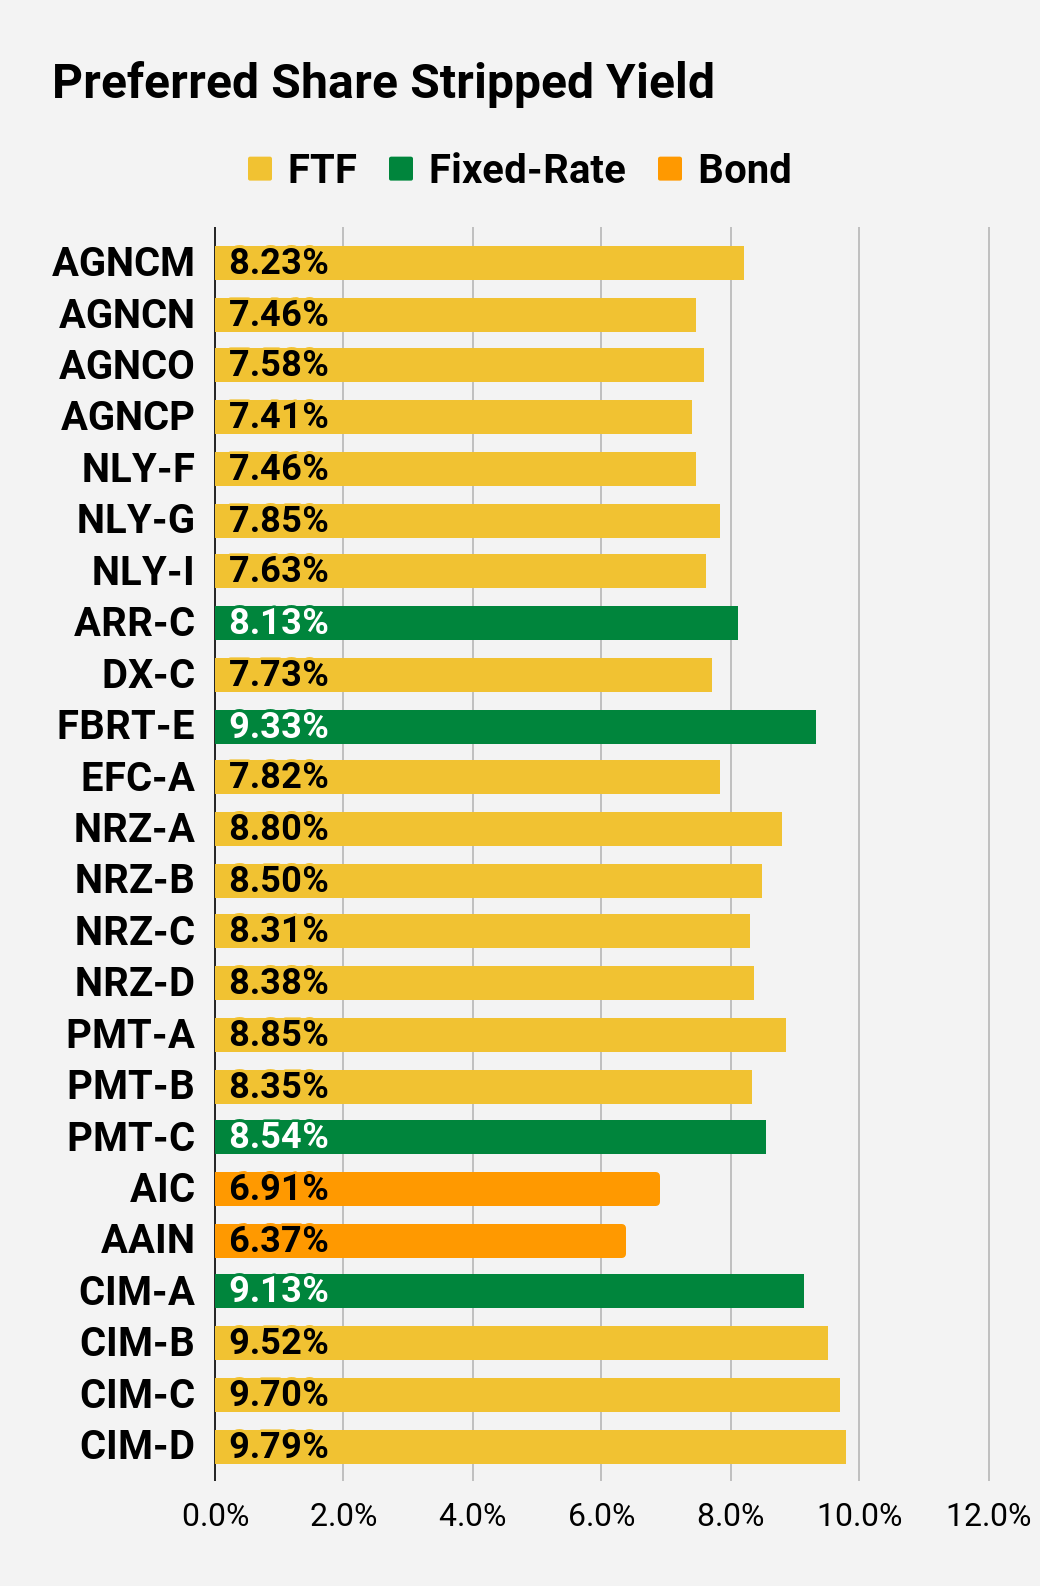
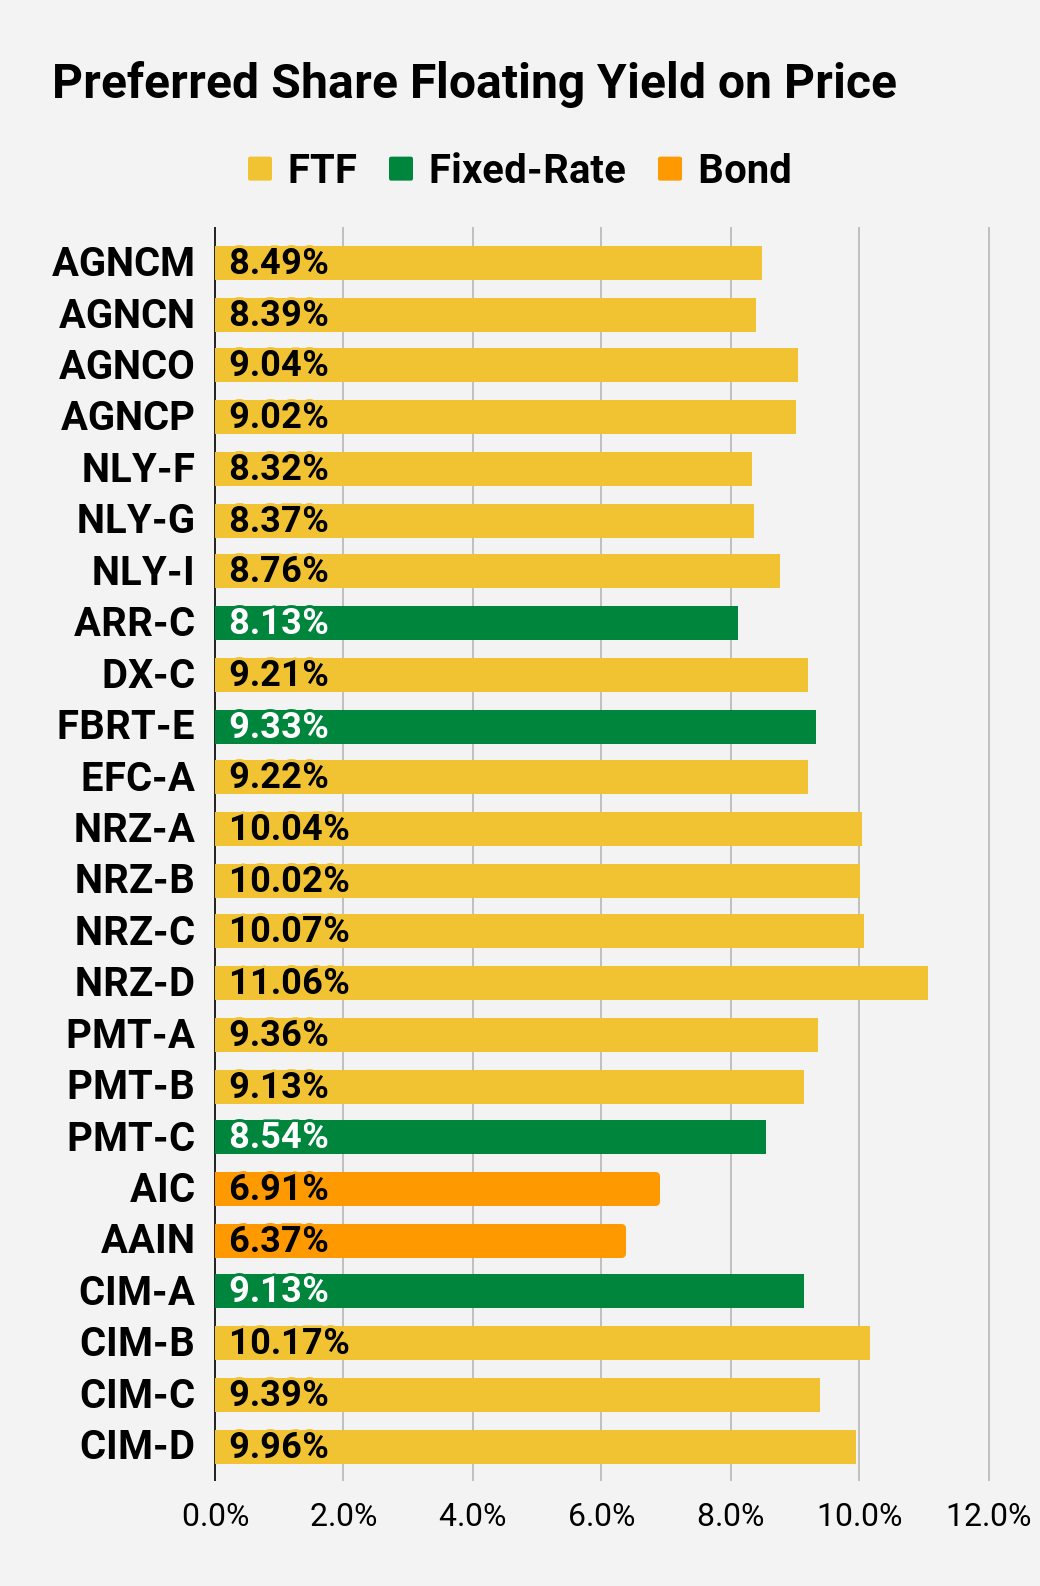
My first batch of picks is the preferred shares from New Residential (NRZ). I’m picking all 4 of them. They each trade well inside our strong buy range. Here are the stats:
The REIT Forum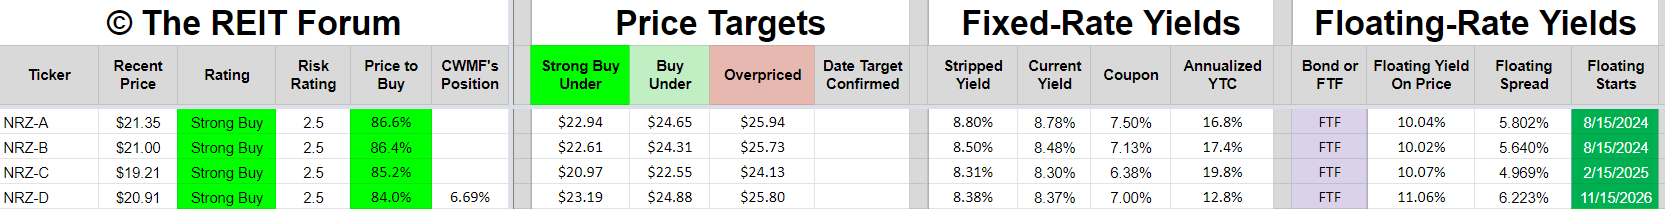
Discounts to our target values are pretty similar, suggesting the market is at least getting a good grasp on relative values. While the relative values look reasonable, the floating yields on price are exceptional. The first 3 would each be slightly over 10%. The final one is over 11%. That’s massive. You’ve gotta wait until the floating rate kicks in, but so be it. The stripped yields are nothing to sneeze at and the shares have a substantial discount to face value. That’s too many words already, get onto the next share!
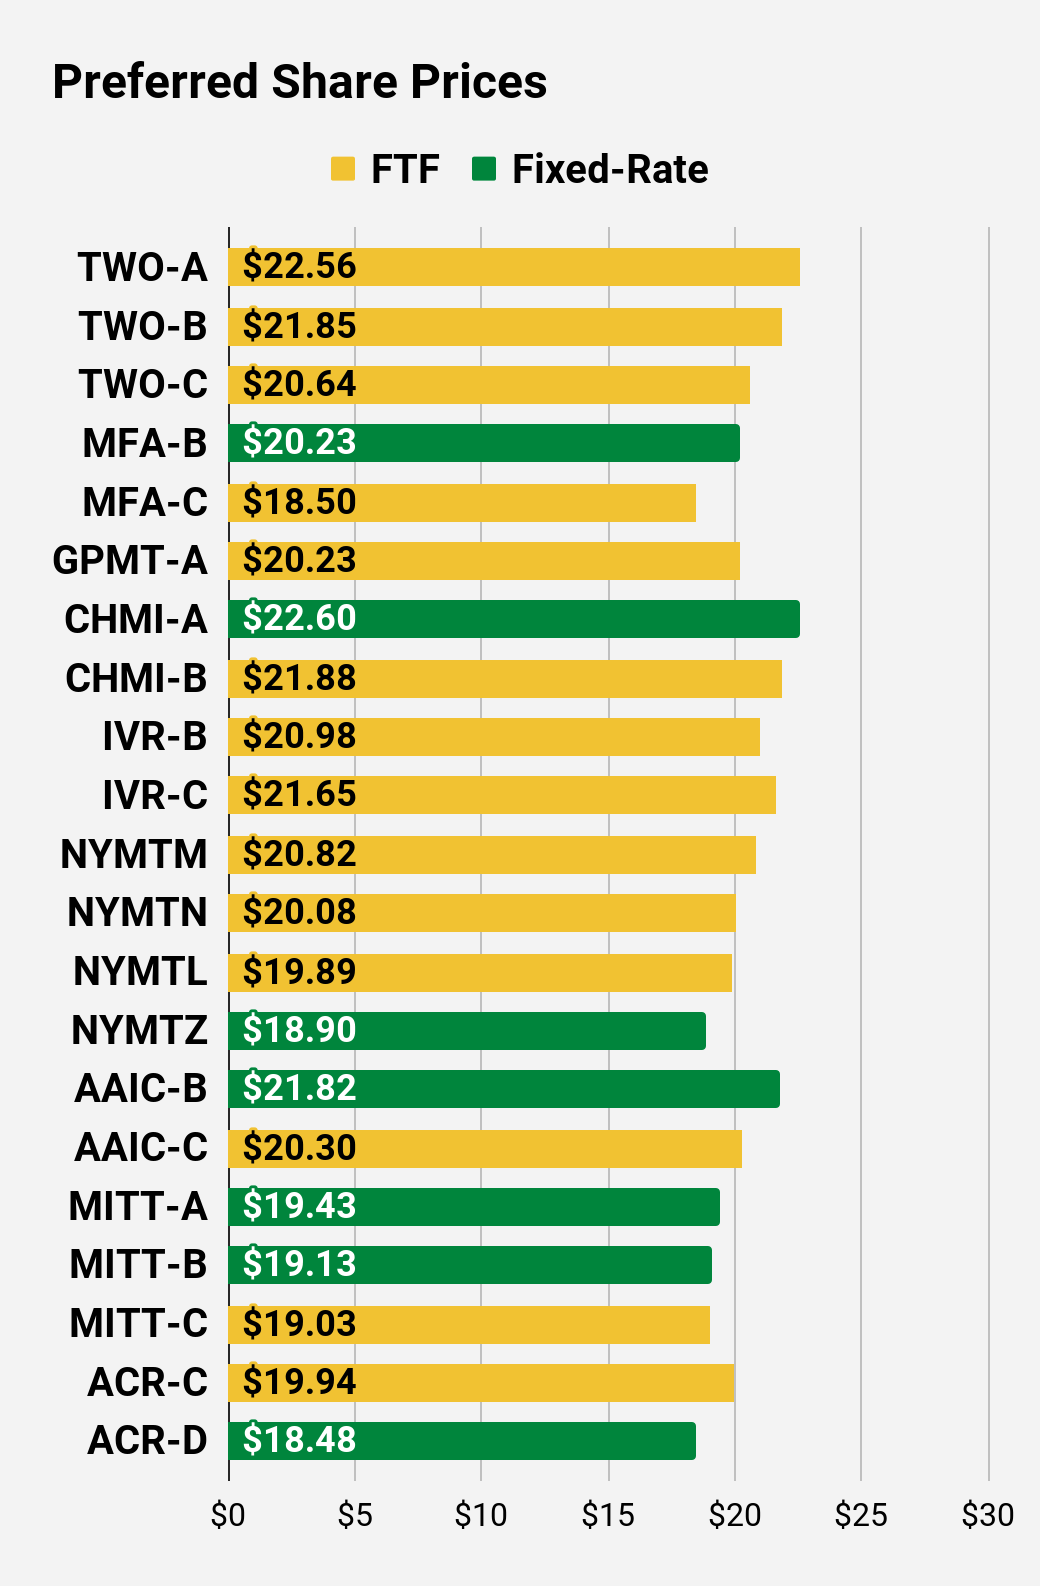
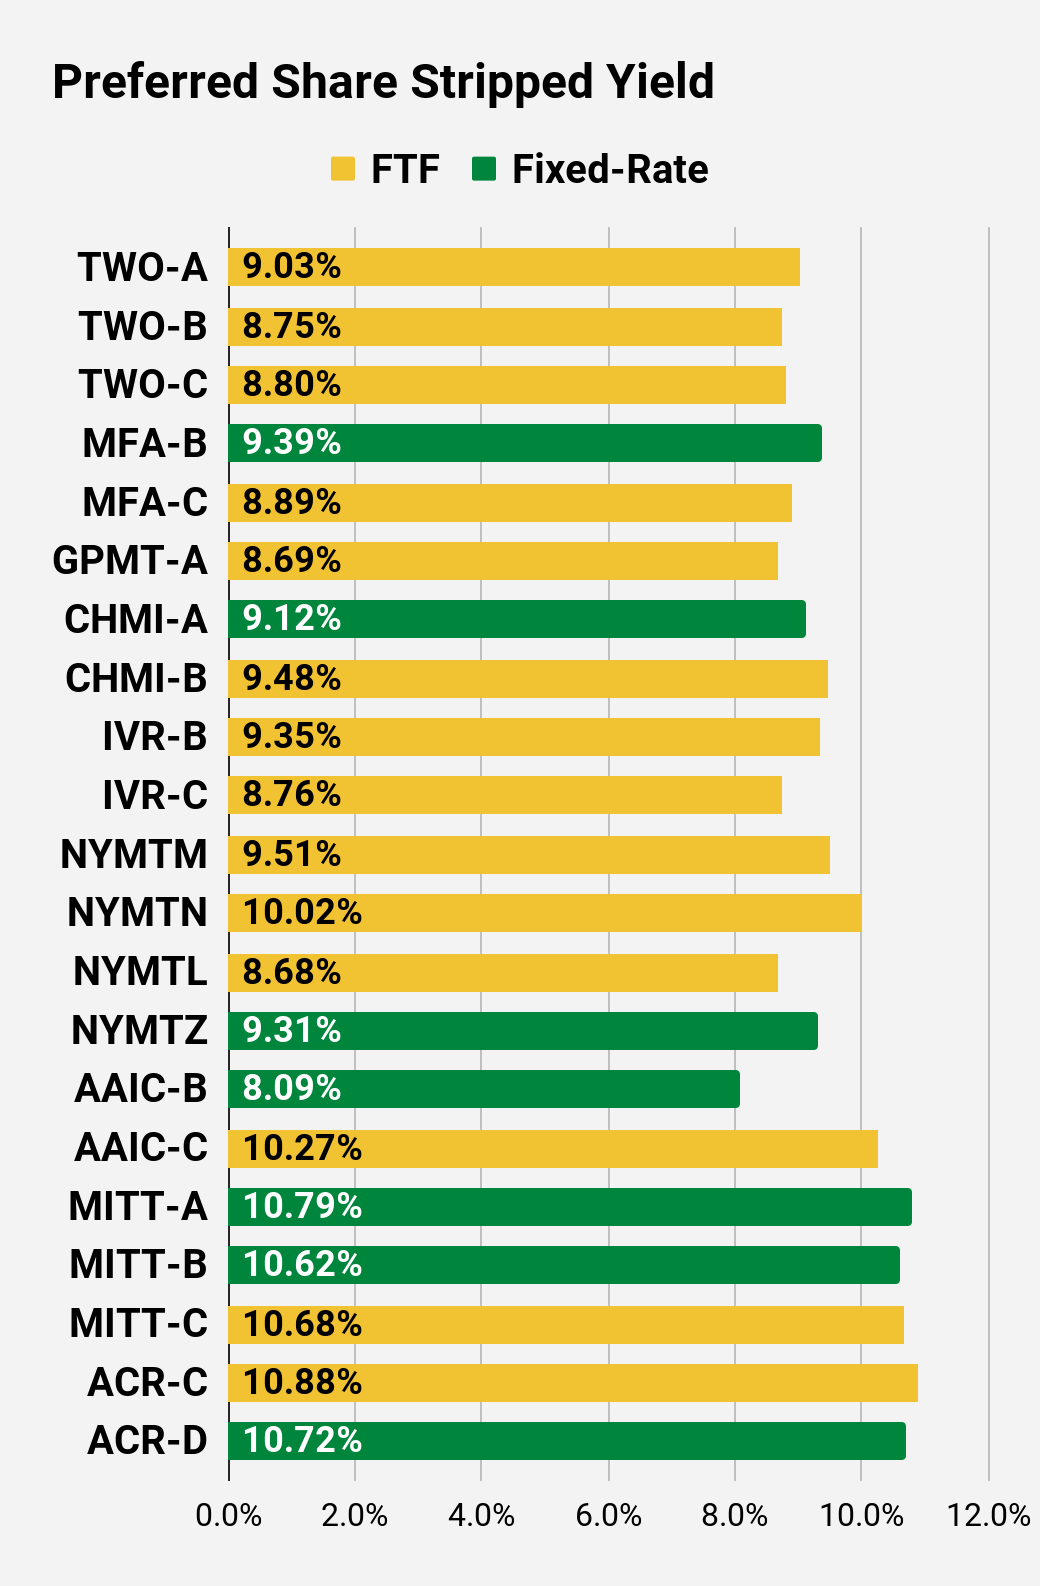
Now we’re moving to the preferred shares from MFA Financial (MFA). Both are great deals, but I’m giving MFA-C (MFA.PC) the edge over MFA-B (MFA.PB) due to the combination of a future floating rate and the massive discount to call value:
The REIT Forum
With shares of MFA-C at only $18.50, the investor is locking in a huge yield. It’s nearly 8.9% today and if short-term rates remain at the current level (not even the level markets are forecasting a few years out), it would push that yield to over 11%. That’s a big yield. Think MFA is going out of business? The financial crisis during the pandemic was dramatically worse and MFA still has a good ratio of common equity to preferred equity.
Next pick!
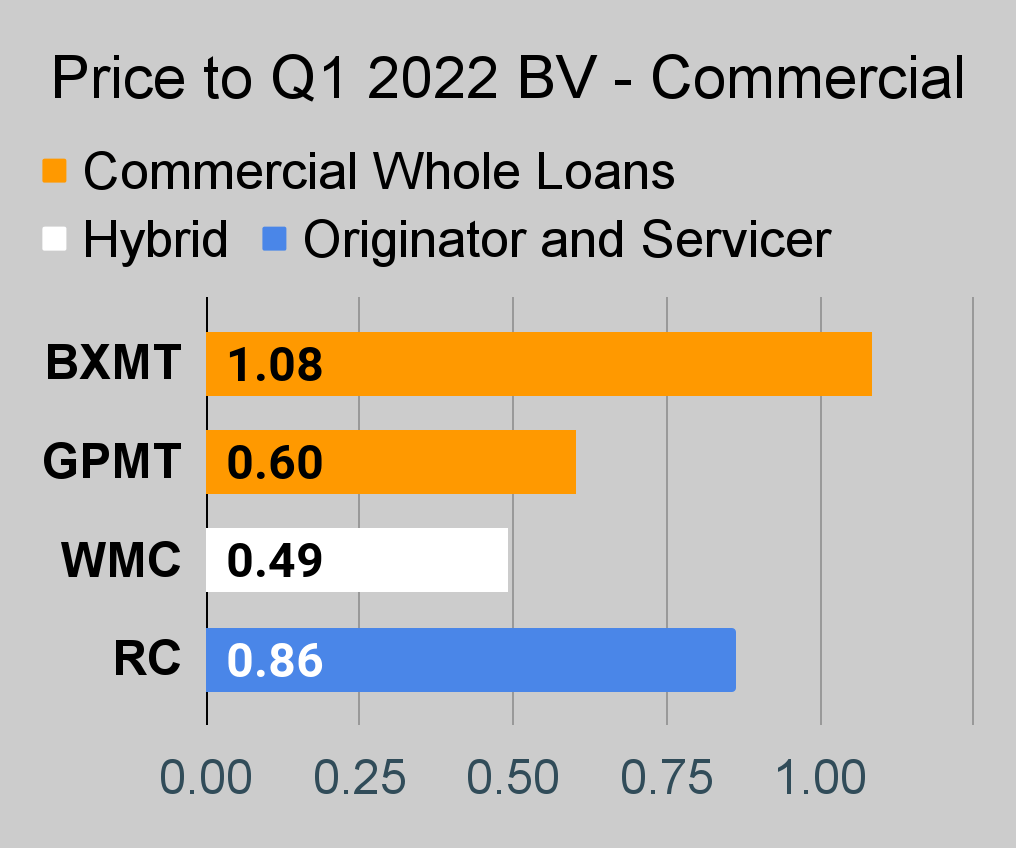
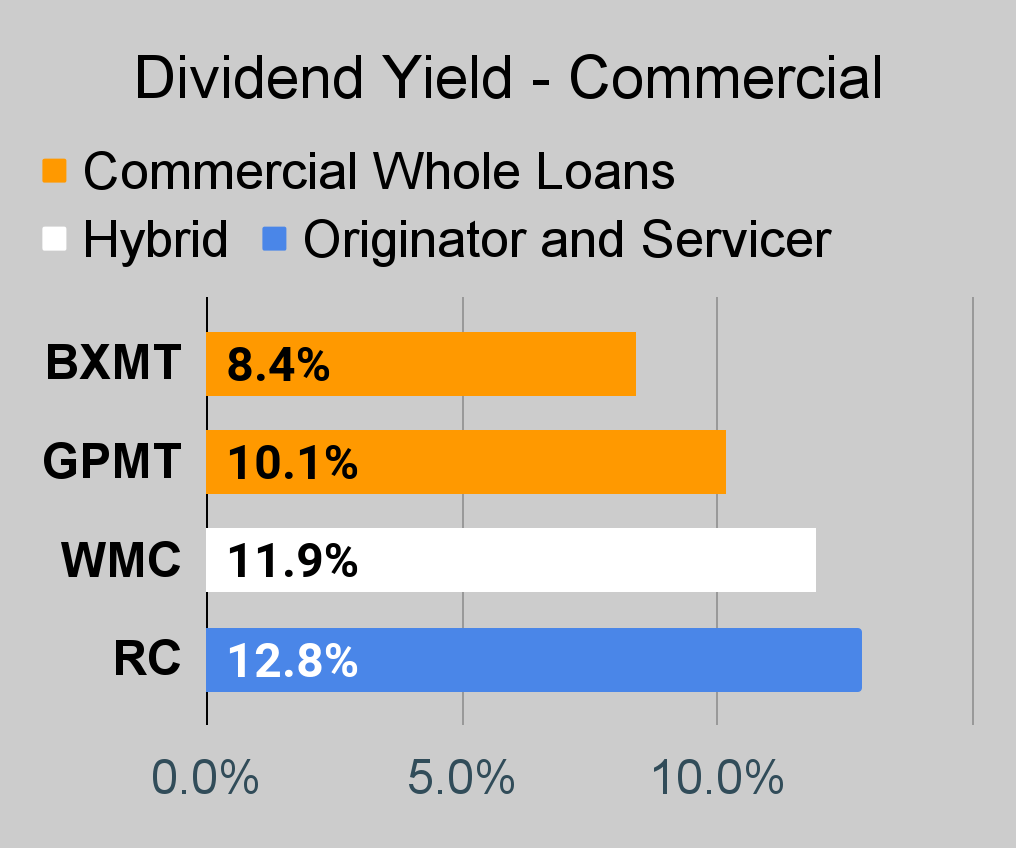
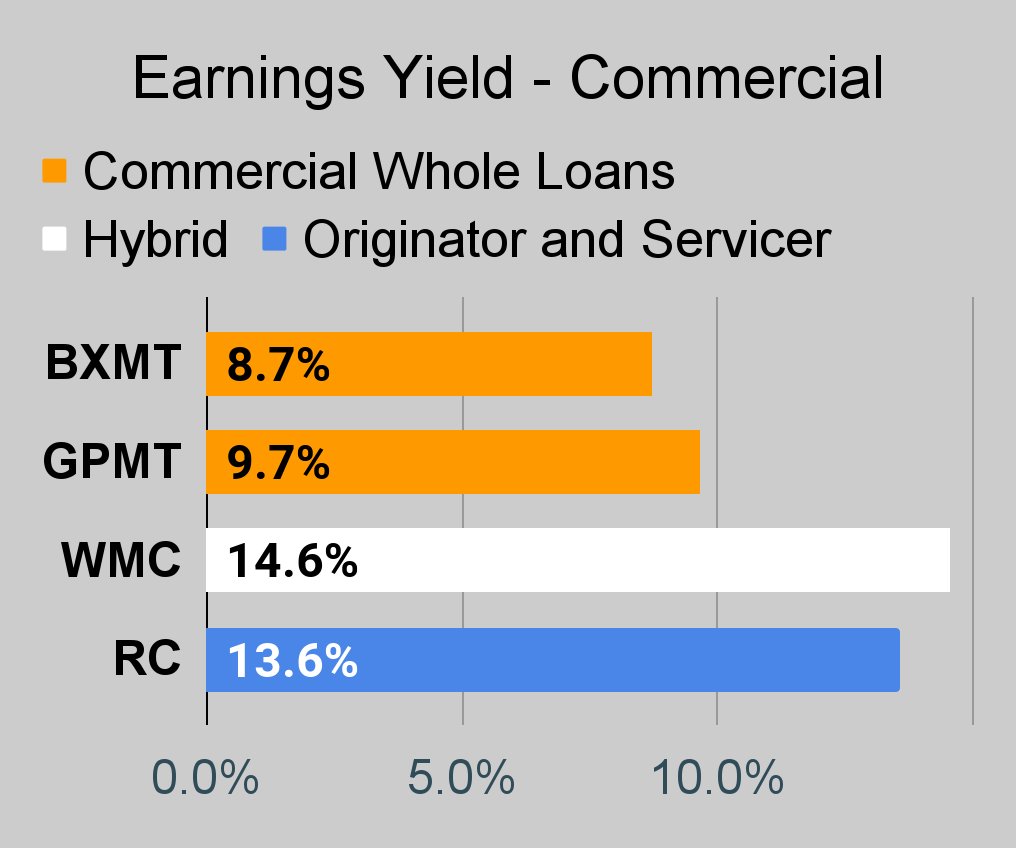
Ready Capital (RC) climbs into the ring! Shares offer a big dividend yield at 12.8% and trade at a 10% discount to book value using our estimate for book value as of last Friday:
The REIT Forum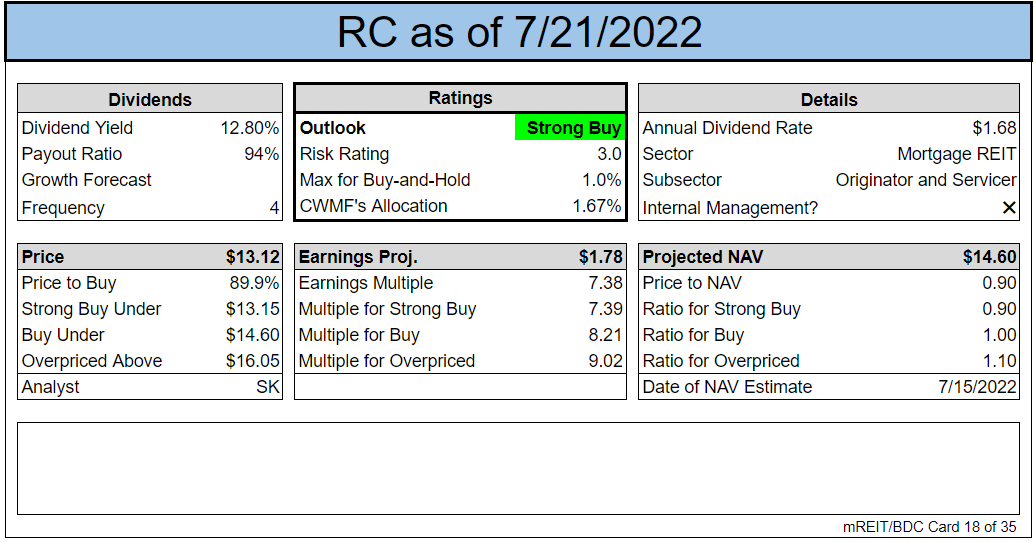
Ready Capital is a bit of an unusual mortgage REIT. Their assets are far more diversified. That could be good or bad, but I appreciate that the substantial majority of their leverage is non-recourse.
Ready Capital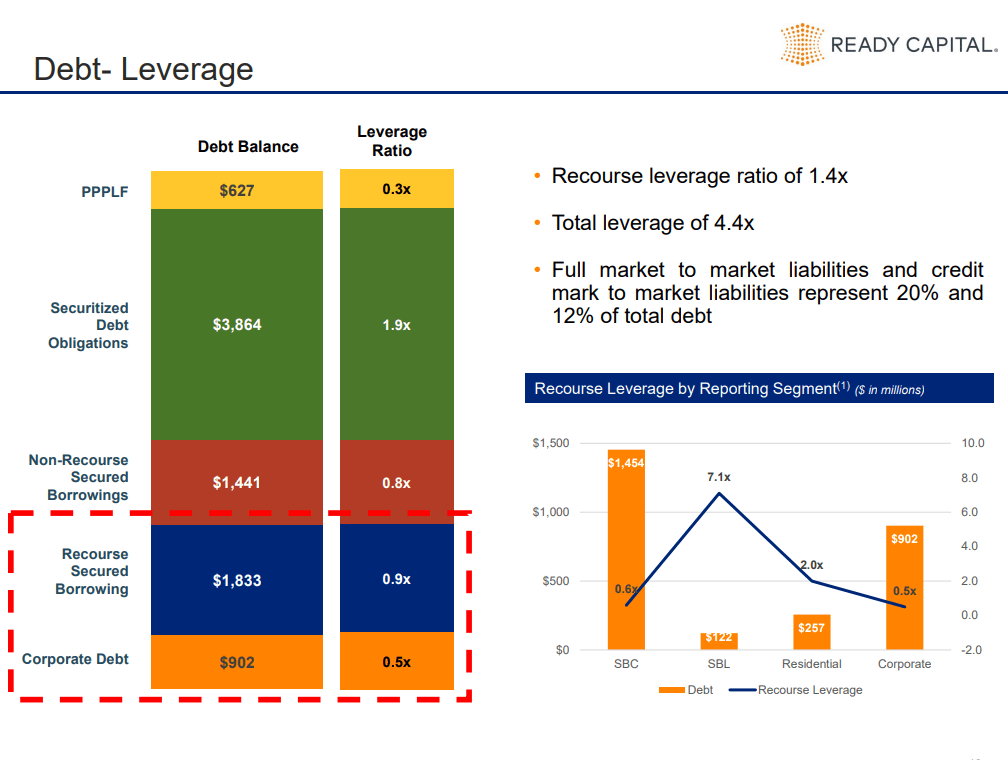
That’s nice when the REIT owns assets that are not agency MBS.
That’s enough bullish picks. Time for bearish ratings. These are positions we couldn’t “nope” much harder if we tried.
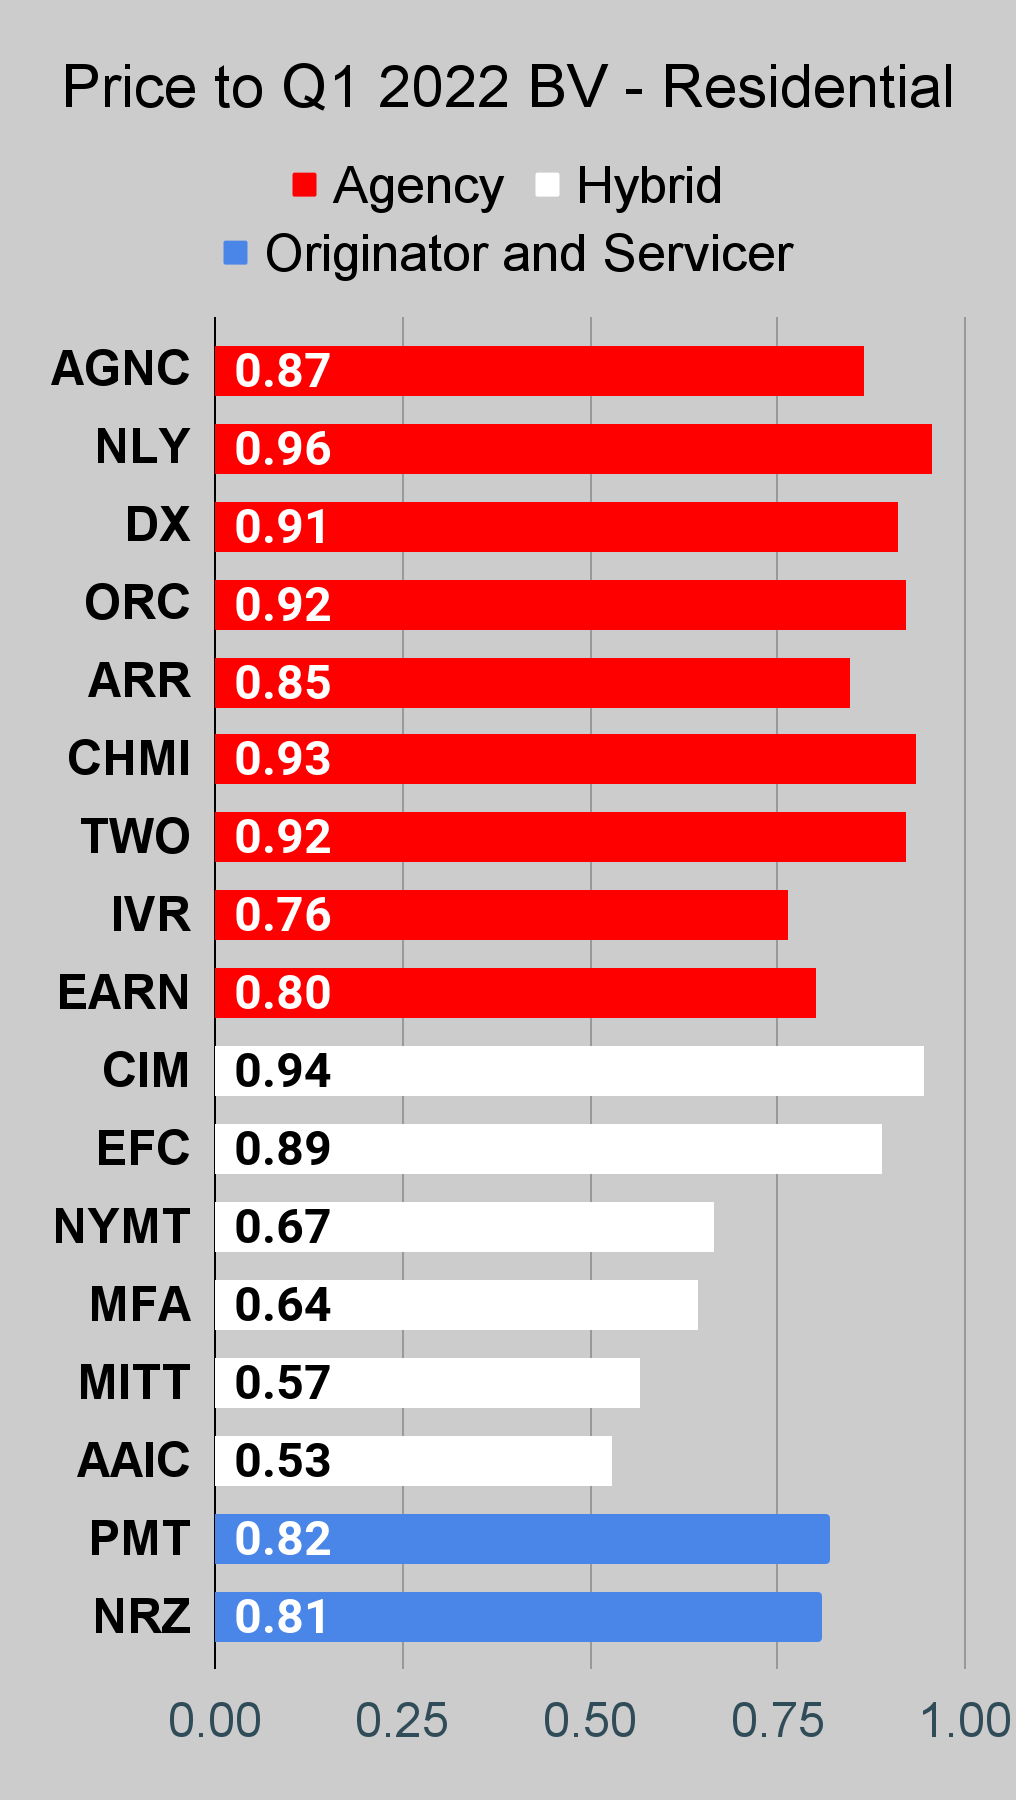
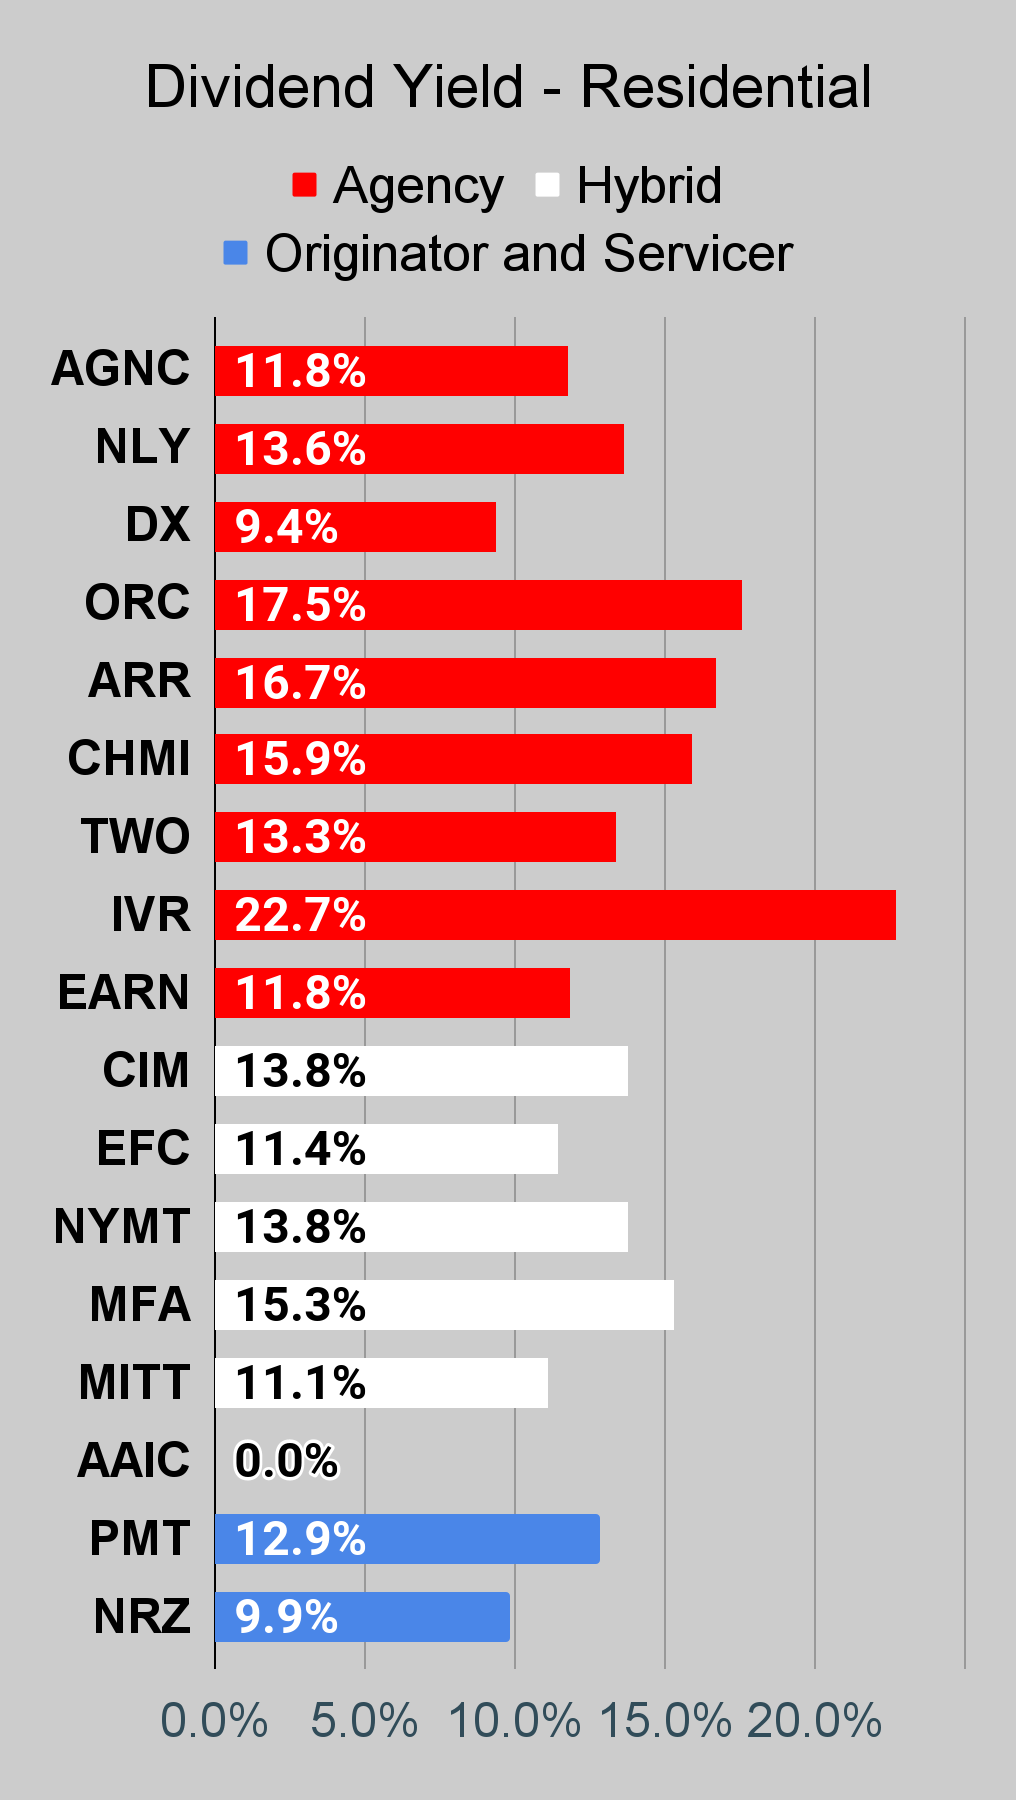
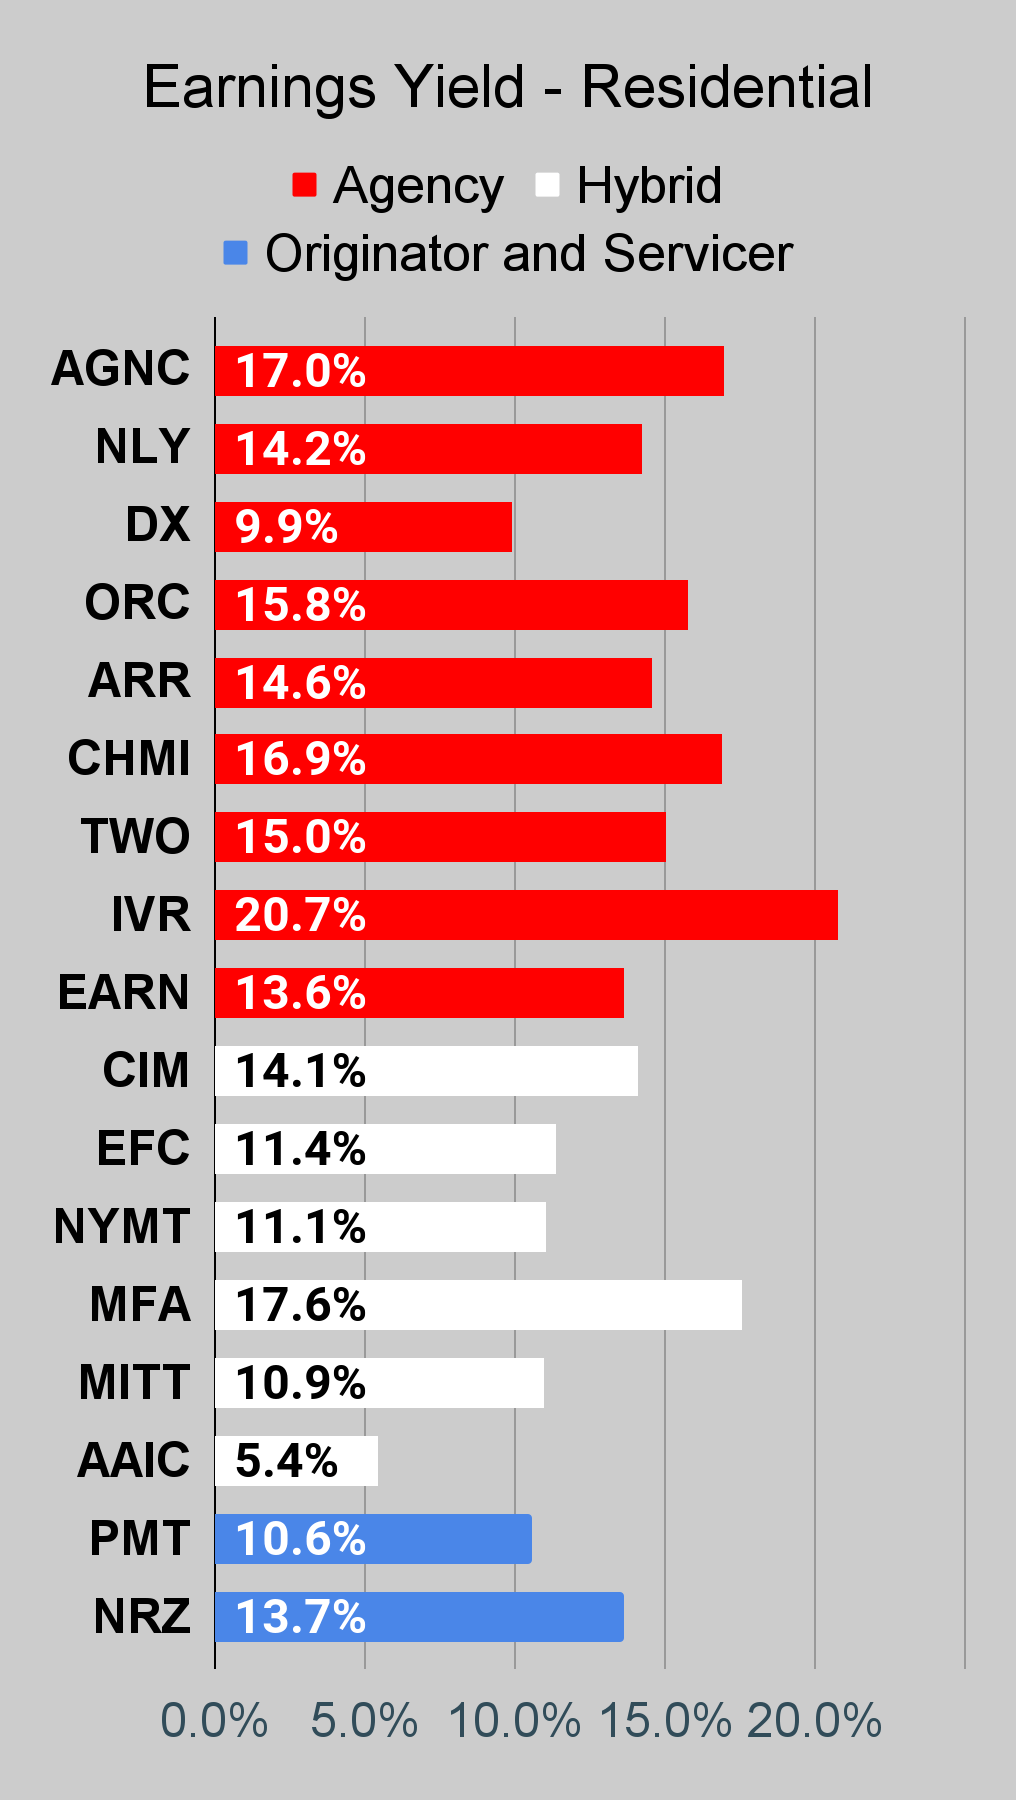
I’m not into Orchid Island Capital (ORC). Q1 2022 was awful. Q2 2022 was awful. Book value got slapped hard.
The REIT Forum
Sure, we’re using our estimates for book value. Maybe you think we’re wrong. Best of luck on that theory. ORC already reported Q2 2022 book value at $2.87. That’s based on management’s estimate. So you’re welcome to disagree, it just won’t mean much.
We’re going bearish on Cherry Hill Mortgage (CHMI) also. It’s like New Residential (NRZ) without the great track record, the platform for origination, or even the discount to book. Basically, it’s just a worse version for a higher price.
The REIT Forum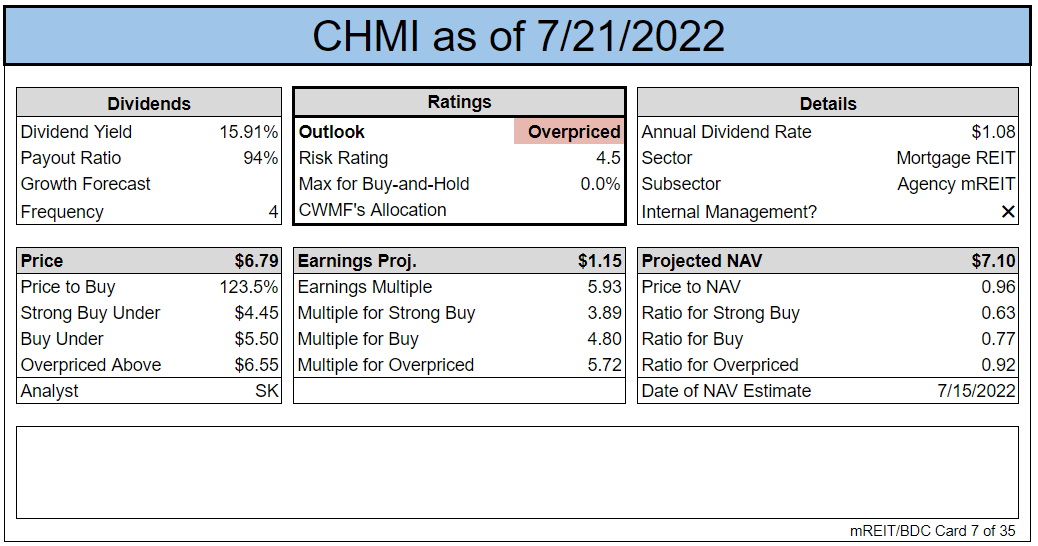
CHMI’s earnings have regularly disappointed over the last few years, so the right time to be bearish on CHMI has been almost any time the sun is up. Or down. It doesn’t really matter. Basically always.
Remember, book value is the key to generating long-term performance. Let’s review CHMI’s book value history:
TIKR.com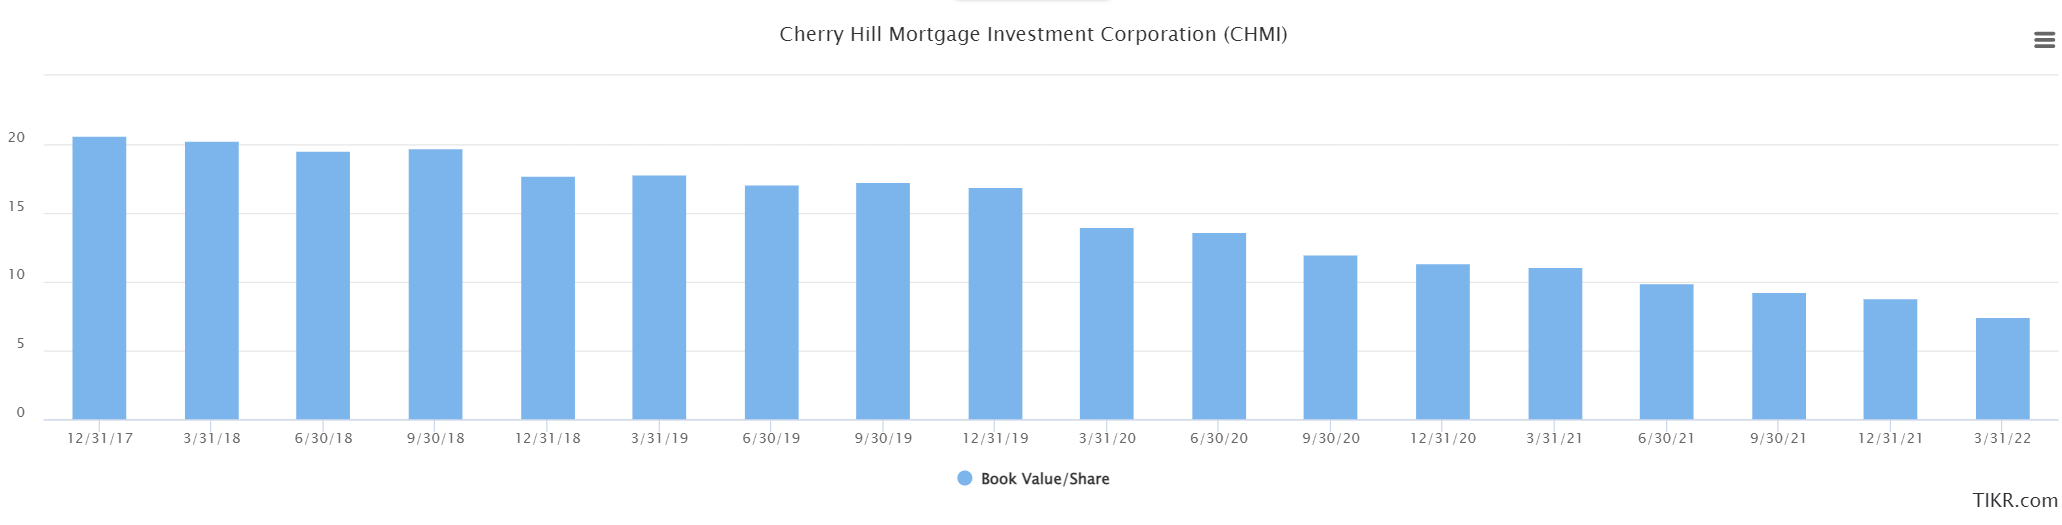
Clear enough?
We’re also getting a bit bearish on Annaly Capital Management (NLY) again. It has been back and forth a bit, but the valuation swung to “too expensive” once again.
The REIT Forum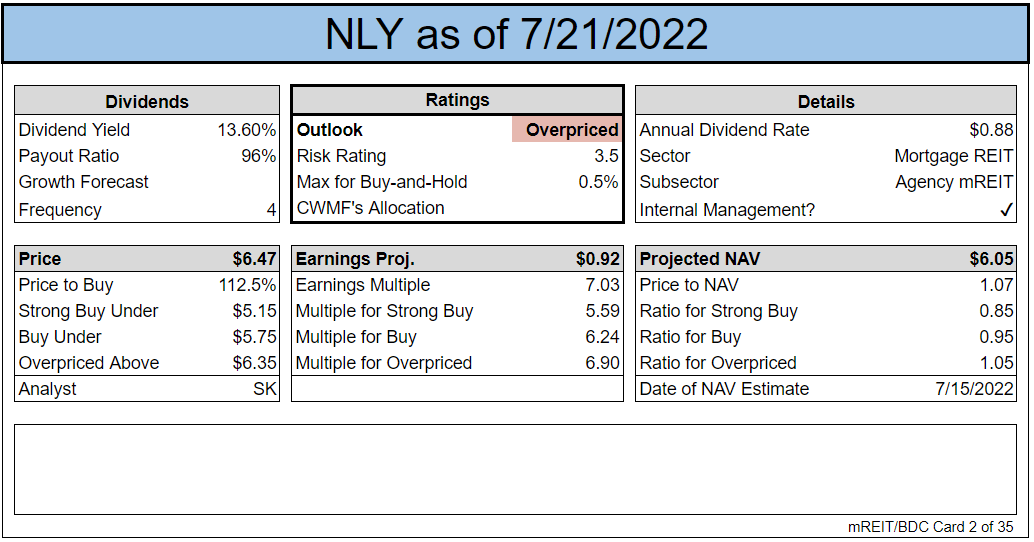
By our estimate, NLY is trading about 7% over book value. Once they report earnings, the first thing on their mind should be pumping out new shares. It would be silly not to do it if the premium is around 7%. Even after underwriting discounts the offering could be accretive. Do I want to pay 7% over book value for NLY? No.
Other Things I Want To Say
Ya know what has a lower price-to-book ratio? Dynex Capital (DX). That’s a better choice than NLY. If investors want to play with the agency mREITs, DX is trading slightly below the average price-to-book ratio despite being the best. Don’t think they are the best? Review Q1 2022 and get back to me. Not enough? Go review the 2 years before that as well.
Want to hear something else crazy? Chimera Investment Corporation (CIM) trades at about an 8% premium to book. Their preferred shares trade between 11% and 20% discounts to call value. 3 of those shares eventually have floating rates and the other has an 8% fixed rate dividend. Due to the discounted share price, the stripped yield there is 9.13%.
It’s not the only case of that happening. NLY-I (NLY.PI) trades at $22.35. If shares were floating today the stripped yield would be 8.76%. You can say “investors are scared because the recession is super scary” if you want. Just remember NLY has a material premium to projected book value. So it’s not like investors are scared to grab the common shares which don’t have seniority.
A rating for that also? Sure. Bullish on NLY-I. Those shares should trade much closer to $25.00.
That’s enough for this piece. Want to read more? I wrote a huge piece on EQIX which got about 16 page views. It has pictures also, but no sailfish. That was probably what doomed it, but that’s evidence that the sailfish don’t go to articles with lower dividend yields.
The rest of the charts in this article may be self-explanatory to some investors. However, if you’d like to know more about them, you’re encouraged to see our notes for the series.
Stock Table
We will close out the rest of the article with the tables and charts we provide for readers to help them track the sector for both common shares and preferred shares.
We’re including a quick table for the common shares that will be shown in our tables:
Let the images begin!
Residential Mortgage REIT Charts
Note: The chart for our public articles uses the book value per share from the latest earnings release. Current estimated book value per share is used in reaching our targets and trading decisions. It is available in our service, but those estimates are not included in the charts below.
 The REIT Forum |
 The REIT Forum |
 The REIT Forum |
Commercial Mortgage REIT Charts
 The REIT Forum |
 The REIT Forum |
 The REIT Forum |
BDC Charts
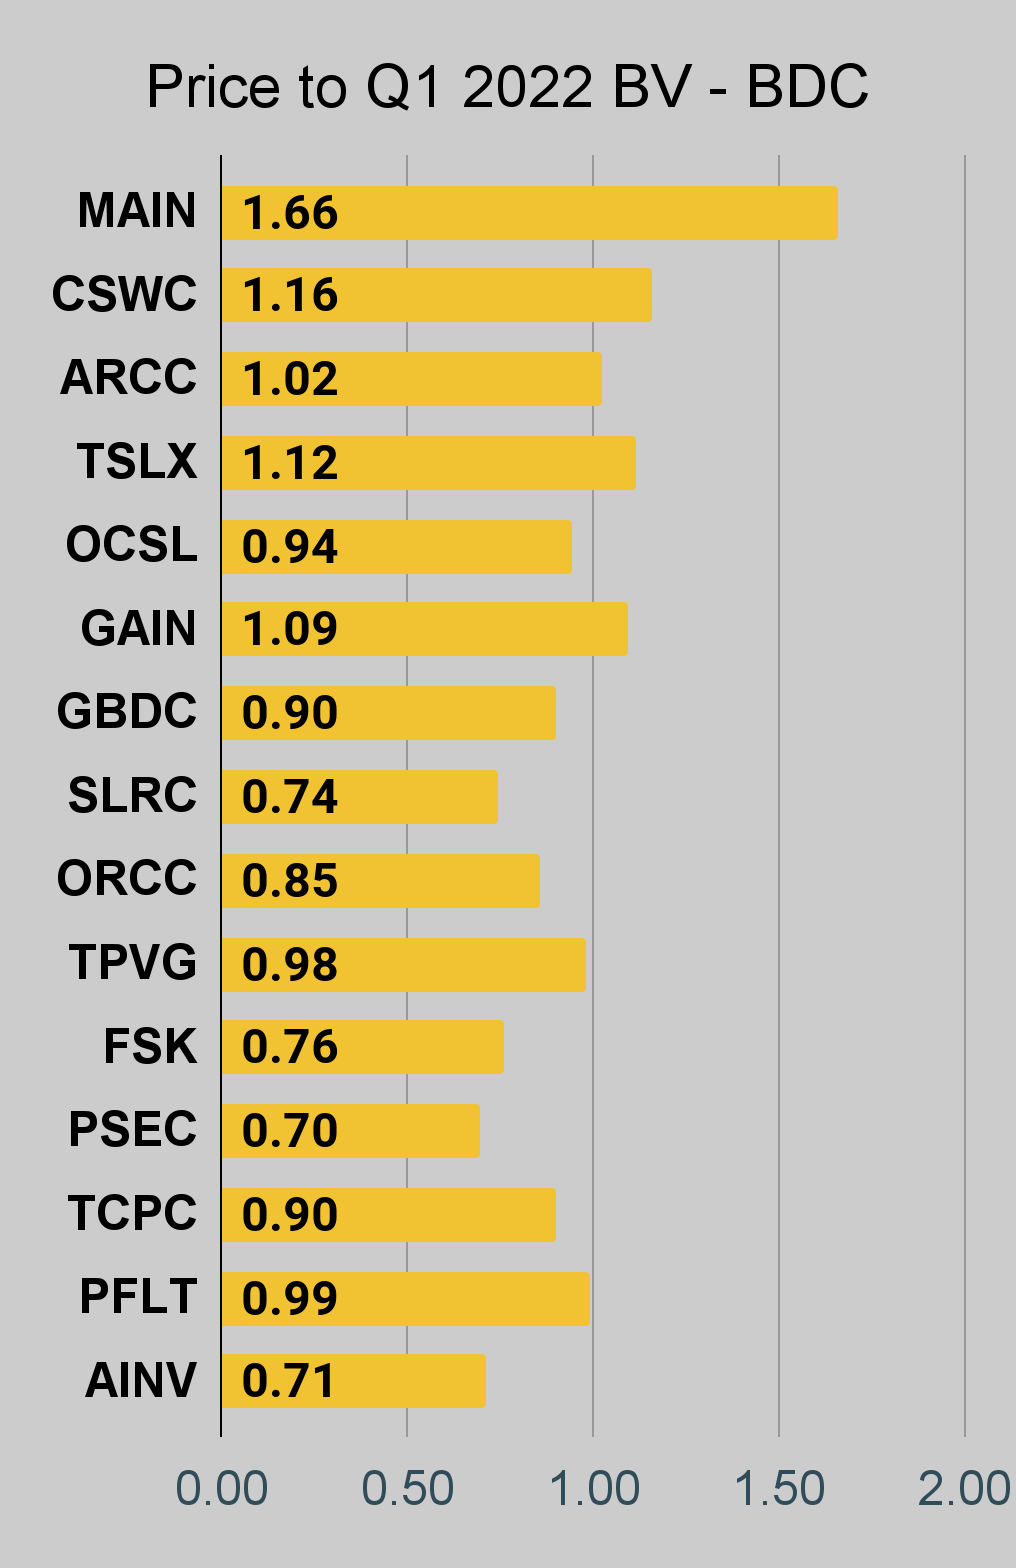 The REIT Forum |
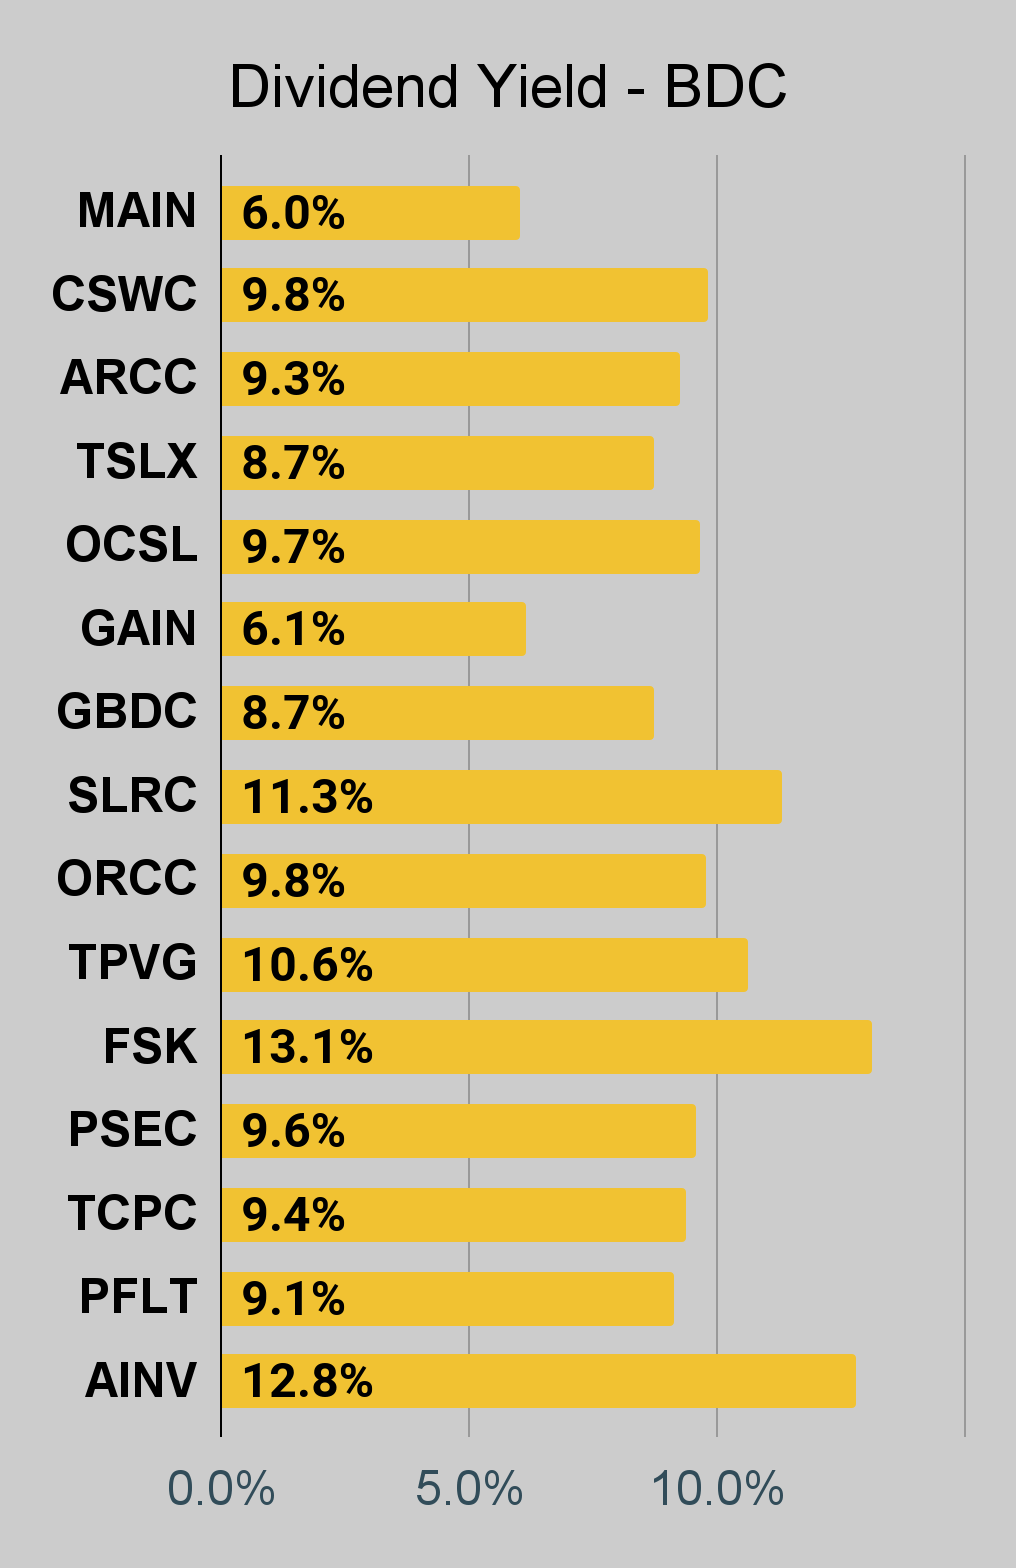 The REIT Forum |
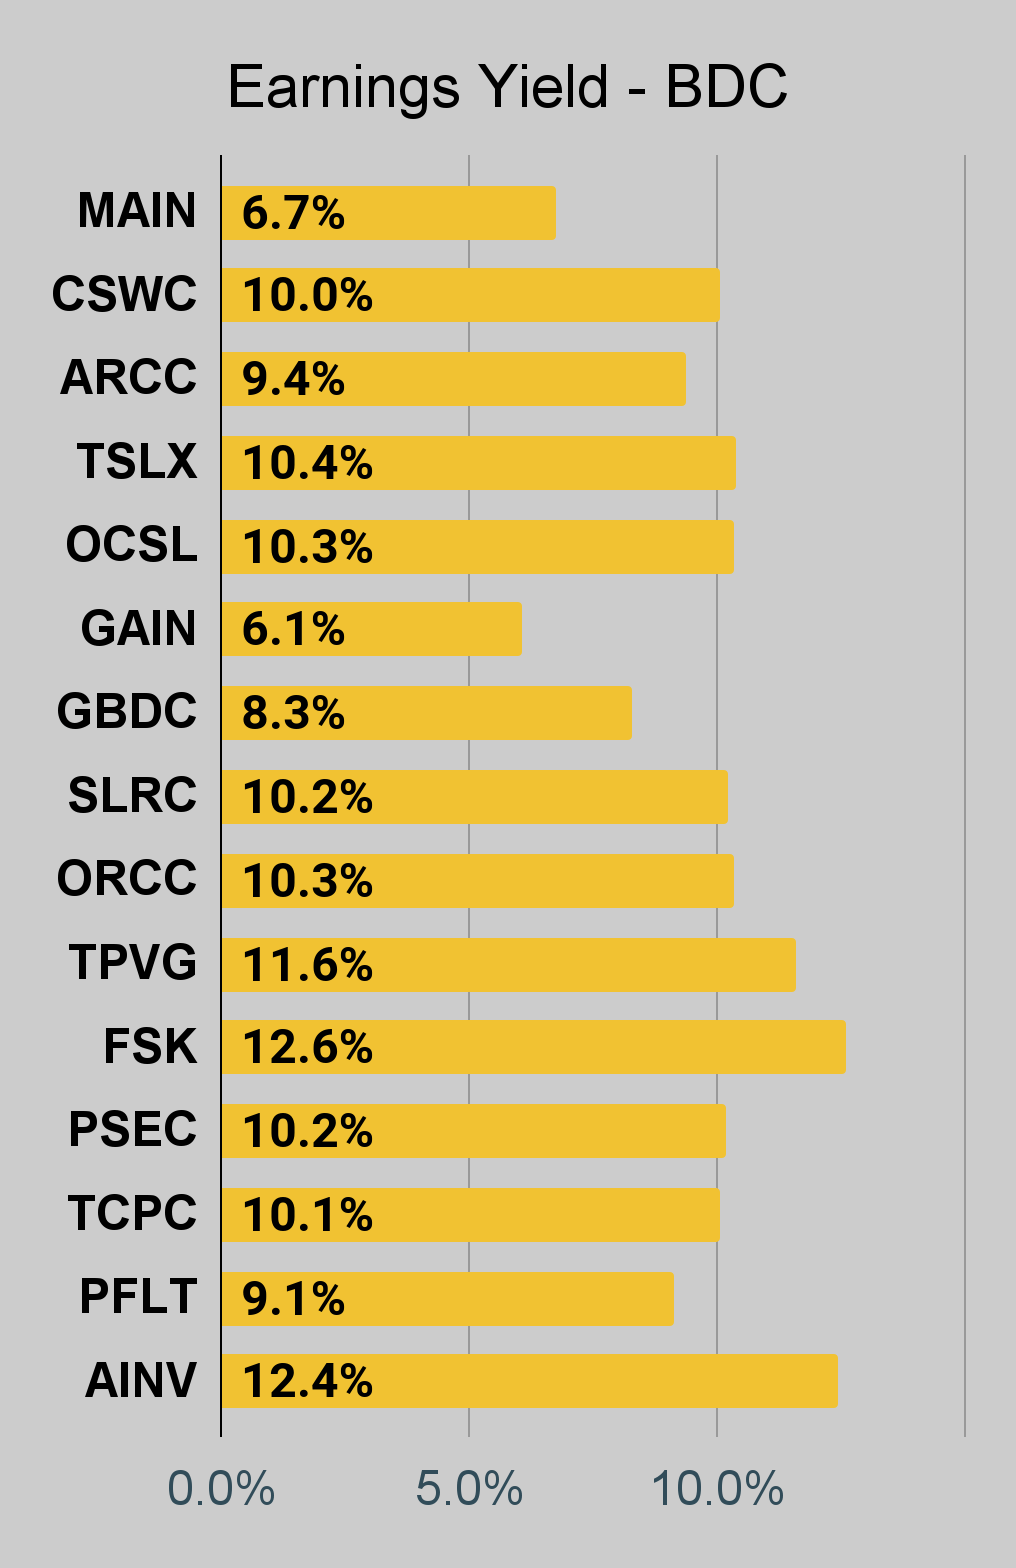 The REIT Forum |
Preferred Share Charts
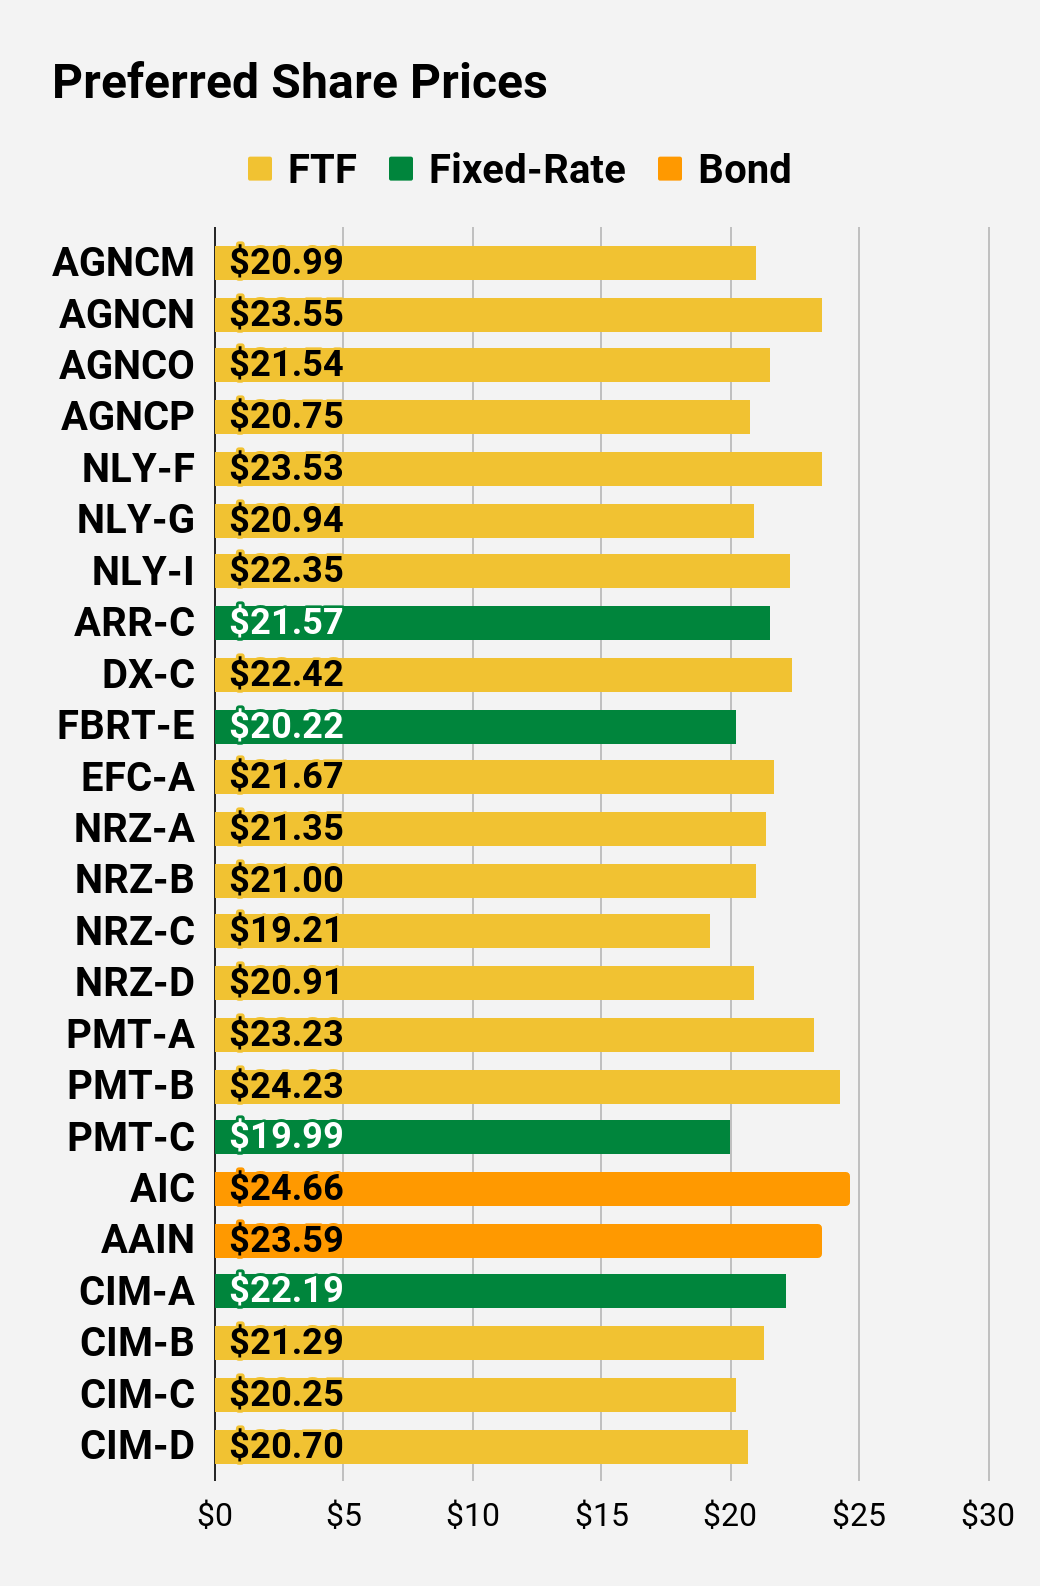 The REIT Forum |
 The REIT Forum |
 The REIT Forum |
 The REIT Forum |
 The REIT Forum |
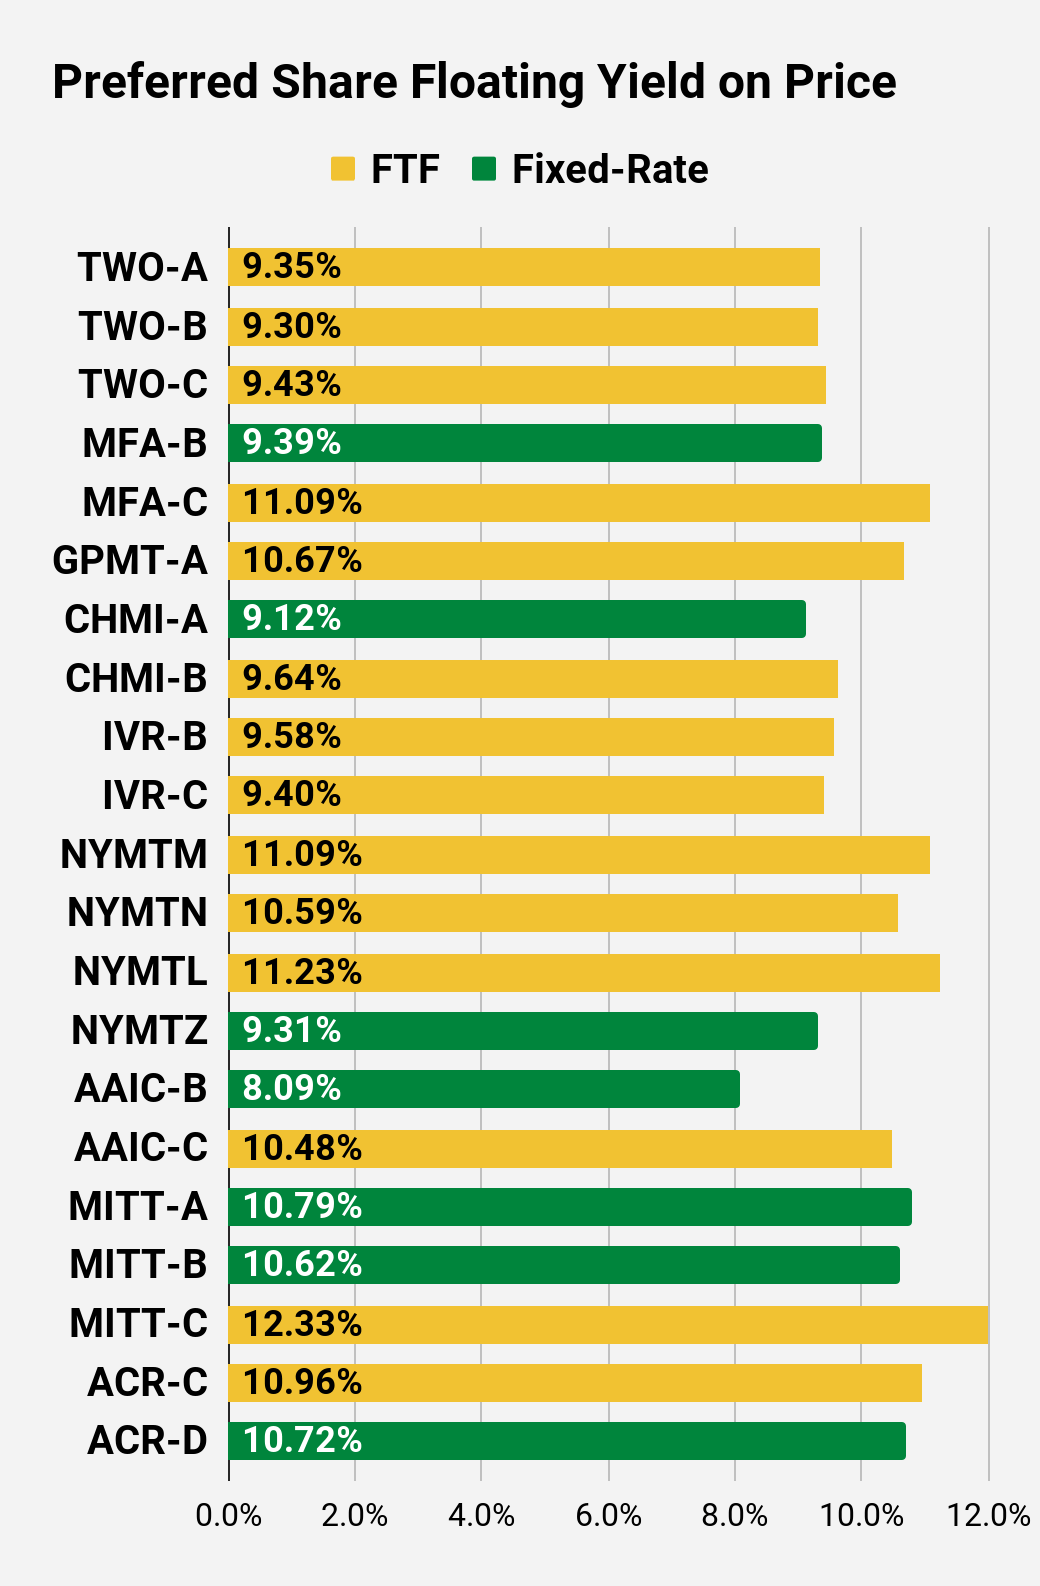 The REIT Forum |
Preferred Share Data
Beyond the charts, we’re also providing our readers with access to several other metrics for the preferred shares.
After testing out a series on preferred shares, we decided to try merging it into the series on common shares. After all, we are still talking about positions in mortgage REITs. We don’t have any desire to cover preferred shares without cumulative dividends, so any preferred shares you see in our column will have cumulative dividends. You can verify that by using Quantum Online. We’ve included the links in the table below.
To better organize the table, we needed to abbreviate column names as follows:
- Price = Recent Share Price – Shown in Charts
- BoF = Bond or FTF (Fixed-to-Floating)
- S-Yield = Stripped Yield – Shown in Charts
- Coupon = Initial Fixed-Rate Coupon
- FYoP = Floating Yield on Price – Shown in Charts
- NCD = Next Call Date (the soonest shares could be called)
- Note: For all FTF issues, the floating rate would start on NCD.
- WCC = Worst Cash to Call (lowest net cash return possible from a call)
- QO Link = Link to Quantum Online Page
Second Batch:
Strategy
Our goal is to maximize total returns. We achieve those most effectively by including “trading” strategies. We regularly trade positions in the mortgage REIT common shares and BDCs because:
- Prices are inefficient.
- Long-term, share prices generally revolve around book value.
- Short-term, price-to-book ratios can deviate materially.
- Book value isn’t the only step in analysis, but it is the cornerstone.
We also allocate to preferred shares and equity REITs. We encourage buy-and-hold investors to consider using more preferred shares and equity REITs.
Performance
We compare our performance against 4 ETFs that investors might use for exposure to our sectors:
THE REIT Forum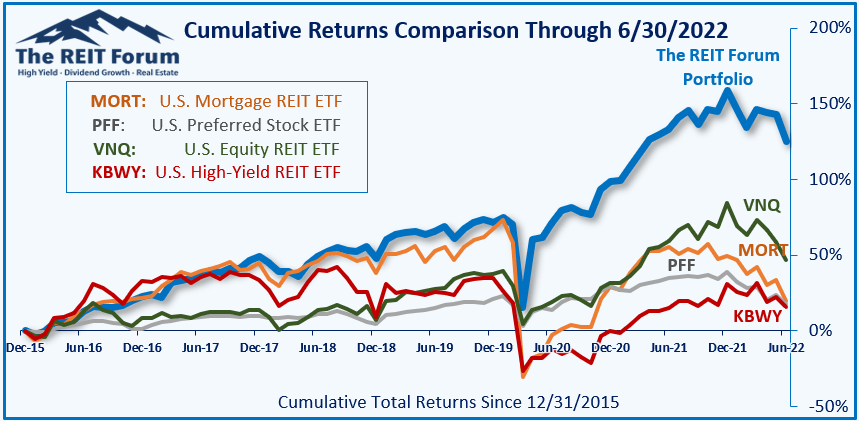
The 4 ETFs we use for comparison are:
|
Ticker |
Exposure |
|
One of the largest mortgage REIT ETFs |
|
|
One of the largest preferred share ETFs |
|
|
Largest equity REIT ETF |
|
|
The high-yield equity REIT ETF. Yes, it has been dreadful. |
When investors think it isn’t possible to earn solid returns in preferred shares or mortgage REITs, we politely disagree. The sector has plenty of opportunities, but investors still need to be wary of the risks. We can’t simply reach for yield and hope for the best. When it comes to common shares, we need to be even more vigilant to protect our principal by regularly watching prices and updating estimates for book value and price targets.
- Ratings for Preferred Shares: Bullish on NRZ-A, NRZ-B, NRZ-C, NRZ-D, MFA-B, MFA-C, NLY-I
- Ratings for Common Shares: Bullish on RC. Bearish on ORC, CHMI, and NLY.
Be the first to comment