

everythingpossible
Thesis
Tekla Life Sciences Investors (NYSE:HQL) is a closed-end fund focused on biotechnology and pharmaceutical stocks. The vehicle employs no leverage and sports a 1.24% annual expense ratio. The fund has a low Sharpe ratio of 0.17 and a standard deviation of 19. The CEF runs some concentrated positions, with a high allocation to Amgen (AMGN), Regeneron (REGN), and Gilead (GILD), its top holdings.
HQL has an annualized 5-year range total return of only 2.3%, while its 10-year range annualized return sits at 9.8%. The article compares HQL to a plain vanilla sector exchange-traded fund (“ETF”), namely the Health Care Select Sector SPDR Fund (XLV), and observes a significant outperformance by XLV:
Analytics (Author)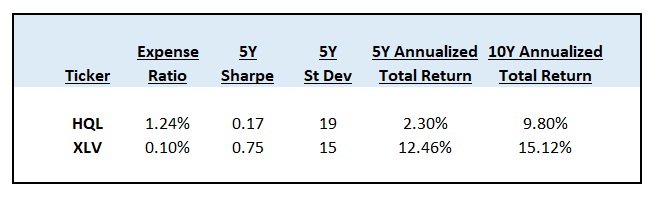
We can observe that XLV has a lower expense ratio, a higher Sharpe and higher annualized long-term returns when compared to HQL. As a reminder, HQL employs no leverage, hence one of the main components of looking at a CEF structure is not utilized.
To quickly revisit the topic, a closed-end fund (“CEF”) structure basically allows a vehicle to employ more complex financial strategies that would otherwise be available for an ETF or a mutual fund. Leverage namely is one of the main characteristics for which a CEF is known – a retail investor looking to buy junk bonds and going long an ETF will need to be satisfied with the long-term ~4% return that the asset class yields. The CEF structure has allowed that same return to be pumped up to 9%-10% via leverage. The CEF wrapper also allows a manager to embed options strategies (buy-write for example) that would otherwise not be available for plain vanilla vehicles.
In the case of HQL, there is no leverage and there are no options, hence we do not see the reason for which an investor should pay a 1.24% fee unless there is a significant outperformance by the vehicle. There is none. In fact, HQL underperforms a plain vanilla ETF in the space that charges only 10 bps in fees. Yes, the CEF structure does allow for the transformation of capital gains into monthly dividends, but when the underlying portfolio is not gaining in value, the distributions are mostly return of capital (“ROC”). This is what we are seeing with HQL now.
HQL is a CEF that does not employ any of the CEF-specific tools to justify its high management fees. The fund has underperformed a plain vanilla ETF in the space and currently distributes its investors’ own principal back via a high ROC allocation. We do not see any compelling reasons to hold this CEF and would only revisit if the manager starts posting solid returns and outperforms the plain vanilla ETF XLV.
Analytics
AUM: $380 mm.
Expense Ratio: 1.24%.
Discount/Premium: -7.5%.
Z-Stat: -1.69.
Leverage: 0%.
Sharpe: 0.17 (5-year).
St Dev: 19 (5-year).
Yield: 9.36%.
Holdings
The top holdings in the portfolio as of Q1 2022 are as follows:
Top 10 Holdings (Fund Fact Sheet)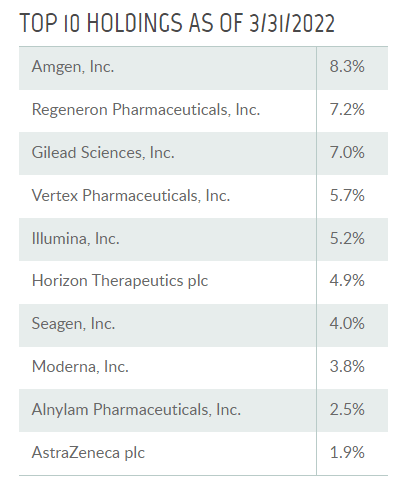
We can note a high single stock concentration for a number of issuers. One of the basic portfolio construction theories states that no single name should account for more than 5% of a portfolio, unless the investor wants to take significant name-specific risk. This CEF’s portfolio is overly concentrated in a number of names: Amgen, Regeneron Pharma, Gilead Sciences, and Vertex Pharma (VRTX).
The fund really specializes in biotechnology stocks:
Sub Sector Allocation (Fund Fact Sheet)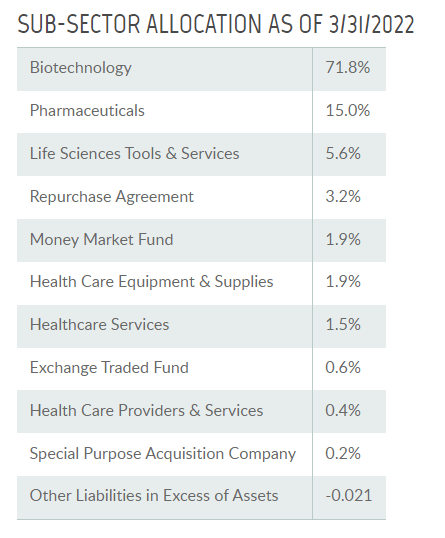
Most of the underlying holdings are common equities, although the fund has some preferred convertibles as well:
Asset Allocation (Fund Fact Sheet)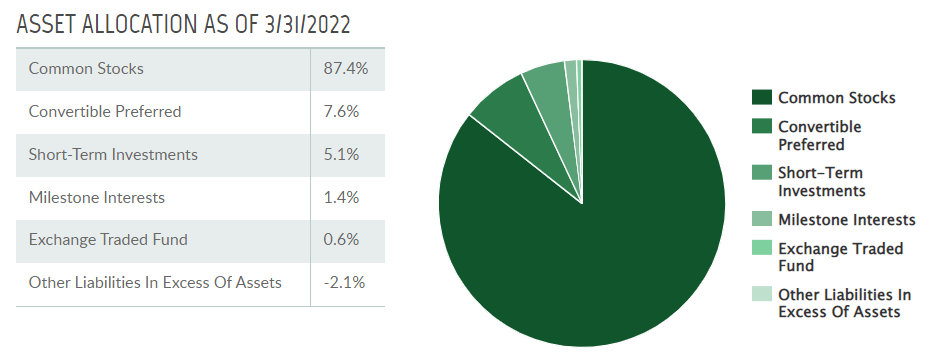
We can see from the above table that HQL is a common equities fund with most of the exposure allocated to common stocks.
Performance
The fund is down -18% year to date versus only -6.2% for XLV:
YTD Performance (Seeking Alpha)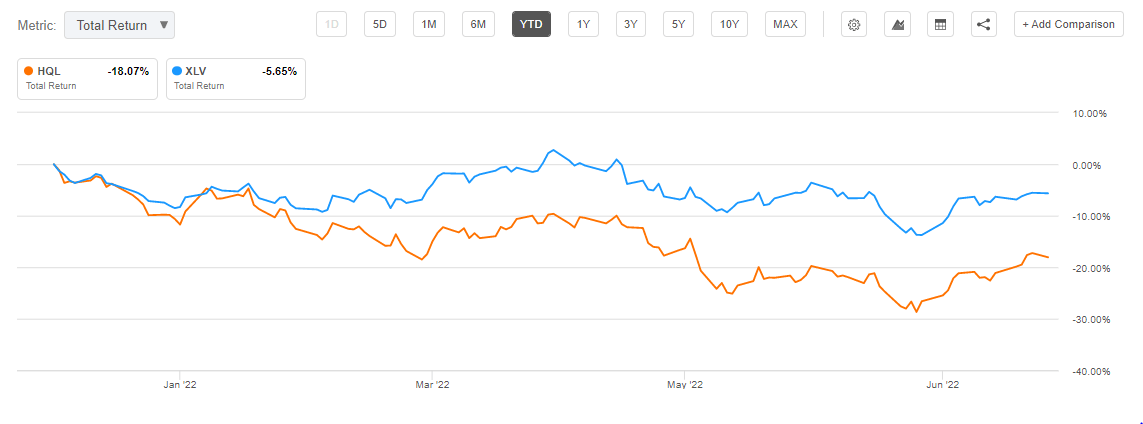
The above is a total return graph, hence dividend distributions are factored in. In essence, HQL shows a -3x underperformance year to date.
The story is similar on a 5-year basis as well:
5-Year Total Return (Seeking Alpha)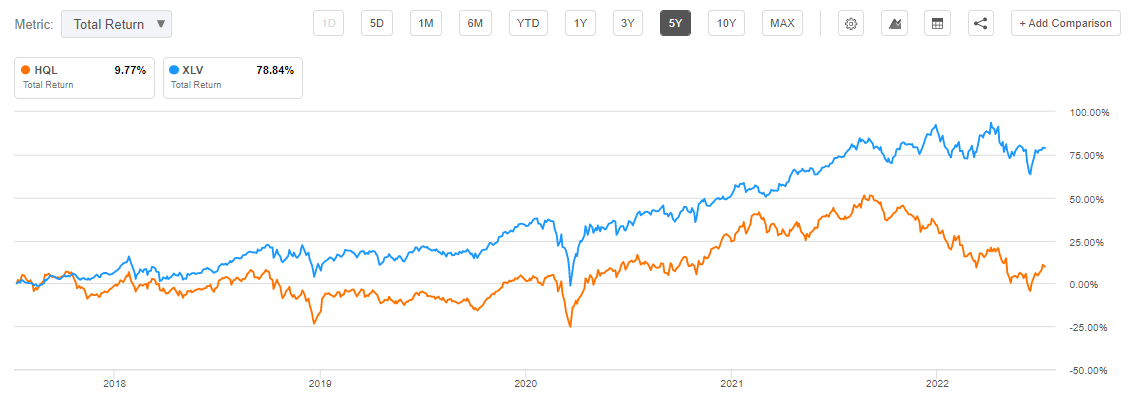
The CEF is now barely positive on a 5-year basis, with the healthcare sector ETF still up almost +80% for the past five years.
A ten-year chart paints a slightly different, but quite interesting, picture:
10-Year Total Return (Seeking Alpha)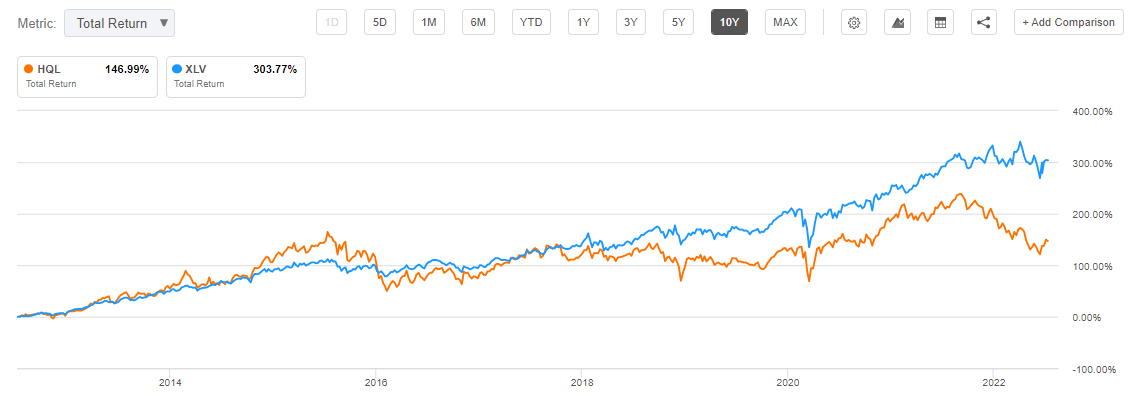
We can see that on a decade-long graph, HQL is finally positive, but the fund still significantly underperforms the much simpler and cheaper healthcare ETF XLV. We can see that HQL actually shows an outperformance up to 2015, after which the stock selection seems to go astray, with the CEF showing significant underperformance after 2018. We would cheekily call that “active management gone astray.”
At the end of the day, the significant fees a CEF clip when it lacks any leverage are related to management fees. Management fees should translate into alpha generation, which implies that the CEF should at least outperform a plain vanilla ETF. It is not the case here.
Premium/Discount to NAV
The fund is currently trading at a -7.5% discount to net asset value:
Premium/Discount to NAV (Morningstar)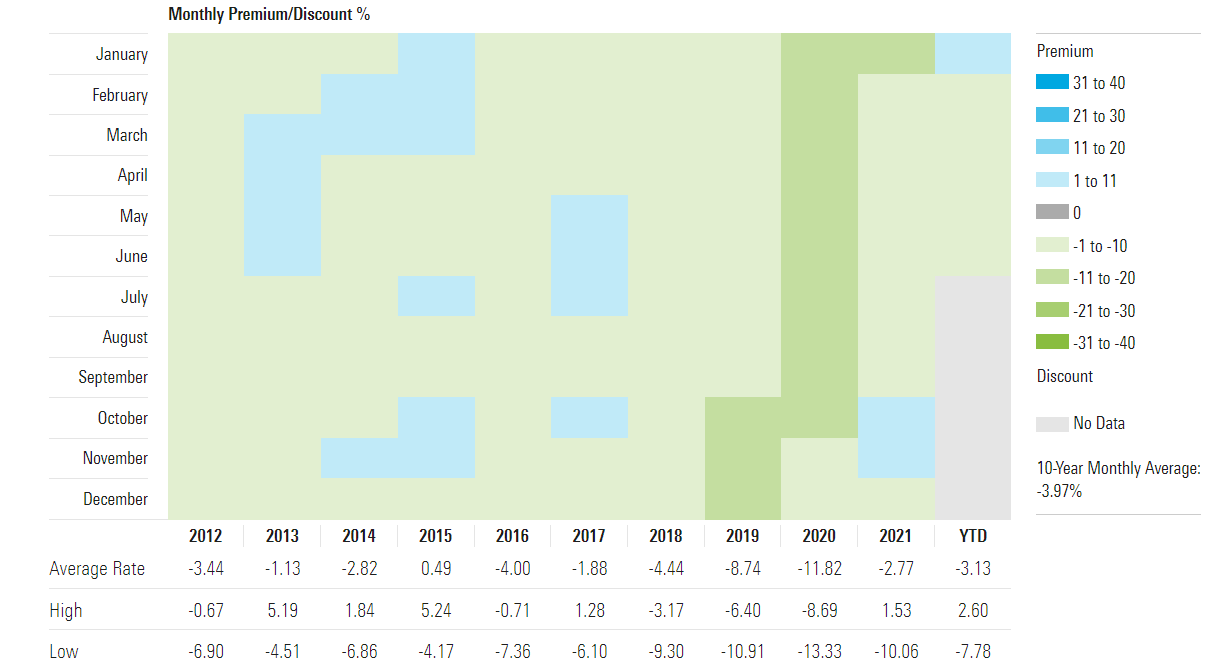
We can see from the historical premium/discount table that the fund has alternated between discounts and premiums throughout the past decade. The current discount is skewed towards the historic wide levels seen for the fund.
We believe that the CEF’s underperformance versus a plain vanilla ETF will continue to result in discounts to NAV. As long as the portfolio managers do not deliver alpha in return for their fees, the CEF wrapper does not add a lot of value in the space.
Distributions
Due to its underperformance in the past years, the CEF now exposes a high return of capital percentage:
Distributions (Section 19A)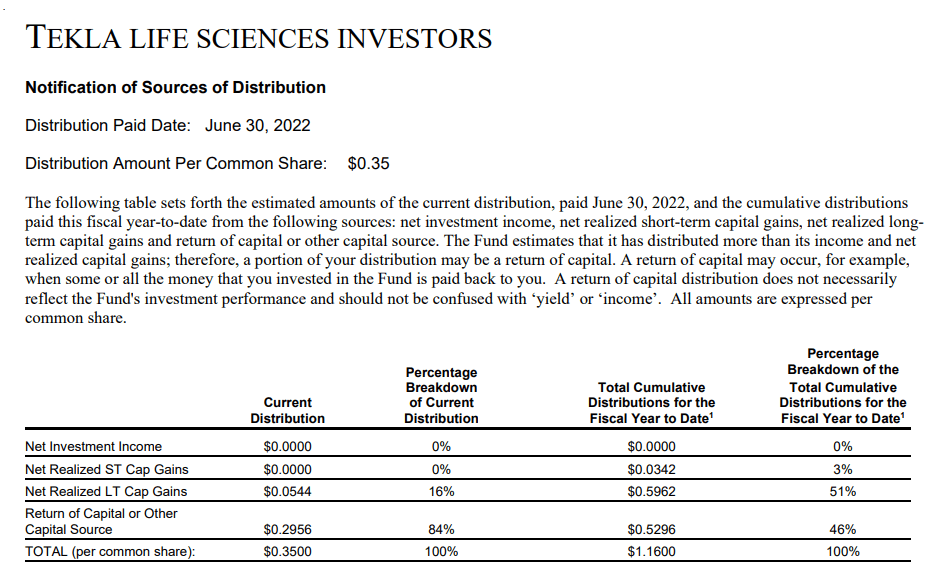
We can see how for the June 2022 distribution date around 46% of the cash is composed of return of capital distributions. Ultimately if the underlying stocks in the portfolio do not gain in value the ROC portion of the distribution is only going to increase. The only source of funds for an equity CEF that does not employ options is the capital appreciation of underlying stocks.
Conclusion
HQL is a CEF focused on the pharma and biotechnology equity space. The vehicle does not employ any leverage and has high annual management fees of 1.24%. The vehicle has posted positive annualized total returns on a 5- and 10-year basis but significantly underperforms a plain vanilla ETF in the space, namely XLV. Because of its recent underperformance, the fund has an unsupported dividend yield and a high return of capital allocation. We do not see any compelling reasons to hold this CEF and would only revisit if the manager starts posting solid returns that outperform the market.
Be the first to comment