

Justin Sullivan
Although HP Inc. (NYSE:HPQ) had the largest share in the Hardcopy Peripherals market, its 5-year average revenue growth in the printing segment (2.58%) is lower compared to the personal systems (PC) segment (7.80%). Hence, we analyzed the growth drivers for each segment to determine the reason for the higher growth in its PC segment, then projected HP’s revenue.
HP, Khaveen Investments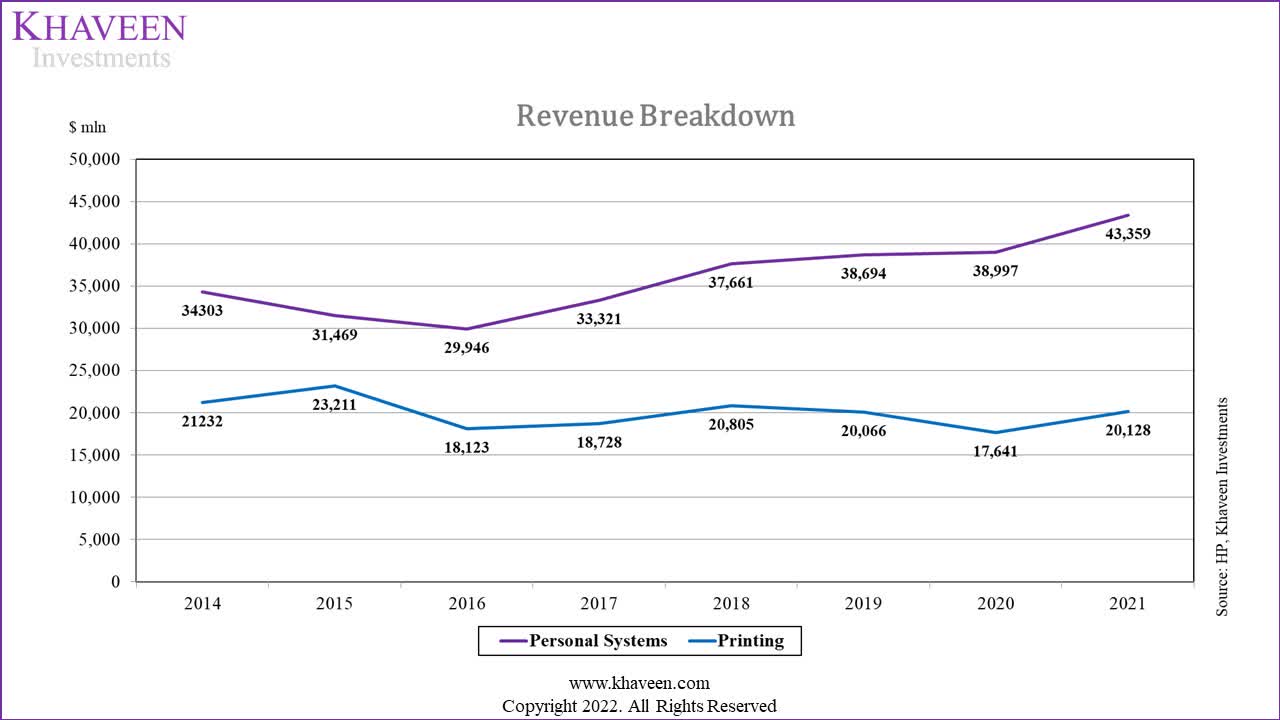
Drivers Across Commercial & Personal PCs
Gartner, Khaveen Investments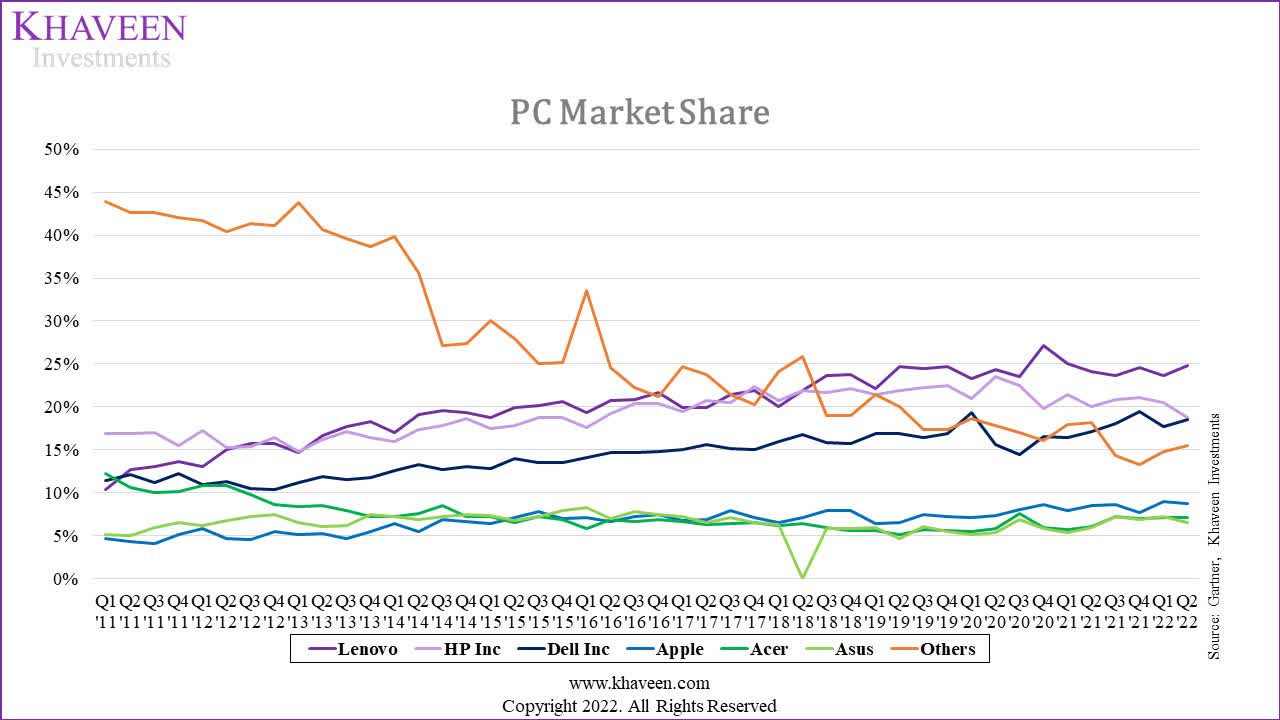
As observed from the PC market share chart from our previous analysis of Apple (AAPL), since Q3 2018, HP had the second largest market share, whereas Lenovo (OTCPK:LNVGY) had the largest market share. HP’s market share declined slightly from Q3 2017 (13.77%) to Q2 2022 (13%). However, the company’s personal systems segment had average 5-year revenue growth of 7.80%. We then analyzed the drivers for the segment growth based on commercial and personal usage.
The average 11-year growth for the PC market is -1.93% based on PC shipments. The growth in the shipments for all companies is higher than the market except for Acer and Others (none top-6 companies) with an average growth of -4.43% and -10.30% respectively.
Commercially, PCs are needed to connect with stakeholders. The increasing spending on hybrid work solutions as mentioned by the company further boosted demand for commercial PCs.
Much of this innovation is being driven by the rise of the hybrid office. Our devices are what’s enabling people to connect, create and collaborate across multiple locations and do it securely. – Enrique Lores, President & Chief Executive Officer
kof, Khaveen Investments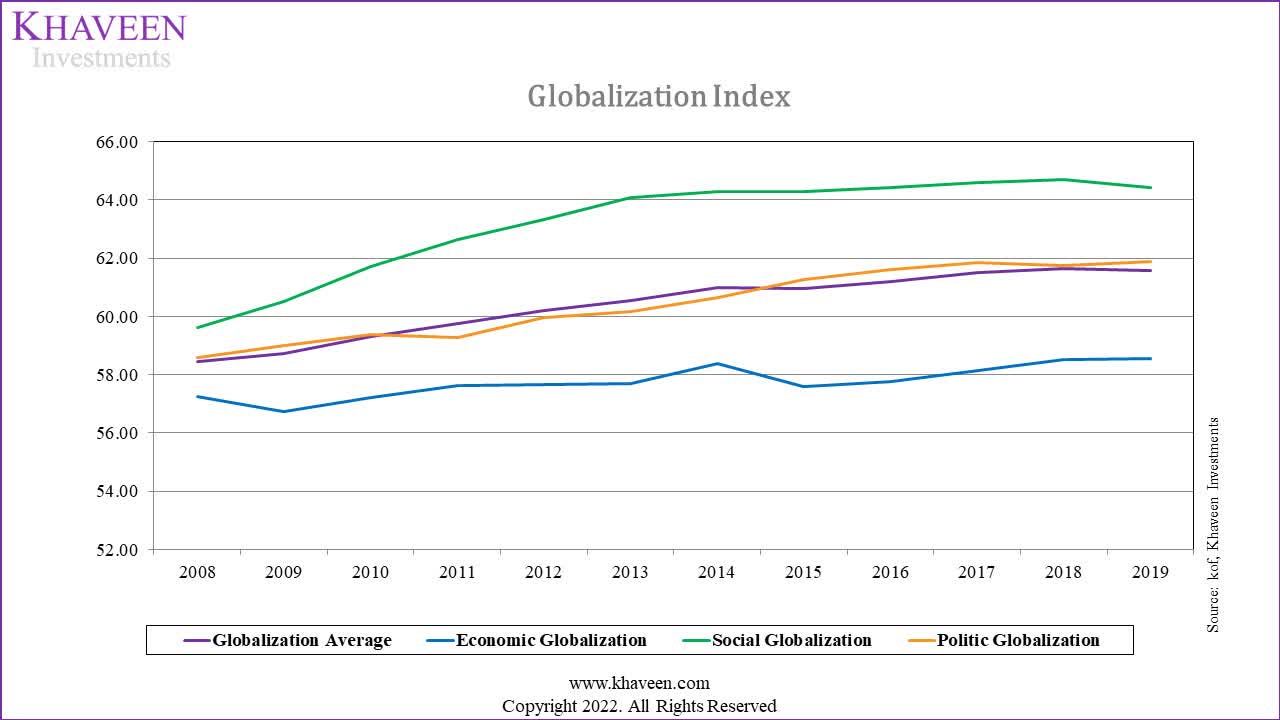
Hence, we believe that there is an increasing need for PCs to facilitate business connectivity due to globalization. As shown, from 2008 to 2019 the globalization index from all aspects had increased indicating increasing globalization. Therefore, we believe increasing globalization is important in driving the growth of PCs.
Furthermore, a personal PC is used for:
multimedia entertainment, playing PC games, and accessing the Internet
such as social media and news. We believe the increased time spent on online activities can be measured by the daily time spent on social networking, which increased from 90 minutes per day in 2012 to 147 minutes per day in 2022. We believe the rise of the internet should continue to drive demand for PCs.
Continued Internet Growth Driving PCs
ITU, Worldometers, Khaveen Investments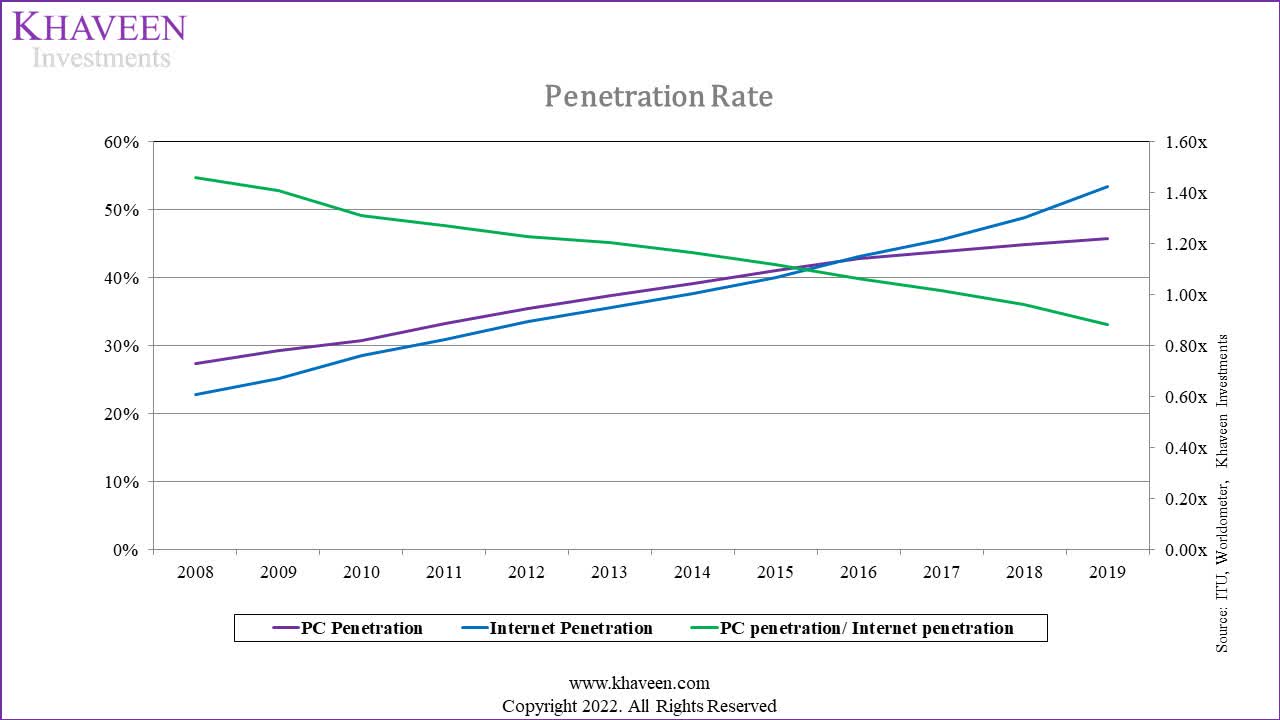
Based on the chart, Internet penetration and PC penetration are positively correlated. The Internet penetration rate increased from 22.8% in 2008 to 53.4% in 2019, and we believe this drove PC penetration. As shown, the PC penetration had increased from 33.20% in 2008 to 47.10% in 2019. We believe that the advancement of Wi-Fi drives better connectivity which supporting higher internet penetration rates.
Trendforce, Khaveen Investments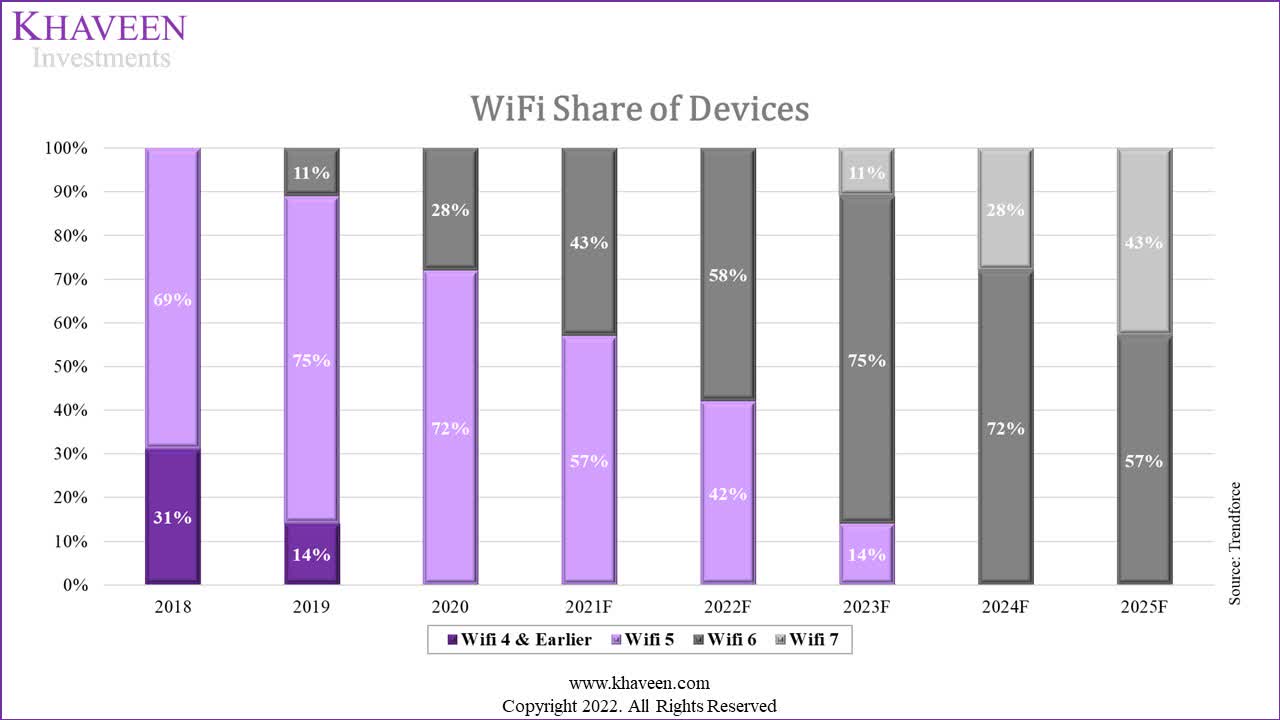
As shown from the chart we obtained from our previous analysis of Qualcomm (QCOM), there is a shift of Wi-Fi 4 and earlier to Wi-Fi 6, where the Wi-Fi 6 share of devices had increased from 0% in 2018 to 28% in 2020, whereas the Wi-Fi 4 and earlier share of devices decreased from 31% in 2018 to 0% in 2020. Overall, the newer version of Wi-Fi technology replaces the older version, showing the advancement of the internet.
As mentioned by Statista:
In developing countries, the PC penetration rate is lower with around a third of households having a computer. In contrast, the share of households with a personal computer in developed countries was closer to 80 percent.
Hence, we believe the emerging markets would be the largest driver of PC growth due to the higher room for PC penetration growth.
We then divide the PC penetration by Internet penetration to determine the factor of Internet penetration on PC penetration over time. As shown below, it decreased from 1.46x in 2008 to 0.88x in 2019. We believe this indicates that a higher increase in Internet penetration would result in a smaller increase in PC penetration in the future with the reason being that many other devices have been made available to connect to the Internet such as smartphones, tablets, televisions and smartwatches.
|
PC Market |
2023F |
2024F |
2025F |
|
Users (‘mln’) |
5,300 |
5,701 |
6,133 |
|
Growth % (‘a’) |
6.0% |
7.57% |
7.57% |
|
World Population |
8,031 |
8,109 |
8,184 |
|
Internet Penetration |
66.0% |
70.3% |
74.9% |
|
Growth % |
5.0% |
6.5% |
6.6% |
|
PC Penetration/ Internet Penetration (‘b’) |
0.74 |
0.70 |
0.67 |
|
Growth % |
-4.5% |
-4.5% |
-4.5% |
|
PC Market Growth (‘c’) |
4.4% |
5.3% |
5.1% |
* c = a x b
Source: ITU, Worldometers, Khaveen Investments
To obtain the projected PC market growth, we multiplied the projected Internet users’ growth and the PC penetration/Internet penetration ratio. Given the ratio had been declining by an average of 4.5%, we continued to account for this decline moving forward in our projections.
|
Personal Systems Revenue Projection |
11-year average |
Factor |
2022F |
2023F |
2024F |
2025F |
|
Personal Systems ($ mln) |
37,275 |
38,947 |
41,053 |
43,173 |
||
|
Growth |
0.03% |
1.02x |
-14.03% |
4.49% |
5.41% |
5.17% |
|
Market Growth |
-1.93% |
Source: HP, Khaveen Investments
We then projected the revenue for HP’s personal systems segment based on the market growth. We first obtained HP’s factor of 1.02x based on the past 11-year HP’s average revenue growth (0.03%) over the average market growth. The factor represents HP’s competitive advantage or disadvantage HP has over its competitors. We then prorated the company’s 2022 revenue based on its Q1 and Q2 results. Additionally, we projected HP’s 3-year revenue growth from 2023 by multiplying our PC market growth forecast and HP’s personal systems factor of 1.02x. Overall, we forecasted the company’s personal systems segment to reach $43,173 mln in revenue in 2025.
Lower Growth in Printing due to the Shift from Print to Online Media
IDC, Khaveen Investments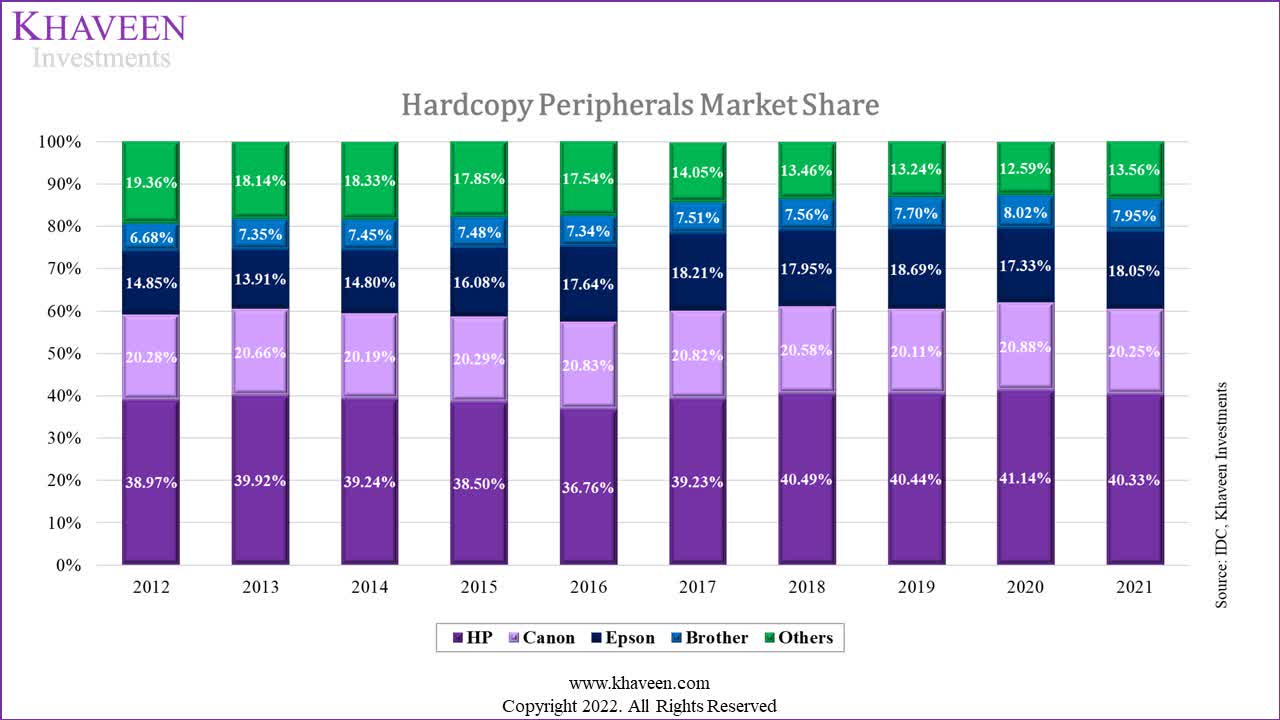
To analyze HP’s Printing segment, we computed the Hardcopy Peripherals market share based on the shipments of each vendor. As mentioned by Statista,
The hardcopy peripherals market covers A2 to A4 single-function printers, multi-function systems, and single-function digital copiers.
As shown in the chart, HP is the market leader as it had always been the largest in the Hardcopy Peripherals market with a 40.33% share in 2021 which is also higher compared to 2012 (38.97%). However, its market share had decreased as compared to 2020 (41.14%). Canon (CAJ) had also always been the second largest with a market share of 20.25% in 2021. It had decreased slightly as compared to 20.28% in 2012. Additionally, Epson (OTCPK:SEKEF) and Brother’s market share had increased from 2012.
HP’s hardcopy peripherals shipments had the third lowest 11-year average growth (-1.45%) whereas Others had the lowest growth of -4.30%. In contrast, Brother had the highest growth of 1.24% followed by Epson with an average growth rate of 0.06%. The average 11-year growth for the hardcopy peripherals market of -1.52%. We believe the negative market growth is due to the shift of print media to online media resulting from reasons such as cost savings and convenience.
Reuters Institute, Khaveen Investments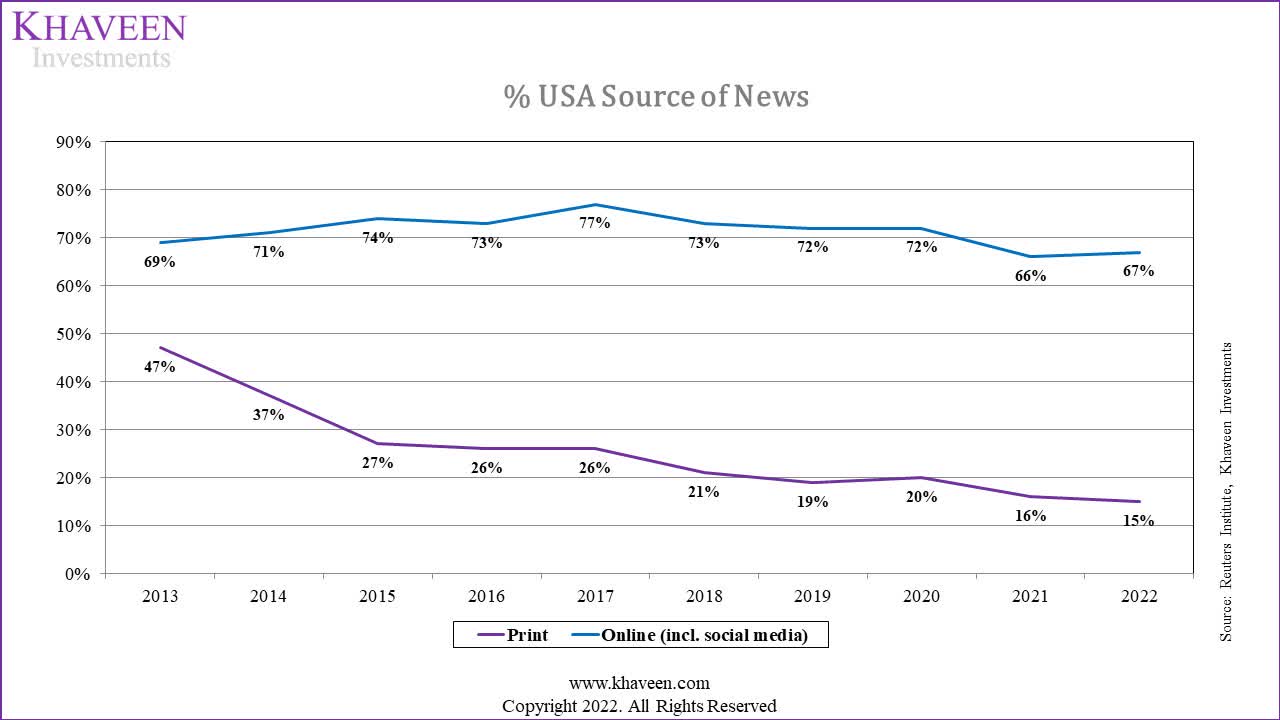
As shown in the chart, the % of the population that sources news online in the USA, such as through social media, remained higher compared to % that sources news through print such as newspapers. Besides, the % of Print had declined continuously from 47% in 2013 to 15% in 2022 whereas % of Online is slightly lower in 2022 (67%) as compared to 69% in 2013. Overall, we believe the decrease in both forms of media as a news source is due to fewer people consuming news in 2022 compared to 2013.
| HP’s Hardcopy Shipments Projection |
11-year average |
Factor |
2022F |
2023F |
2024F |
2025F |
|
Printing Segment Shipments (‘mln’) |
38.67 |
40.51 |
42.43 |
44.45 |
||
|
Growth |
-1.45% |
1.05x |
4.76% |
4.76% |
4.76% |
4.76% |
|
Market Growth |
-1.52% |
4.55% |
4.55% |
4.55% |
4.55% |
Source: IDC, Research and Markets, Khaveen Investments
To forecast HP’s printing segment shipment growth, we obtained HP’s factor of 1.05x based on the past 11-year HP’s average shipment growth (-1.45%) over the 11-year average market revenue growth (-1.52%). The factor represents HP’s competitive advantage or disadvantage HP has over its competitors. We then obtained HP’s 4-year forward revenue growth of 4.76% by multiplying the market CAGR (4.55%) and the factor of 1.05x. Overall, we based our forecast of the company’s revenue growth on our projection of its shipments growth at 4.76% through 2025.
Risk: Smartphones Substitute PCs
We believe that smartphones are advancing to be able to provide more functions that are similar to PC and smartphones are also able to connect to the Internet. Additionally, smartphones are also more portable as compared to PCs. Hence, we believe that smartphones may substitute PCs which may affect HP’s PC segment growth.
Verdict
|
HP Revenue Breakdown ($ mln) |
2022F |
2023F |
2024F |
2025F |
|
Personal Systems |
37,275 |
38,947 |
41,053 |
43,173 |
|
Growth |
-14.03% |
4.49% |
5.41% |
5.17% |
|
Printing |
21,085 |
22,088 |
23,138 |
24,238 |
|
Growth |
4.76% |
4.76% |
4.76% |
4.76% |
|
Total |
58,360 |
61,035 |
64,191 |
67,412 |
|
Growth |
-8.08% |
4.58% |
5.17% |
5.02% |
Source: HP, Khaveen Investments
We projected the revenue growth based on each segment as mentioned in previous points. Moving forward, we expect the company’s total revenue to reach $67,412 mln by 2025. To conclude, we analyzed HP due to the higher growth of its PC segment compared to the printing segment. We believe that the PC segment’s higher growth is due to the internet growth whereas the lower growth in the printing segment is due to the shift from print media to online media. Moreover, we expect HP to have a total 4-year forward average revenue growth of 1.67%. Based on analyst consensus, HP has an average analyst consensus price target of $30.69, translating to an upside of 13.9%, and thus we rate the company as a Buy.
Be the first to comment